Introducing Nightwatch for Laravel | Taylor Otwell & Jess Archer Keynote at LaraconAU 2024
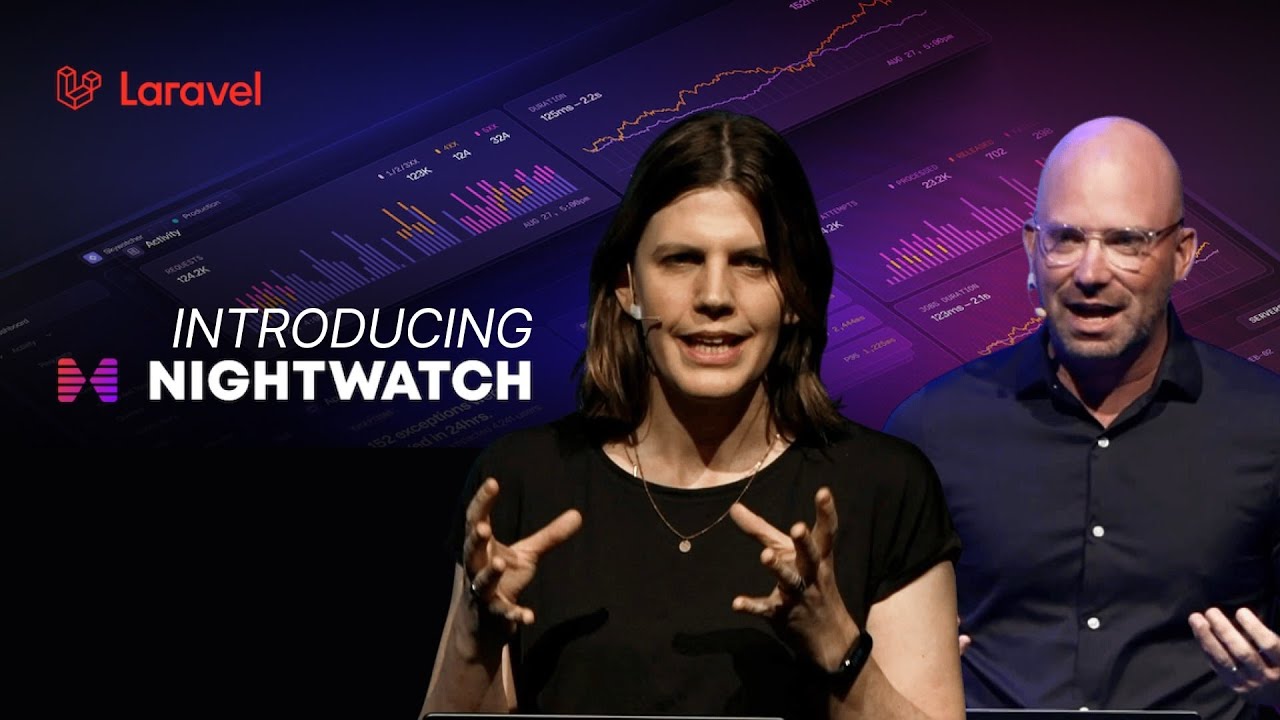
In this Laracon Australia keynote, Taylor Otwell recaps the major Laravel releases from the previous months, including framework features such as Concurrency, Defer, Cache Flexible, and Eloquent Chaperone, as well as Inertia 2.0, a new official VS Code extension, and the upcoming Laravel Cloud platform. He then introduces Laravel Nightwatch, a hosted, Laravel‑specific observability platform, and walks through a live demo with Jess Archer. The demo showcases Nightwatch’s dashboard, request and job tracing, query analysis, mail/notification inspection, outgoing HTTP request monitoring, exception handling, logging integration, user‑centric views, deployment awareness, and alert configuration. The presentation concludes with details on early‑access waitlists, pricing philosophy, quota protection, and the vision for Nightwatch and Cloud as tightly integrated, developer‑friendly services for Laravel applications of any scale.
Chapters
Before Jest comes out, I just wanted to kind of briefly recap what we've been up to the last few months and some of the stuff we announced at Laracon US. So first, for the Laravel framework, at Laracon US, we debuted a variety of new features. So concurrency, the defer function, cache flexible, and chaperone. So concurrency is, of course, a way to run code simultaneously in your Laravel app via the new concurrency facade. Defer lets you defer code to after the response has already been sent to the user, so you can keep your application feeling nice and snappy while you do some work in the background without having to configure a separate queue driver. Cache flexible is a stale-while-revalidate implementation for the cache system in Laravel, which lets you basically return cached results while refreshing the cached value in the background after the response has been sent to the browser. And then the Eloquent Chaperone feature is basically a way to avoid N+1 query problems when nesting down into relationships in Eloquent. And all of these features have been shipped into the framework. You can use them today. So those are all available via a simple Composer update. Inertia 2.0. Any Inertia fans in the house?
Woo!
Nice. I think we were overdue an update for Inertia, if I'm being honest. Inertia is, for those of you who haven't used it, it's really the best way to pair a Laravel backend with a modern React or Vue frontend, or Svelte, I guess. And it lets you do that in a way that doesn't make you just want to pull your hair out with complexity. And we launched a variety of new features in Inertia 2 as well, so things like deferred properties, polling, infinite scrolling, prefetch, What else? Async requests. And we actually have our second beta release of Inertia 2 out there in the wild, so you can go to v2.inertiajs.com and see all of the docs and read all about all of the new goodness in Inertia 2. And what's really awesome is you can upgrade your Inertia 1 apps to Inertia 2 with zero changes to your application, which is just super awesome to be able to take advantage of all of this cool new stuff without a big rewrite of your app.
Yeah.
What else did we show at Laracon US? Oh, there's all the stuff from Inertia 2.0. So we showed VS Code, a new VS Code extension, first party built by us here at Laravel. When you first install VS Code, if you're doing Laravel development right now, you kind of have to cobble together a mix of extensions and customizations to give yourself a good experience. And with VS Code being the most popular free editor out there among developers today, I really wanted developers to be able to have a great Laravel experience with just a single official Laravel extension that you can install. So it gives you a lot of different stuff, which you can see down here at the bottom: autocompletion, test integration, clicking through to the source of things. So like even things like configuration values, being able to click on the config the call to the config function and jump straight into the configuration file where that value is defined. All kinds of info on hover, autocomplete on eloquent queries, lots of good stuff that you just get really easily. We are hoping to have a beta release of our VS Code extension out this month. It will, of course, be totally free and open source, so you'll be able to go out there and contribute yourself if you want. And I hope it really makes the onboarding experience for new Laravel developers much, much easier, which has been a big focus for me personally this year. And of course, we announced Laravel Cloud, which was the biggest project we've tackled thus far at Laravel. Laravel Cloud is a fully managed platform for shipping and scaling Laravel applications, and it's really the platform I feel like this community has deserved for a long time. The good news is our early access is opening soon. We're actually letting our first customers into Laravel Cloud next week. So, get your name on the waiting list if you haven't already, because we're going to continue to ramp up early access into Laravel Cloud, and it's really an amazing platform that allows you to scale and ship your Laravel applications really with ease. All right. So, that's a brief recap of what we talked about at Laracon US and sort of what we've been up to over the last few months. When I ended my talk at Laracon US, I said, okay, great. We have a good way to ship applications on Laravel Cloud, but what if something goes wrong with those applications, right? And it turns out we actually have a trend of talking about this problem at Laracon Australia. So in 2018 at Laracon AU, the very first inaugural Laracon AU, we introduced Laravel Telescope. Laravel Telescope is an open source package that you install into your Laravel app that during local development collects a bunch of data about what's happening, like incoming requests, queued jobs, commands, and all of the data associated with them, the request payloads, everything. And it exposes all of that to you in a dashboard at like /telescope of your Laravel app. And it's really great for local development, but it's really not intended for production use. It was never built to be used in production. It was only built to be a local development assistant to let you inspect the requests coming into your app locally. Just last year at the previous Laracon Australia, we introduced Laravel Pulse, another open source package that actually was intended for production use. And what Laravel Pulse does, it's similar to Telescope in the sense that you install it via a Composer package and it gathers up a bunch of data about your application, like the users that are hitting your application the most or the queued jobs that are being queued the most. or your slowest endpoints, your slowest queries, and it gives you a single sort of convenient dashboard to get a quick overview of the health of your application at a glance. So it's a very high-level overview. And, you know, since we've launched Pulse and as we've been building Laravel Cloud, I really wanted just like a little bit more. Pulse gave us a good start, but I went to the team and said, I need like— I want to be able to like double-click on every piece of data in Pulse and just go like a level deeper or even triple-click click, go 3 levels deeper, and really dig into, like, the depths of what's happening in my application. And so for the better part of this year, that's what we've been working on. We've been building not just Laravel Cloud, but a second product. And it's honestly Laravel Cloud and this product are by far the most ambitious problems we've ever tried to tackle at Laravel. And the team has done a fantastic job. And today at Laracon Australia, I'm super excited to introduce you to our latest product, Laravel Nightwatch. Nightwatch is a hosted, fully managed application observability platform for Laravel. It's obsessively optimized for Laravel applications. It's not like other monitoring tools that are built to be sort of like generic monitoring tools where you can configure them for any sort of like application you're running through hours of configuration and pain and tears. Nightwatch is configured to work right out of the box perfectly with Laravel. And to really appreciate it, I think you just need to see it. So to give you that demo, it's my honor to welcome Nightwatch team lead Jess Archer to the stage.
All right. So I'm going to start by logging in. And straight away, we're presented with a list of applications that are set up for monitoring here. So we can monitor multiple applications, and each application can have multiple environments. So for today, we're going to use this Skywatch demo app. It's a flight booking app, and we're going to jump into the production environment. So who's ready to see the dashboard?
Yeah.
All right. So— This is the dashboard where we want to show you an overview of the most important things going on in your application. And for a Laravel application, that's typically going to be web requests. So up the top here, we've got a graph that's showing you the traffic coming into your application. Both the successful requests, but highlighted are the 400 and 500 errors because we want to draw attention to those. We can see there's been a bit of a spike over here. I don't know, the orange and red doesn't show up super good on the projector, but it's still pretty good there. We can also see then over on the right here, we've got more of a performance chart. So we can see up here the minimum and maximum duration of requests. And then we can see the average and the P95. And then we've also got the average and the P95 plotted over time. We can hover over any of these to get a breakdown of the specific counts. For those of you not familiar with P95, it's basically the 95th percentile, or in other words, 95% of requests are faster than this number. It's kind of similar to looking at the slowest duration or the max duration, but it excludes the top 5% of those outliers that aren't really representative of what's going on. So P95 is quite commonly used in the observability space. Below that, we have some information about your application. So we can see the number of exceptions that were reported in the time window we're looking at. And we can see that in this case, errors have impacted 15 users. And then we can see the breakdown of that over time. At the moment, we're looking at a 7-day window. So we can kind of see that there's these kind of activity during the day. Next up, we've got a list of your slowest routes. So routes that are slower than 1,000 milliseconds on the P95 score. And then we've got some charts that show you information about your job attempts. So the number of processed jobs which were successful, the number of released which were retried, and then the number of failed jobs. And then below that, we've got some performance stats about your job attempts as well with the same average and P95 along with the total range of those. Continuing down, we've got information about the servers that are hosting your application if you're using a serverful setup. And so we can see the CPU and memory usage over time and also the disk usage, which is often very important. And straight away we can see here that web01 has got one of its disks is nearly full, and our web01 server has completely stopped responding. Continuing down, we have some information about the users of your system. So we've got the number of users impacted by exceptions in the last 7 days, and we can see the top users that were impacted. We've got the most active users in the last 7 days. And then we've got these graphs that break down the number of concurrent users at any given point in time. And then the breakdown of authenticated versus guest requests. So this particular application is almost all authenticated other than, like, the index page. So in this case, they're mostly green here. So at any point, we can switch between different time periods. So we can go anywhere from looking at the last hour, all the way up to 30 days. And then we can also enter a custom date and time range if we need to drill into something very specific. We can also switch between different environments at any time we want, and we can also change entire applications that we're monitoring as well. All right, so let's now jump over to the next section, which is Activity, and we're gonna jump into Requests. So this is a dedicated page all about the requests in your application. I'm gonna go back to the 7-day view 'cause I like where the graph looks better. So we've got the same graphs we saw on the dashboard where we can see our request traffic over time with the errors, the 400 and 500 errors, and then our performance stats. And then below that, we have a breakdown by route. So when we look in the graph, we can kind of see some red spots, some orange spots. We can kind of, like, look at the route list and see which routes are contributing to those spots in the graph. So we've got the number of requests. We can hover over any of these and get a breakdown, but we see the number of requests each route has got, the number of 400 and 500 errors, and the total number. We also have the average duration and the P95 duration. And as you can see, when we hover over these, we can also see the minimum and the maximum there as well, just in case you need to know those too. So, Once we've— oh, the other thing I want to show you actually is that at any point we can also filter this entire screen by user or by server that's serving the application. So I can come in here and I could type in taylor@laravel.com. And now we're just seeing the information for just the requests that Taylor has made. So this can be really helpful if you're trying to diagnose a problem reported by a specific user. If I come over and change this, I think I've got quite a lot of errors.
Yep.
So we've got some errors for me there. All right. Let's clear this one out. So once we've identified through the graphs and through the route list that there's a bit of a problem going on, whether it's an error or a performance issue, we've now kind of seen which routes might be contributing to those. And so we want to drill in a little bit further and find out exactly what has caused this. So we have a few options here. We can open up this little side panel. And this gives us an overview without leaving the context of the route list. So we can kind of flick through a few. And here we're now seeing the same graphs, but now scoped down to just this route. So we can see this route doesn't have any 400 errors. It's a GET request, so it probably doesn't typically have any of those. But it does have a lot of errors. And then the performance on this one is kind of— kind of spikes up and down. So we'll try and figure out what's going on there. We've then got some information about the route itself, such as the route name and the route action. And then we've got a list of the most recent requests. So we could click on View to get to our expanded view, or we can also just click on the row here. So now we've drilled in to find information about just this route. So it's the same information from the sidebar in an expanded view. And if we scroll down, we can see a list of every individual request that has come in. So if we're trying to diagnose an error, we might want to filter by status code. So we might wanna choose all of the 500 status codes. If we're trying to diagnose a performance problem, we might wanna look for things that are above average or even things that are above the P95. So I wanna start by trying to find out this performance problem that seems a little bit sporadic. So we're gonna go into an example of one of the requests that was slow. Because once we have identified there's a problem, we wanna see a record that represents the problem. so that we can see the specifics of what happened. So let's dive into this specific request here. And now we're on a page all about just this request. So we're no longer looking at aggregated data here. We're looking at specific data about this request. So we've got the status code, the duration, the request size, response size, the peak memory, the server that this request was processed on, and also the deployment that it belonged to. If the user was authenticated at the time, we have information about the user that made the request. And then on the right here, we have a breakdown of things that happened inside the request. So we can see a count of how many queries were run and then the sum total duration of those queries. So straight away we can see in this particular case that the query duration is making up the bulk of the request duration. So that's probably where our problem is going to be. We also have outgoing requests, the number of queued jobs, storage reads and writes, cache hits misses, and writes, the number of hydrated models, and also the number of mail and notifications that were sent. So anytime we have any records up here, we have a little view button here where we can click on this, and now we can see the individual queries that ran inside this request. So sometimes you might have hundreds of queries that aren't super slow on their own, but they add up, and that might make that duration go big. But in this case, it's one query that is contributing the bulk of the problem here. We can see where this query originated and potentially try and go and fix that. There is another way we can look at this data, though. If we scroll down a little bit further, we have a full timeline showing you everything that happened inside the request broken up into lifecycle stages. So we've got the bootstrap stage here. We can see in this case was 7.5 milliseconds. We've then got the before middleware stage. And in this case, there was a database query that ran inside. That's probably our authentication query. We've then got the request action. So in this case, it's a controller. And then we can see everything that happened inside. We've then got the render phase, the middleware phase, and the terminating phase. And we can zoom in and out on this using pinch zoom and command scrolling and all those good things. And if we're fully zoomed out, we can click on our arrows to jump over to see various bits and pieces. So we can see that this query is causing the problem. We've seen it elsewhere. Click on this and we can see some more information about this query. The same sort of stuff we saw in that sidebar. So we can see the full SQL query, the duration, connection, and so on. Now the other thing interesting here though is we can see that there was a cache miss beforehand where the key was popular destinations. And then there's a cache write that happens immediately afterwards. So it seems like we already knew that this query was problematic. And maybe we've already tried to optimize it and we've just wrapped it in a cache to solve it. But the TTL, or timeout, we can see here that we've set is 10 minutes. So once every 10 minutes, this cache gets stale, and the next user that hits it unfortunately has to run this slow query. So in this particular example, you may want to increase the cache timeout. You might want to use Laravel's new cache flexible method to do stale-while-revalidate caching. Or you might want to run a queued job that keeps the cache warm so that no user ever hits the stale or the missed cache. Now, to confirm that this is what was causing this, I want to go back now and have a look at one of the fast versions of this request. So I'm just going to go view all, and let's jump into this first one here. So this one only took 31 milliseconds. If we scroll down to the timeline, we can see this one had a cache hit, and then there was no query afterwards. So I think we've kind of solved what was happening with this one. All right, I want to come back up to the request page and look at some different ways of trying to find problems. So in this graph, we can see that there was a bit of a spike of errors here, and the P95 went up to about 5 seconds for a little bit as well. It seems to have resolved itself, but maybe we want to do a post-incident report and try and figure out what happened. So we can actually select on this chart, and it will zoom us into this time window. So we can see our time filter at the top here that was set to 7 days is now looking at a very specific time period. Now we can look at our route list, which has also been filtered by time, and we can see that this GET request to this flights endpoint is making up the bulk of those errors. So if we click onto this one, this filter follows us through. So we're still looking at this scoped-down time period of where this problem happened. And I could continue to zoom in a little bit further, and we should only see error requests down here without even having to filter. So of course, once we have identified an error where we want to see a representation or see exactly what happened. So we can click on any of these requests. And in this case, there was an unhandled exception. And anytime there is an unhandled exception, we're going to promote it to the top of the screen because it's probably the thing that you want to see first when you're looking at a request that has had an unhandled exception. So we can see details about the exception. We have the full stack trace. So you can go in and try and trace where this happened. And if we scroll down to our timeline, we can also see down here there was an outgoing request. This one got a 504 error, and then that threw the exception. And in this case, yeah, it seems like our third-party provider here, if we go to our outgoing request, this FlightWatch API seems to have had some sort of a problem around then where the requests were timing out after about 5 seconds. All right, coming back up to the request page, I'm just gonna go back to our 7-day view. And I want to show you one more example to just kind of see everything that you can see about a request. So I'm going to use this POST request to this flights endpoint to demonstrate this one. So we're going to dive in here. And once again, we're now seeing a breakdown of information about only this route. And then we can see its individual requests. One cool thing here, by the way, is we've got this date column here that shows the date of the request. But if we hover over it, We can also see the time in the UTC and in our browser's local time. And at any point, we can toggle this, and it will change everywhere in the UI to show either in UTC or in your browser's time. So I'm going to go into one of the successful requests here, because I know it has some interesting stuff to show you. And if we scroll down to our timeline— actually, up here first— we can see that there were a few jobs that were queued in here. So we've got a process flight job, and then we've got this mail flight offer that we queued. queued as well. So we can see these in the timeline. We can see there was a job dispatch here. Kind of within this was the query that inserted it into the jobs table. We had a notification that was sent directly inside the request that was a bit slow. We then dispatched another job over here. But if we continue scrolling down, just close this one up here, we can see all of the jobs that were dispatched from this request represented in the same timeline, relative to the request where they happened. And so we can zoom out a little bit here. And so we can see our job dispatched here. The job started, the first attempt started before the request had finished in this case. But we can see all of the attempts here, and in this case, this one didn't look like it went too well. So we've had 3 attempts on this process flight job, and they've all had a failure that, after each retry, failed in the end. We also have our flight offer that was successful down at the bottom here. So we've really tried to highlight when there are problems as well. You'll notice that we don't use a lot of green to represent success in too many places because we want to draw attention to the things you need to see, which in this case are errors and warnings. So speaking of jobs, let's now move over to our dedicated jobs page. So this is where we can see jobs kind of in isolation. We already saw jobs in the context of requests, But it's often useful to look at jobs on their own. So, of course, we have a graph at the top here with our breakdown of processed, released, and failed jobs over time and their performance. And then we have the breakdown of each of the jobs in our system that are grouped by the job class or the job name. So, for every job, if we hover over these, we can see that this particular job was queued this many times, processed, released, and failed. We have some other jobs here, this process refund and this flight reminder. These ones were queued but have never been processed or released. So maybe these went onto a queue where there's no queue worker running, so no one's getting any refunds or flight reminders. But in this case, I want to jump into this process flight one, which we've seen through the request as well. So now we've drilled into looking at just this specific job class, this process flight class. And we can see this one has a lot of errors, a lot of retries, a lot of failures. we can see now each individual attempt of this job and the attempt number that it belongs to. We can kind of see attempt 1, attempt 2, attempt 3 fails. Occasionally it succeeds. So we can jump into any of these. So let's jump into the one that failed. Because there was an unhandled exception, gets promoted to the top of the page. So in this case, it looks like our third-party API was returning a 500. And if we look up the top here, we can also switch between other attempts of the same job. So if we want to see whether it was the same error that happened on the previous attempts, then we can. And in this case, it was the same error each time. And if we scroll down, we're on the jobs page here. So we see each of the job attempts for this job, but we also can still see the request where this job originated. So these all kind of share the same trace ID. And so we can expand this and see the request where this job originated from, and also any other jobs that came from that request that are kind of all coupled together. So we're really letting you see the entire lifecycle, all, like, from the beginning of the request to the end of all of its side effects. Everything is visible for you. So, so far we've talked about these kind of high-level concepts, requests, jobs, also commands and scheduled tasks that are generally not slow by themselves. They're slow because something happens inside them that makes them slow. But generally, we want to look at things like requests because that's what the user experiences. They experience a slow request. They don't necessarily experience a slow query directly. But sometimes it is handy to drill that extra step into these kind of lower-level concepts. So I'm gonna jump into queries now. And so now we can see a breakdown of all of the unique queries happening in our application. We can see the frequency of queries in general over time and their performance. And for every query here, so these are all the unique queries, we can see the number of times each query was called. We can see the average and the P95 duration of these queries, but we can also see the total duration of this query of all of its attempts in the time window. So there's some interesting things we can see here that we wouldn't necessarily notice if we look through the lens of requests. So I'm gonna filter by total, and let's go up to 30 days to really exaggerate things. So the first query here that has spent the most time in the database, this is our slow query that we saw at the beginning that we were trying to cache to solve it. So we kind of already know about this one. It doesn't get called that often, but because it is so slow, it makes up the majority of time spent in the database. This next query here, though, this one runs quite a lot, and the query itself is not, like, super slow, but we can see that because it runs so often, it still makes up one of the— to be one of the main queries that spends time in our database. So if we were able to even halve the duration of this query or if we could use caching to prevent it running so often, then we could significantly reduce the amount of load on the database in the time window. Next up, I want to sort by the number of calls. So this is the number of times this query has run. And so at the top of our list, we can see it's insert into jobs. This query is not particularly slow. It doesn't spend too much time in the database. We're obviously queuing a lot of jobs in this application, so this one's fine. We've then got our SELECT* FROM users WHERE ID equals. This is probably our auth query. This one runs quite a lot as we would expect. And again, it's probably fine. This one takes a little bit longer. There's an interesting thing with the auth query. It's typically the first query that runs on a request. And so often it's the query that has to connect to the database. So it sometimes seems slower than other queries, even if that query is not as slow when you run it manually yourself. This next query here though is a little bit more interesting to me. So as a developer of Skywatch, I kind of know this query here. Select star from tickets where user ID equals this. We're getting the latest 5 tickets for a user. And this query is running quite a lot. So 37,000 times. It's a fast query, but it's running more than I would expect. So I want to find out more about this query. So we can click on the side panel view, of course, to get a breakdown of information about this query. We can see that it's consistently, pretty fast. We can also see all of the individual calls to this query. And if we were to click on it as well, then we get the full-screen version of this where we can see all of the SQL and all of its stats. So if I come down to the places where it was called, we can see every single time this query has run, the duration, but we can filter by the above average and above P95. But we can also see the source where this request, or this query, sorry, came from. So I'm gonna click on one of these, and this is gonna take us to the request where we ran this query. So this is on this GET users route. We can see there's 27 queries in here. If we hit on view, we've got the same query running quite a lot. So you might be knowing where I'm going with this, but if we scroll down to our timeline, we can see we've got an N+1 error. And so even though this query is by itself pretty fast, because it's in an N+1 scenario, it still makes up a little bit more time in this query, in this request. All right. Next up, I want to dive into mail. So here we can see a breakdown of all the individual mailable classes that this application is sending and the number of sent versus failed. And then we can also see their performance. So we can see we've got a flight offer here. This one seems to send fine. It's never had any errors. But this flight tickets mailable seems to have some problems. And I think people not getting their flight tickets is probably a pretty big problem that we want to find out. So once again, we have our sidebar view where we can see the breakdown of just this mailable and all of the places it ran. So we can see the subjects of the mail, how many recipients, how many attachments, and so on. And on any of these, we can click in to view where this So if we want to go to one of the errors, this brings us to the job where this mail was sent. And in this case, there was an unhandled exception. We can see that our message exceeded the maximum size. So if we continue to scroll down, we can see all of the attempts of this job where this mail was sent. And each time we had our mail failed. So this one here, Sorry, yep. So we have the mail that was failed, and then we have the exception that was thrown afterwards, where we can see our exception message. I think I'm zoomed in a bit funny here. We've then got all of the other attempts. In this case, the second attempt actually had an error on the outgoing request, so this one's got a few different problems going on. But then, yeah, so we can head back to mail and see our overview of all of the mail. We've also got notifications. Now, notifications is pretty similar to mail, so I'm gonna skip past that one and jump into outgoing requests. So on this page, we can see all of the outgoing requests made by our application using Laravel's HTTP client. Now, on this page, they're grouped by the domain that we're sending to. And so we can see our FlightWatch domain here. This is the one that kind of caused this spike of errors earlier. We'll go back to that 7-day view. So we can see that same spike there that we saw in the request chart because that particular scenario was coming from an outgoing request. And so for any given domain, We can click on the domain and now see a breakdown of the requests made to just this domain. And we can see the individual requests that we made as well. And as with all of these lower-level concepts, we can always jump to the source of wherever this came from. So in this case, these ones came from requests. We can click on the request. And if we scroll down to the timeline, we're highlighted at where exactly that outgoing request happened in the rest of the context. All right, next up I want to dive into the next section, which is exceptions. So we've already seen exceptions kind of in our request pages and jobs pages, but sometimes it's useful to look at exceptions in isolation. So you might have a route that's returning 500 errors, and in the request screen you'll see that they're 500 status codes, but it could actually be multiple different exceptions causing them. It's not necessarily the same exception. Having a breakdown of all of the exceptions happening is often a good way of trying to solve some of those problems. But there's another example I want to show you here, which is we can filter to show only handled exceptions. So these are exceptions that you probably wouldn't see, obviously, through the requests or jobs pages because we've handled them to return gracefully with, like, a 200 status code. So these are exceptions we've caught. And we've still thought they were important enough to report, and so those will also show up in here. So for this particular example, I want to look at this 409. And we're now looking at a page just about this exception. So we can see the last time this exception was seen and the deployment that was active at the time, and also the first time that this exception was seen. So we can kind of try and figure out maybe it was caused by a particular deploy. We've got the number of events over the last 30 days, 7 days, and 24 hours, the number of users that were impacted by this specific exception, and the servers where this exception has occurred. We've then got our stack trace that we saw before, which we can expand to see all of the details. And in this case, we can see this flight has been overbooked is our exception message. So if we scroll down, we can now see all of the occurrences of this exception. And each occurrence could have slightly different error messages depending on the type of exception. So we can see all of the messages for every time this has occurred and when it has occurred. We can also see the user that was impacted by it. And we can also then jump to the request or the command or the job where this exception came from. So in this case, we can click on this request. And we don't see the exception at the top here because this was a successful 200 request. But we do still have the handled exceptions down here. So we see one exception, and we might often think that there could only be one exception in a request, but depending on how you build your application flow, you could have multiple handled exceptions and then that one unhandled exception at the end. So we can view our exceptions in here, see the message, and then we can jump to the full details page for this exception as well. And then of course we can see the exception in context with the rest of the request. So in this case, we had our outgoing request to FlightWatch, And then this time we got an error message that the flight has been overbooked. All right. Next up, I want to go to logging. So Nightwatch provides a logging driver where you can send all of your logs to Nightwatch. And this can be really helpful to have all of your logs in the same place as your performance metrics and all of your errors, so everything can be tied together. So we can scroll upwards. So we've got reverse infinite scroll, so you can scroll through time and see all of the history of your logs. You could, of course, filter by time if you were looking for a specific window. We can filter by a user and find just logs that belong to a specific user when they were logged in. We can also search our logs. So, I know I've got a log here that's to do with reminders. And on any of these that have context, we can expand this and see the context that was provided when we logged this job. Sorry, where we logged this window. Entry. I'm going to clear this one, and then we can also filter by level. So here we've got all of our log levels, so we could choose multiple to filter by. In this case, I want to filter by just the emergency logs. And so now we see just those that we've logged with the emergency designation. Of course, we can see any contacts that occurred here, but we can also see the source of this log. So in this case, this came from a request. So we can click on this to go to the exact request where this log came from. And if we scroll down, if there are any logs, they're all represented here. So we can see there were actually some other logs here from this same request. So we can see we were deleting a flight from the database. We were updating FlightWatch. And then we logged an error that the flight was already deleted. So in this particular case, we obviously handled this exception because we didn't throw a 500. But we decided to log this emergency message here. So you can kind of see that everything is kind of connected between different pages. So you can look at things through the lens of requests, but you can still get through to— you can see logs and exceptions and get to all those other pages. If you start at another place, such as looking at slow queries, you can still get through to the requests where they happened, and if there were any logs there. Everything all kind of ties together and is all linked. All right, next up, I want to have a look at our users page. So here's where we can see information about the users of our applications. We have the graphs where we can see the number of concurrent users over time and the breakdown of authenticated and unauthenticated requests. And then we've got information about the individual users. So if we have a user that's reporting a problem, we might want to come in here and to try and find out exactly what's been happening for them. So we can sort this. We can see if there's a particular user that is responsible for queuing a lot of jobs. We can see if there's a user that's experiencing a lot of exceptions, and so on. So in this case, I'm going to jump in to have a look at Tim's profile and see what he's been doing. So now we're looking at a page that is just about Tim's experience with the application. So we can see a breakdown of the requests he's been making. We can see that on the weekends, he still is a little bit active. Goes to sleep at nighttime, and then is more active during the week. He was impacted by a large amount of errors here, which I think we've kind of already solved earlier. And we can see extra information such as the time he was last seen. And we've also got these quick filters. So you can jump to any of the pages we've seen, such as requests, pre-filtered to just Tim's requests. We've then got a list of the top routes that Tim hits. And the slowest routes he's been experiencing, and the top queue jobs that have been triggered by him. Obviously, he doesn't trigger them directly, but through requests he's made. Then we've got a list of all of the individual requests he's made. So this isn't grouped by route. This is the individual requests. So we can follow his path through the system. And if he was having a particular problem, we can kind of see where he was before that, and then where he was after that. And of course, we can dive into any of these to see the breakdown of what happened inside this request. All right. Next up is our deployments page. So, this is still a bit of a work in progress. We've got a lot of exciting stuff planned for this. You'll be able to tell Nightwatch when you do a deployment. And if you're using Cloud or Vapor or Forge, we're going to have some really good integrations for those. But telling Nightwatch about your deploys, allows it to give you more context on, uh, the— like if a particular request or an exception belongs to a particular deploy. Uh, we can see also if there was any errors with deploys. I don't know if I have any good examples in here. Uh, no, but we also have, uh, plans to show deploys on our graphs as well. So if we were on our requests page or even on our dashboard here, we'll be able to see our requests that are— sorry, our deployments, so that we can kind of see if there was maybe a deployment that happened around the time that a problem occurred. All right. Next up, we have alerts. So we don't always necessarily want to have to keep the dashboard open. Sometimes it's nice to just be notified when something goes wrong. So we can configure alerts. I've got a few set up here by default. So we've got some slow requests where the route is not So we can configure different scenarios when we want to be alerted and then different conditions. So in this case, if the P95 is more than a second over 5 minutes, or the peak memory goes above 500 megabytes for more than 5 minutes. So we do these over time so that if you've got a spike in CPU usage, it doesn't just start sending you errors. It's— you can set them so that it's— if it's a sustained problem, Only then will it notify you. So we can come up here and add an alert. I'm going to create one for slow checkout, which is that POST routes, that POST to the flights route that we, we were ignoring on the other alert. And so we can define the events that we want to be alerted for. So for each type of event, there's different kind of things you can monitor. So for a duration, for a request, it's the duration and the peak memory. If we chose server, we've got CPU usage, memory usage, and disk usage. So in this case, I want to do one for requests. We can set one up for all requests, or we can choose a specific route. So I'm going to go and set one up for that POST to the flights route. And for this one, I want this to be a little bit more responsive than our kind of our other slow requests one, because this is our checkout page. So I'm going to say if the average goes above 300 milliseconds for more than 5 minutes. And in this case, I wanna be notified by email. So at the moment, we've got Slack and email, but we have plans to add a lot more notification channels, even things like webhooks, so that you can be notified wherever you need to be notified. So I'll just set this one up to notify me and create that alert. And then we've got our alert at the top here. All right, so what's next? Oh, looks like that's all I've got time for today. So I'm going to hand back over to Taylor now.
That's Laravel Nightwatch. I hope you're as impressed by it as I hope you are. We have really put a lot of care, a lot of thought into this application. I'm super proud of the Nightwatch team. I think it looks Amazing. It's honestly probably the best-looking monitoring application I've ever seen in my life. So I hope you feel the same way. Nightwatch just works. That was our goal when building this platform. We want you to take any Laravel app, composer install a Nightwatch agent, and ship it out, and we immediately give you amazing insights into your Laravel application. And of course, Laravel Nightwatch will be Laravel Cloud aware, so we'll be able to pull in your cloud projects for easy setup and configuration on Nightwatch. But you don't have to be using cloud to use Nightwatch. You can be using Forge, or you could even be using your own custom infrastructure. You can still use Laravel Nightwatch wherever you run your Laravel applications. All right. So let's talk about when you can get into this thing. You can get on the waitlist today, but we plan to start early access later this year with a beta in the first quarter of 2025. So roughly the same timing as Laravel Cloud, so you can get into both at roughly the same time and have kind of the ultimate Laravel deployment and observability setup. Pricing. How much will this thing cost? We're still working on that, but here's what I can tell you. In the same— it will have the same philosophy as Laravel Cloud. We want to put Laravel Nightwatch in the hand of basically every Laravel developer on the planet. So the pricing will be simple and understandable, and it will range to an accessible price point for solo devs and indie hackers all the way up to enterprises that are using Laravel to generate billions of dollars in revenue a year. And of course, we'll have quota protection so you don't get unexpected bills if you have runaway errors or logs where you're logging out gigabytes of data. Of course, we don't want you to be surprised by bills that you didn't plan on. So we'll have quota protection so that you feel comfortable shipping your apps onto Nightwatch. And this is just what Nightwatch looks like today, right? And I think that's actually pretty incredible. This looks like an application that's been polished for years, I feel like. And I'm excited to— see what we can do with this in the future. I think we have a lot of good ideas, a lot of big ideas for Nightwatch. When we have this much intelligence about what your application is doing, there's so much we can surface to you in terms of insights and fixes that you could make your application even faster with. And I hope you can tell that Nightwatch and Cloud, we're not just shipping MVPs out there to you. We are putting, honestly, blood, sweat, and tears into every interface, every button, every interaction with these applications, and I hope it shows, and I hope you truly enjoy using them. So nightwatch.laravel.com, cloud.laravel.com, you can get on the waitlist for both. I hope you truly love these products. We've loved building them, and I hope you build amazing things that your users love and that your developers love to use these tools. Thanks, everyone. Chat later.
More from Taylor

Everything New with Laravel and Cloud | Taylor Otwell Keynote at Laracon US 2026


In conversation with Taylor Otwell: The India Comeback - Hosted by Vishal Rajpurohit

Introducing Laravel VPS & Major Updates to Forge | Laracon Keynote 2025 (Taylor Otwell & Team)


Laravel Cloud, Inertia 2.0, VS Code Extension, & OSS Updates | Taylor Otwell Keynote | Laracon US


Taylor Otwell "Laravel Herd, Laravel 11, Laravel Folio, Laravel Volt" - Laracon US 2023 Nashville