Bitcoin Yearly Close: Most Will Miss This Signal
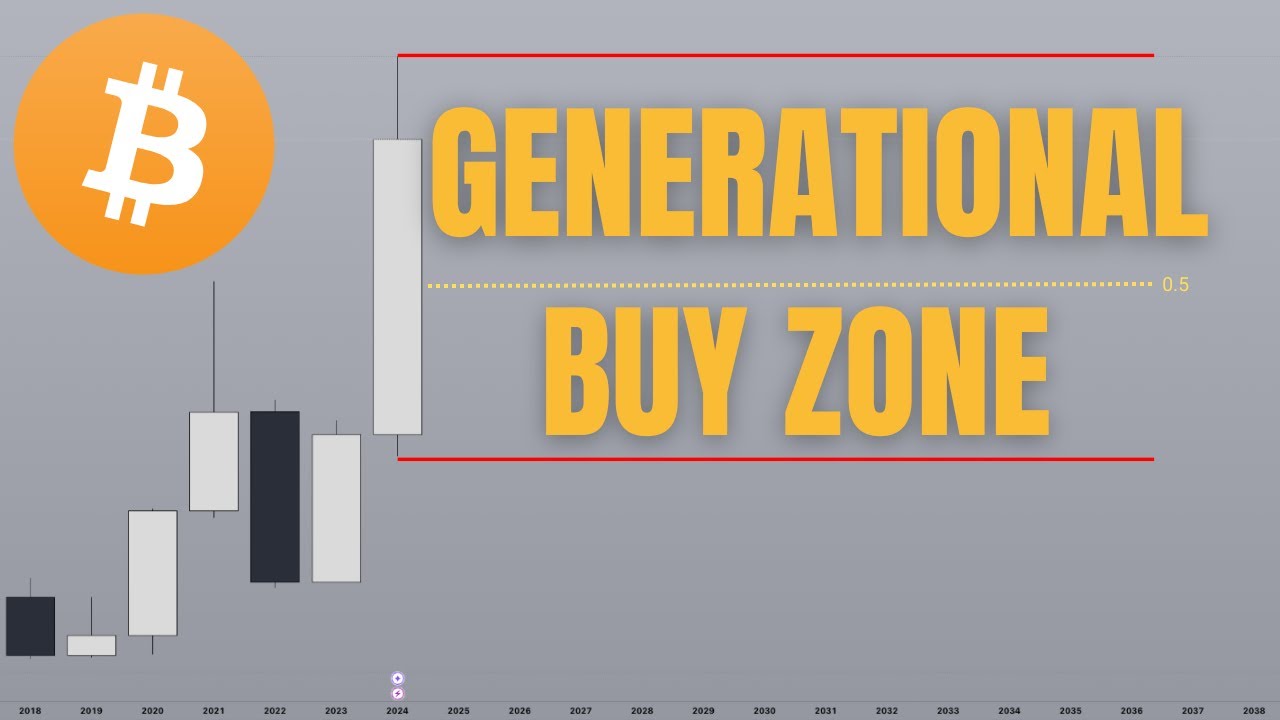
In this video, The Art of Crypto analyzes Bitcoin’s recent price action and argues that the current dip does not signal the end of the bull market. The host explains that Bitcoin is trading below its value‑area high, with multiple sell‑side liquidity points (previous swing lows) positioned just beneath current price. These liquidity points act as traps for retail traders, allowing institutional players to sweep stop‑losses and create aggressive bottom‑forming moves. The analysis covers the concepts of value‑area, sell‑side liquidity sweeps, fair‑value gaps, and Fibonacci golden‑pocket zones, highlighting specific price levels ($92k value‑area low, $89k high‑probability buy zone, $67k structural break, $115k upside target, $80k black‑swan risk). The host then examines Bitcoin’s yearly chart, describing candle‑range theory, the diminishing size of historical retracements versus pumps, and why the yearly structure remains intact unless Bitcoin falls below $67k. The narrative stresses that the current retracement is a buying opportunity for long‑term holders, urging viewers to adopt “minority actions” (buying fear) and maintain patience. The video concludes with a promotion for a free masterclass that will cover 2024 narratives, 2025 coin picks, and strategy development, offering a research report to the first 500 registrants.
Chapters
What's up guys, welcome back to another video. So with Bitcoin going down over the last couple of weeks and altcoins reacting by dropping like 50 to 80% across the board, a lot of people are understandably concerned about the market. Is the bull market over? Was this the top? Because so far it's looking like some kind of range deviation. This is the top and we're about to go down from now. This is kind of similar to what happened back in 2021. with Bitcoin forming a very similar setup, which is some kind of range deviation before price ultimately breaks down, fails to make a higher high, and goes down. Same thing here, you have a range here, ultimately you get the deviation and you break lower. So is this the case as well for this time around? And my argument is that no, we are not at the end of the bull market yet. I'm going to look at the yearly close for Bitcoin soon, and I'm going to give you guys the exact update on why I think that things are not over. The fact that you have multiple liquidity points right underneath current price right now means that this is a really good sign for Bitcoin. So currently, taking a look at the value area, which is where most of the volume is concentrated at, we can look here. Bitcoin has currently failed to hold above the value area, right? Ideally, you don't want to see Bitcoin break into the value area because if it does, it's going to treat the value area high as resistance and oscillate to the value area low. Now, this means that in the short term, at least in the next week or so that Bitcoin is going to continue going lower, at least until you hit the value area low, which is currently sitting at $92,000. Now the beautiful thing about this though, and why I'm going to say that there is a silver lining in disguise here, is the fact that you have 2 sell-side liquidity points, and arguably 3 if you go down to the lower time frames. So what is a sell-side liquidity? Essentially it's previous swing lows that have not yet been taken. This is present on the daily chart. I've marked these out with a dollar sign because they are liquidity points. The reason why I call them as liquidity points is because anyone that has went long And at any point during this 2-month period will very likely set their stop loss underneath one of these swing lows. Basically, these people are all in profit at the moment, or very close to break even. This is especially true for the people who got in here. Now, this is a very important lesson on market psychology and how the markets like to move. The major moves in these markets— it doesn't just apply to crypto, by the way, also applies to the traditional markets— major moves are always done by the smart money. They're always done by the institutional traders. Because simply put, no matter how many of us tens of thousands of retail traders band together, we will not have enough capital to move the markets in any sort of meaningful way. This is not just Bitcoin. Obviously, as Bitcoin moves, there is the rest of the crypto market that moves as well. This is a multi-trillion dollar market. Retail traders do not have multi-trillion dollars worth of capital to throw at the markets to move it substantially. Now, what I'm trying to get at here Is that for these institutional traders, it is in their best interest to cause as many people to lose money as possible. This is done through the use of liquidity sweeps. Ever notice how the market tends to take out previous swing highs and then just reverses in the other direction? They understand that a lot of retail traders trade using the breakout theory, which means that once previous quote unquote resistance is broken, they will go long in an attempt to trade you know a support resistance flip. And every trader that went long up here would've already been stopped out or are currently still trapped along this side. And this is really important to know because when these traders lose money, guess where that money's going to? That's right, they're going to the institutional traders. And on the flip side, when you do make money, you don't— like, trading is a zero-sum game, right? All of the financial markets are a zero-sum game. When you make money, you are not actually just printing it out of thin air. You're taking it from someone else. Guess who that someone else is most of the time? Yes, right, it's the market makers. So it's in their best interest to not allow the people that are in profit that haven't taken their profit to remain in profit and to ride the market to a new high. And so this is why you always see, well, retracements in the market. You always need to stop out any of the traders that did not take profit, such as this. That's a liquidity sweep again that leads to a massive pump. And These sell-side liquidity sweeps within a trend are amazing setups because they lead to some of the best bottoms ever. Now, one of my favorite setups to trade in a bull market, and I teach this in the AOC Alpha Group as well, is a counterparty liquidity sweep within a trend. Now, this is because, again, the largest, most aggressive moves tend to come from these sell-side liquidity sweeps. Currently, only do you have one level here, you have 2, 3, 4, and 5. That are sitting in very relatively close, you know, proximity to each other, which means a lot of traders, or rather a lot of retail people, are going to be looking at this like, oh, this is strong support. And you know what happens when a majority thinks that this is strong support? Yep, they tend to be wrong. The price is going to sweep underneath these levels. A lot of people are going to start shorting this, calling, you know, that this is the end of the bull run and the start of the bear market. But guess what? It's also going to end up just as this deviation over here. The thing that happens when you trade below the range lows is that yes, this is going to be the deviation, and this deviation is going to come after you sweep sell-side liquidity, clear out everyone who was long and in profit and set their stop loss at this level. And most importantly, you're going to trap a lot of traders who go short because, well, they're trading the breakdown. And boom, that's going to be all the fuel you need to bring the market to the next leg up. That's going to be $115,000 at the very minimum. So that's the state of the market at the moment. Big picture, like if we just even go like, heck, let's look at the daily chart for example. Structure is not yet broken. We do not even need to go to the weekly chart to see that structure is not broken. So they can look at, you know, just the macro. That's your low, that's a high, that's the next low, that's the next high. Guess where's the next low? Probably here. Which also means that unless you break below $67,000, or like, yeah, $67,000, you are nowhere close to breaking bull market structure. So yes, there is a lot of room for a retracement before you start breaking structure, but that's just the nature of a bull market. With big pumps, you're going to leave big gaps. These big gaps oftentimes leave behind opportunities for you to get into price. So if I had a price to give you to, you know, quote unquote call the bottom— not trying to call the bottom here, but if you wanted to have just a high probability area to buy into Bitcoin, then I'm gonna say it's going to be roughly $89,000. Why? Because not only is this a liquidity point that we marked out from before on the daily chart, but on the weekly chart, this is also a fair value gap. These fair value gaps represent areas of imbalance within the chart. I want you to picture this for a moment, and this is probably something that's happened to you as well, which is price goes very fast above or down. Maybe you have some sell limits, maybe you have some buy limits over here, but when price moves so quickly through these areas, your limit doesn't get filled and it remains open even after price has dipped below. The current price, but your limit is still there. That is what happens when there's a fair value gap. Market participants that have open orders that have yet to be filled because the market moves so quickly, they left behind inefficiencies. Now, more often than not, these inefficiencies tend to get filled, and when they do, they represent some of the highest probability value areas that you can possibly get into. Now, just to give you an example, this is a fair value gap that got filled. For the most part, price had The candle body above the fair value gap. Only the wick fills the fair value gap, and price booms shoots above. Now what we're doing here is we're looking at fair value gaps on the weekly chart. The moment I go into the daily chart, you're going to see this much more in action, and how like these represent some of the like highest probability setups that you can possibly have. Price pumps aggressively after sweeping the candle body liquidity here, leaving behind a fair value gap ends up being the bottom because the very next day you wick into the fair value gap and boom off you go. That is the bottom, and. That's not going to be the only example. It's moving forward here. Price moves aggressively, leaves behind 1, 2, and even 3 fair value gaps. Price ultimately fills the fair value gap, but in this case, price is actually filling a demand zone because that's your drop, that's your base, and that's your rally. So again, combination of fair value gaps and a demand zone, more like supply-demand, and boom, right? That will mark the top. And so currently, at least on the weekly chart, This will mark the first time in the last— let's count it here— 1, 2, 3, 4, 5, 6, 7, and potentially 8 weeks where we have not yet filled any sort of imbalance. And so the fact that this is lining up with a liquidity level, a fair value gap, means that this zone here is likely going to be quote unquote the bottom for this Bitcoin retracement. And I highly doubt that you're going to go very much below this box. If you do, this will be a black swan event because price is going to retrace all the way down to $80K. But guess what? Okay, here you have a true monthly open plus a daily fair value gap, right? This is a fair value gap as well, plus a Fibonacci 618 retracement. So where did I get this number from? Let's use this box to this box here. From this point here where the price— like, this is swing low, by the way. So assume that the pump began from here and ended here. This is going to be a range, and within this range, this area here lies within the 0.618 and the 0.705. For those of you who know anything about trading, this is known as the Fibonacci golden pocket, which also signifies a very high probability area where price tends to find a bottom at. So what I'm trying to say here is that even if you do go below this fair value gap, right, it's going— it's very likely going to just be a quick wick here with a V-shaped recovery and boom, off you go. It's very likely going to be the bottom. It's highly unlikely that you do return anywhere close to here because if you do, it's going to mark the start of a bear market. I hope that doesn't happen. Again, there's always a possibility. If there's one thing certain about the crypto markets or the financial markets in general is that nothing is ever certain, right? Right now, I hope you guys understand the game plan of Bitcoin and how until we break below $67,000, basically the structure for this bull run is still very much intact. Us going through a retracement right now to wipe out the funding rate, to wipe out all of the people that went long late, so then you— yes, you listening to this video— have an opportunity to get into the market at a cheap price Especially for those of you who have been complaining like, oh, you know, when am I going to get a retracement? The crypto market has just been pumping. Like, I don't have anywhere to get into. Well, guess what? You're about to get it now. In fact, you have it right now. And so don't be that guy again in 3 months' time when everything is up like 5 to 10x from this point onwards and be like, hey, when's the retracement gonna come? Like, bro, you had it 3 months ago. In fact, you have it right now. Don't let it slip through your hands. Not saying that you should pull the trigger, all right? Right now, but any buys that you make at around any of these areas are going to be 3 to 5 times or even 10 times higher come 3 to 6 months' time. Bull markets, they're not rocket science. The recipe to success is very simple. It's so simple that it tends to elude the minds of many. All you need to do is buy low and sell high. Most people struggle with this for 2 main reasons. One, fear is very high right now. A lot of people are really uncertain, but that presents an opportunity for you. Because when most of the people are uncertain, guess what's the right move to do? If you want to achieve minority results, you need to take minority actions. Buying fear is one of those examples of a minority action. The second main reason why people don't buy into these dips is because, well, they also feel uncertain, right? And that's normal to do. They are uncertain about what are the coins that they should buy. They're uncertain about the notion that they're going to need to hold this dip for potentially a couple of months and for price to potentially dip anywhere between 20 to 50% below their entry before it ultimately goes up by 5x. They're uncomfortable, all right, uncertain with the notion of having to hold through, like being down multiple thousand dollars, multiple tens of thousands of dollars. Yes, this is a hard thing to do, but guess what the majority never does? They never do the hard things. They always go the easy path. Speaking about uncertainty, I've got really good news for you. In about 2 weeks' time, I'm going to be holding a free masterclass giving you a head start We're going to look through the major narratives that shaped 2024. And don't worry, this is not going to be one of those quote unquote free webinars where I just spend half the time trying to sell you something. In this masterclass, I'm actually gonna be trying to deliver as much value as I can to you. The main things you're gonna get is my breakdown of the best coins that I think will perform the best in 2025. I'm gonna give you a strategy to approach, especially the first quarter of 2025, so that you can position yourself for as much gains as possible. And lastly, I'm gonna give you the guidelines for you to develop your own investment strategy so that you know exactly how much to allocate into certain types of coins to achieve the goals that you're trying to achieve. Whether that be a 10x or a conservative 3x, I'm gonna give you the recipe to do both. Now, the last time we held a free masterclass like this, it was so good that we actually went over capacity and had to upgrade our Zoom subscription live in the middle of the masterclass. So I would highly encourage you to sign up early because we will cap the spots at 500 people as to prevent another overcapacity situation again. If you're part of the first 500 people that sign up, I'm going to include my full research report breaking down the major narratives that shaped 2024 so that you can use history to shape your 2025 future strategy. Now there's a saying that history doesn't repeat, but it does often rhyme. Once you understand what happens in the past, you will be making much better decisions in the future. And if you want to sign up to that masterclass, it will be the first link in the description box below. But otherwise, let's look at one final thing, which is the Bitcoin yearly close. Now this is going to give you a lot of perspective and and context into the state of the bull market right now. I want you to take a look at one very important thing. For the entire history of Bitcoin, ever since 2011, I know Bitcoin got released in 2008, but we're looking at the Bitstamp chart, so we only have 2011. For the entirety of Bitcoin's history, you can see just how little the retracements are in comparison to the pumps. And I know that every subsequent bull market that we've had since 2012 has been diminishing in terms of percent, like absolute percentage gains, going from 8,000% To halving that and doing 3,000%, to going to just a quarter of that at about 800%. And currently actually not sitting too much above the bear market lows at only about 500-600%. But one thing to put into perspective is how little the retracement periods are in comparison to the pumps. Even if Bitcoin were to retrace halfway of the yearly range that it formed, which based off of the current bull market structure that we have in mind is very unlikely to happen, Oh, it could happen, but unlikely. We will still very much be maintaining candle range structure even on the yearly chart. Now, what is candle range theory? Well, candle range theory essentially means that every time you have a really strong candle close above or below, if you're bearish, you're going to look for price to retrace to the 50% line of that candle for you to find an area for you to short at. This is if you're bearish. Now, if you're bullish, the 50% line is going to present you with an area, very high probability area in this case because we're looking at the yearly chart, to go long for the next expansion upwards. Now here's the thing. This is how candles work. There's an open, there's a high, there's a low, and there's close. The candle opened here at the start of the year. It went to a high of here. Currently it's looking like it's going to close around here, and it went to a low of here. If you're bullish, want to wait for the yearly open to occur, and any price below the open is going to be where you want to buy because ultimately you know that the bias is towards the upside. And so what happens when you buy below the open is that you're going to be able to ride this entire expansion upwards. And guys, again, the recipe is simple. You just need to have a long enough time horizon to not lose sight of the big picture so that you can actually take advantage of this. Not a lot of people are gonna be talking about this. Guys, again, patience is gonna pay here. Like, there is absolutely no reason for you to be selling your coins here right now, down 50 to 80%. The time to do that would've been about a month ago when price was still going up. And so I hope that you take that as a lesson. For the next pump that we're going to get. But yeah, guys, like, even though the current conditions of the market seems bleak, that is in fact a blessing in disguise, because the more bleak it is, guess what? The bigger the pump that's going to come afterwards. After we had that 6-month consolidation, as you can see over here, price literally in one single monthly candle— all right, let's say 2— completely just negated the, the past 6 months worth of consolidation. And that's how the crypto markets work, right? You go from high volatility to low volatility. All it takes is one monthly candle And you're gonna highly regret selling your coins here. Bitcoin, if Bitcoin takes 2 monthly candles to, you know, break out of certain consolidations, altcoins do it in one. In fact, altcoins can do it in a week, just like what we saw in ENS. ENS went through a period of, let's say, what, 322 days worth of consolidation here, and in one single weekly candle completely blew past that consolidation. And like, yeah, This is why you don't give up on coins just because they're not doing much. As long as they fit a narrative, they're gonna eventually perform. This same goes to, well, crypto and Bitcoin in general. So guys, don't lose sight of the big picture. Make sure you join the masterclass because it will set you up for 2025. And guys, remember, join the masterclass if you haven't gotten the results that you know you should have gotten back in 2024. This masterclass is gonna set you up to get those results in 2025. Past people who have joined this masterclass, the people in the past that have joined my free masterclasses know just how valuable It is, so don't miss out on this. And remember, there's a little bonus waiting for you if you're one of the first 500 people to sign up. Otherwise, take care, happy new year, and I'll see you in 2025. Cheers!




