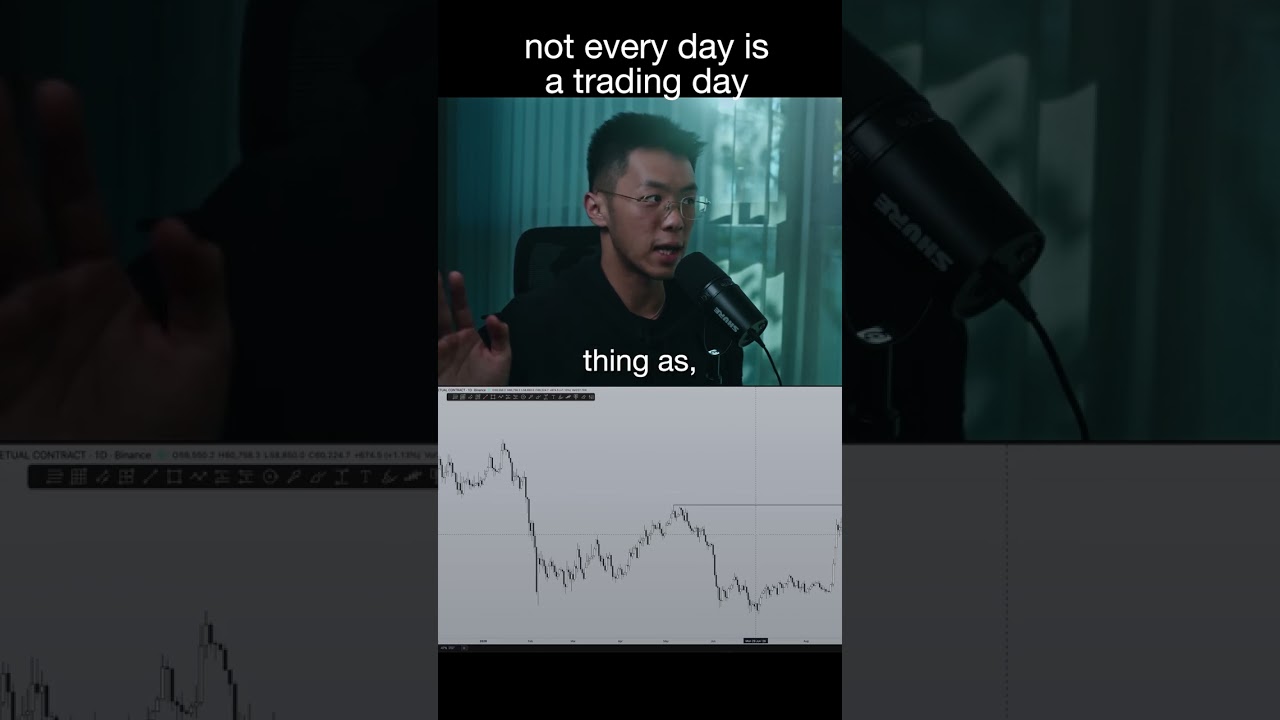
FOMC Today Will Create HUGE Opportunities For Crypto Today, Don't Miss This!

In this live stream recorded on November 2, 2022, The Art of Crypto provides a real‑time market outlook ahead of the Federal Open Market Committee (FOMC) meeting. The host argues that market makers deliberately compress price ranges before major news events to create dense liquidity zones that can be swept in a single move. He explains how to read that manipulation through market‑structure cues and Fibonacci ratios, then offers concrete trade ideas for four assets: Bitcoin – expects a short‑term “fake pump” followed by a dip to a liquidity zone around $19,980, with a swing‑trade entry near $19,400 and a longer‑term bullish target near $23,000. He stresses taking profits before the FOMC volatility. Ethereum – identifies a heads‑and‑shoulders distribution pattern and suggests a long entry around $1,480‑$1,500, warning that leverage should be modest and profits secured quickly. DXY (U.S. Dollar Index) – outlines its inverse relationship with crypto, marks a resistance block that could reject, and applies a discount/premium framework to filter entry zones. He also ties the DXY’s recent parabola break to a broader bullish outlook for Q4, reinforced by historical mid‑term election seasonality. MATIC – presents a heads‑and‑shoulders short setup between $0.834‑$0.821, with a Fibonacci “golden pocket” entry and a target around $1.05, again emphasizing liquidity‑driven moves. Throughout, the host repeatedly advises disciplined risk management, low leverage, and patience—waiting for price to hit the identified zones rather than trying to predict the FOMC outcome. He also references macro themes (mid‑term election patterns, historical DXY behavior) to contextualize the short‑term technical analysis. The stream ends with a brief recap and a note that the next day will return to pre‑recorded content.
Chapters
Right, what's up everybody? So This video/stream. Well, I couldn't film a video today in time for FOMC meeting that is going to be happening in about two hours-ish. So I decided to do a stream instead, just because this would be a lot more valuable to you, and I wanted to keep up the cadence of publishing a video every single day. So yeah, welcome everybody. Is the audio okay for the? For the viewers that are already here, I'm doing a mic test. Can you hear me? Right. The audio is okay. Then. All right, right. If the audio is okay, then we're just going to dive right into it. So first thing, first thing to talk about is definitely Bitcoin, because the fact that we have this kind of a pattern forming right before FOMC is proof that the market makers are always manipulating things. What they do generally before an FOMC meeting, which I've been talking about since last week, is they try to coil up the price really, really tight. And what this does is it creates a lot of many points of liquidity, right? For example, there, there, there, there, there. And over here is the key point of liquidity that we're going to be looking at. I'll talk about this in a bit. Liquidity all over here. So the reason why they do this is because during an FOMC meeting, they just want to be able to Take all the liquidity in one fell swoop, and then just blame it on oh it's because FOMC was happening. That's why the price you know did this kind of shenanigans. When in reality everything is manipulated, it's very hard to hide what you're trying to do on the price action. That's why I always preach to you guys: Hey, market like market structure is really all you need to do well in these markets, and news is important to a certain extent. Treat news sort of like a catalyst for price action, but the actual direction of the price you can see right from the price action. Now before I continue onwards, to the people who watched my last Bitcoin video, did anyone manage to go short at this block that I indicated and go long at this block end that I indicated? Because this was really perfect. Let me, let me know in chat. But anyways, currently this is— the plan is still similar, so I'll just run you through what I'm expecting to happen once FOMC begins. Very likely we're either just going to do like a fake pump up, take out this point of liquidity, go straight down, then take out this point of liquidity before doing another bounce upwards. Now this is just within You know, this little range over here. Ultimately, the ideal area where you're going to want to go long on a Bitcoin swing, right? If you want to swing trade Bitcoin and you want to go long, ideally that's still going to come at about $19,400 in this block that I indicated. And the reason for that is because if you just zoom out a little bit, and let's assume that the move began from this point onwards until this point onwards, then all you need to do is draw a fib from swing low swing high, and you can see that this block lines up right at the 0.5. And if you draw another fib from— let's say that, you know, let's say that this move began from there, then this would be a perfect 0.705, which basically just lines up with a couple of areas of value in terms of the fibs. And the reason I bring up a fib is because the algorithms that move the market and the algorithms that are manipulating the price into this kind of a pattern prior to the FOMC meeting They use the fibs to reprice the markets, right? There's reason why these kinds of patterns form, and you can think of them as fibs, right? If you pull up a fib from this swing low over here to that swing high, again, you can see that price found its bottom at the 0.705, which I already predicted before. So there is a method to this madness, and the moment that you can see it, well, you know exactly. What to do? Let's put it that way. So currently, this is the kind of shenanigans that I'm expecting to happen in the immediate short term. So how does this? How is this going to apply to you? Well, firstly, if you're in any positions at the moment, like if you got long or short, or just generally you are in profits from any point here. No, sorry. From any point within this range, right? During this range, if you're in profits at the moment, I highly recommend that you consider closing out your positions or just taking profit on those positions. Because what happens is, again, all this liquidity has been built up ready for the taking. Later during the FOMC, you're going to see a couple of what I like to call FU moves, where they literally just move the price straight up, move the price straight down, take out all the liquidity Before going back in the true direction of the market. In this case, I'm still I'm still of the opinion that we are still bullish and the target ultimately is going to be at 23k. However, nobody ever went broke taking profits, so it would be a really good idea to do so. Now, how do you actually prepare for the FOMC meeting? Well, first off, I don't know. As of right now. don't see an area where you can go into a short with like just a lot of certainty. However, I do see an area where you can get into a long if that level gets hit, and that's going to be right here at $20,000, or rather $19,980-ish. So over here you will see that you have 2 relatively equal lows over here, and this is known as sort of like a range low, right? If you look at it this way, this is the range high And that this is the range low. So every time you go take out the range low, you don't want to short this, right? You don't want to be a retail trader and go, oh, you know, support is broken, it's time to— it's time to go short. That's not how it works. Instead, when range lows get taken out, that is an opportunity for you to go long, just like how I told you guys to short the next time, right? Back when we were still here, I made a video. taught you guys, hey, the next time that you break above this high, that is an opportunity for you to go short. The reason for that is because above every swing high and below every swing low is liquidity. When liquidity gets taken out, basically most retail traders are just going to look to short this. The market makers are just going to reverse this because doing, doing so would trap everyone that went short here, right? Everyone that sold at really low prices, right? Everyone that were willing sellers at low prices are just going to get trapped the moment they reverse the price. They're going to be either stopped out or they— the price is just going to go until a point where these people just get liquidated. Okay, so that's, that's a rationale behind going long at range lows and going high at range— sorry, going short at range highs. Buy low, sell high. And yet a lot of people struggle to go through with that advice. So when the price hits 1999-ish, 1980-ish, that is an opportunity for you to go long. Although I would be wary to secure the profits really quickly because FOMC is generally a time when you have a lot of volatility in the markets. And because of that, One moment you could be in profits with your long, and the next moment you could be just going straight down, just like how it happened with Dogecoin, right? One moment it's up 30%, the next moment it's down 30%. That's kind of the situation that you're going to get with FOMC. So ultimately, the breakdown is this is the level where you're going to want to look to take advantage of a long, but you want to secure your profits pretty quickly with the ultimate target, right? If you just want to get into a swing trade, that's going to come at about $19,400. Does that make sense so far, everybody? I do hope you guys can forgive the, um, me getting lost in my thoughts a little bit. Haven't done a live stream in a very long while and a bit rusty. Anyways, uh, let's, let's— I have Three other things to cover. No, two two other things, right? We're going to cover Ethereum. We're going to cover the DXY because both of these are very important. And then I'm just going to give you guys a trade idea on Matic, which I talked about briefly yesterday, but just going to give an update on that so that you guys can prepare a little bit better for the FOMC meeting. So moving on to Ethereum, I've already mentioned this in. No, I did not mention this in a video, but I did talk about this in the private Discord group. Where you're getting a distribution pattern on Ethereum. This is a— this is known as a heads and shoulders pattern. And I don't want to seem like I am using patterns here because that's really not the case. Some of the patterns that I really do advocate for, even though generally I trade with the market maker concept in mind, is the heads and shoulders pattern and the inverse heads and shoulders pattern, because This is what's known as a distribution pattern, right? The markets always move in phases of distribution and accumulation. For example, you could have argued that this was accumulation, and you'll very likely see some sort of an inverse heads and shoulders when you're in accumulation. And for example, when you're about to dump, usually it's either an inverse— sorry, it's either a heads and shoulders, something like this, or maybe you get a 3 drives pattern. Right, maybe something like this. Of course, I don't have exactly the best examples to show you at the moment, but what you need to know, like how this is going to affect you, is basically Ethereum is going to be a little bit different compared to Bitcoin because during this entire move upwards, Ethereum and altcoins in general were a lot stronger than Bitcoin due to the fact that, well, Bitcoin dominance was just Going to absolute shit. So the way that we're going to approach this is going to be slightly different, right? So let's assume that this move from low to high began at $1,250-ish. You can see that the 0.705, which is the ideal area that we're going to want to get in for swing, like swing trades, is going to locate— it's going to be located somewhere about $1,370. Now that is a long way away. From Ethereum at its current price. And I do not think that we will return all the way back to 0.705 that soon, at least not today. So instead of looking at this block, I'm going to give you guys something a little bit more actionable that you can take advantage of ASAP. So what I want you to do is mark out this low, mark out this low right here, at 1475. So this is going to be the level where you're going to want to look to go long on Ethereum if you do fall that low. Now again, I cannot just say that the Ethereum chart and the Bitcoin chart is going to be 1 to 1 because that's just not the case at the moment. The patterns here are completely different. Ethereum pumped a lot more than Bitcoin during the last move. But if you do return back to 1480, you can take advantage of A you know one of those F U moves and just go long. Now what I would recommend when you're doing either one of these is don't go with too high leverage. Of course, practice risk management. Just because I say that this is going to happen does not mean that you need to put in your life savings into this trade. If you do that, you're just going to get wrecked. But with solid risk management, this is a really good trade. If you do get it now, alternatively, you can also draw a fib from this swing low to that swing high. Well, actually, you're already bouncing around the 705, so let's not talk about that anymore. Like with Ethereum, it's a little bit harder than Bitcoin because this is the only like real key level that I would prioritize or even consider. So not too much to talk about Ethereum on this end. The only other way that I could see this working out is, yeah, you know, that's the level. That's the level you want to watch, 1480. And if I take a look there, yeah, same story, 1480. Ideally, 1420 is going to be a really good level. Already mentioned this in the Discord as well. I don't think we're going to go to 1420 today, so Yeah, just for today, the actionable advice would be going long somewhere about 1480. That's going to be a really good position to go long from. And just like with Bitcoin, you're going to want to secure your profits pretty quickly. Now ultimately, I still believe that the Q4 plan is still going to be heading upwards. Why do I think so? Well, let's do a quick update on the DXY. Now previously I mentioned that the DXY in the Bitcoin video that I did I believe on Monday, I mentioned the fact that you want to expect the DXY to go up into this block right here where you're going to get rejected. The reason why the DXY matters in this case is because the DXY is literally inversely correlated with the performance of Bitcoin. If DXY is going up, Bitcoin's going down. It's exactly what you're seeing in Bitcoin at the moment. But when the DXY is going down, that's when you see the biggest gains in crypto, like all around. And at the moment, DXY has just gotten back into one of the key sort of resistance areas that I've been looking at. Now, does that mean that the FOMC meeting later is going to cause bullish prices? Because, well, if you're going to get rejected from this order block over here, that means that Bitcoin's going to pump later, right? Not necessarily. The thing about the FOMC that makes it tricky and that screws a lot of people up is a lot of people try to predict what's going to happen during the FOMC prior to it happening, and that's really the last thing that you want to do as a trader. You want to learn to be patient and wait until the price comes into a key area, or when the news actually prints, right? When the news event is over and you know the result of the news event, then you can do, you know, whatever you want in terms of trading. What you don't want to do is try to predict, oh, the FOMC is going to be bullish today, or the FOMC is going to be bearish today, so I'm going to take a short. And then later on, you're going to get absolutely destroyed if the price just goes straight up, and then you're going to panic sell, and then you're going to get out of your position over here. You're going to sell it— I mean, you're going to start closing your shorts there, and then the price is going to go straight down, and then you're like, oh man, why did I get out so early, right? If that sounds familiar, it's probably because you're trying to predict things too much. With trading, it is very much a game of reading and reacting. The more that you can just plan out like the key areas, just draw out some key areas and just sit and wait, you're going to get so, so much more success. So in this case, I have a couple of key levels that I'm looking at, assuming that like we will using this high and this low as the move. This block in this case does not really seem like the highest probability sort of block of resistance. Let me explain why. Usually within any, within any market range— I'm just going to go to a blank page to show you this, right? Within any market range, in this case let's say that that's a swing high, that's a swing low— within this range, anything that is below the 0.5 is known as the price being in a discount. And when price is in a discount, you don't really want to look to sell, do you? You want to look to buy when prices are at a discount, whereas when prices are at a premium, that's when you want to look to sell. So using this method, using this theory, it will help you filter out a lot of the bad entries that you might otherwise be getting into. So let's apply that. No, Siri, I did not call for you. Siri, go away. Okay. Um, right. Uh, that was a little— anyways. Yeah. Uh, applying that theory back to not like applying that theory. Sorry. Got lost track. Lost track of the, uh, train of thought there. We don't really want to prioritize this block here because it's in the discount zone. As sort of the level that we want to go short at. Instead, this level right here at about give or take 112.6 points is going to be a lot higher conviction as a short area for the DXY. But that is only if we are taking a look at DXY from this sort of big range. If we take a look at a smaller range, for example, from there to there, then this would be a perfectly acceptable level for the DXY to get rejected. Again, you're sharing the data. Ultimately, this does not mean that you should be predicting, trying to figure out, like taking bets before, you know, the race begins. What I'm just saying is prepare yourself, have the available data, understand all the scenarios that's going to happen, and that's how you're going to be able to take advantage of anything that comes your way. Ultimately, I still believe based on price action, the fact that you have Broke structure on multiple occasions, especially on the daily chart, means that you are in the process of reversing market structure. Right? This entire time from let's take a look here. The entire time since May 2021 until basically the end of September or yeah, the end of September basically. The DXY has just been in bullish market structure the entire time, and currently we are seeing the first shift. In market structure for the DXY. In fact, I will bring up a really interesting graphic just to illustrate this for you guys. I posted this in the private Discord group, but and I also talked about this in a previous video. But just to remind you guys again, this is the DXY. This is the parabolic curve pattern, right? Not saying that this is a pattern, but you get the idea. You've just been going parabolically up on the DXY, and that's why Bitcoin has been dumping parabolically down. And at some point you're going to break the parabola and you're going to reverse all those gains. Remember, anything that goes up has to come down. Anything that goes down has to come up, unless it's a shitcoin, in which case then it doesn't. Then looking at this theory, like following that theory, you can see that we have recently just broken the parabola on the DXY. So that is one of the reasons why I believe Q4 is going to be great. Um, the second reason, of course, if you have been watching my channel for a bit Is if you've been watching my channel for the last two weeks, basically, I talk a lot about the midterm elections, which is about to happen this week. I believe this week or next week, in the next few days. Let's let's put it that way. Since 1942, which is 80 years of data that we have to work with, every single October that precedes a midterm election has generally meant that the prices of all equity markets or risk markets such as stocks and crypto have found their bottom in November, in October prior to a midterm election. So going alongside 80 years of data, we can assume, right, past, like history, like the past doesn't indicate like future success, but It does rhyme. And going based on that logic, it would be safe to assume that October would be the bottom, and we should be able to realistically expect Q4 to be a bullish month for risk markets like crypto and stocks. So hopefully that all makes sense. Currently on the X, currently on the S&P 500, this is this is the only pattern that I'm really looking at. Same thing with same thing with Bitcoin. You have broken structure on the daily chart already, so any retraces back below is an opportunity for you to buy heading into. Well, I don't want to say trend line resistance, but. Let's use this to visualize it for now. Right, so same thing for Bitcoin. This is generally what I'm expecting. So some kind of a retracement before you move on to 23K. So hopefully this should make a ton of sense. And do you guys got any questions so far? One of the, um, one of the benefits of doing a live stream is that I can interact with you guys in real time. But in the meantime, also, I'm also going to talk about MATIC, right? I promise you guys I would talk about MATIC, and I would give you guys a nice trade idea to go alongside this live stream as a reward for sticking around until, you know, this far. So MATIC at the moment— yesterday I made a video on MATIC saying that you want to short MATIC heading into this block. At the moment, this is playing out brilliantly well. The block that I'm looking at in particular Is the block right here from 0.834-ish until 0.821-ish. Now, the reason why this matters is again, this is a heads and shoulders pattern. That is a distribution pattern, which indicates the market makers want the price to go down. And if you draw a fib, right, every time like you get a shift in market structure, you always want to start looking where could price realistically find its bottom or. Or is there a sort of like a bigger narrative in play here? So assuming that this move began from that swing low to that swing high, you can see that this block lines up exactly at the 0.705, which is the golden pocket and the level that is generally just going to be a really good buying price for MATIC. Now my target for this trade is going to be right here at 1.05, because if we move on to the daily chart, I should be able to illustrate this a lot clearer for you. You, you're generally getting some sort of, um, I don't want to say breakout, but this makes it a lot easier for me to visualize it for you, right? Market structure is still bullish. As long as you do not break this low right here at 0.775, means that this is likely going to be the next move. Right, something like that. And the reason why this level is the level that I'm targeting again has to do with liquidity. The markets always move in term like in the direction of where there is the most liquidity above old highs, right? Old swing highs and below old swing lows. For example, there is a reason why Matic found its bottom here, right? There's a reason why you go long there after you take out the liquidity back there. Same thing. This is the level where You're just going to want to take profit on the longs and maybe start considering going short. So hopefully this all makes sense. So basically, this is sort of the trade that I'm looking for, in essence. Right, um, that basically— right, um, any questions so far? Just go ahead and type it in chat. I'll get back to you guys. Right. Uh, given that the chat is being awfully quiet at the moment, I'm going to assume that there are no questions. So this basically concludes it for me. So thank you all for coming. Hopefully this video has been of value to you. Tomorrow I'll be back onto the pre-recorded video stuff. Today it has to be a livestream because I was in the hospital literally the entire day, so bear with me. Anyways, um, thank you all for coming. Hopefully now you are well prepared for whatever, whatever is going to happen in the FOMC. Cheers, bye! Bye-bye.