Has The #Crypto Bull Run Already Ended? Or Are We Just Getting Started?
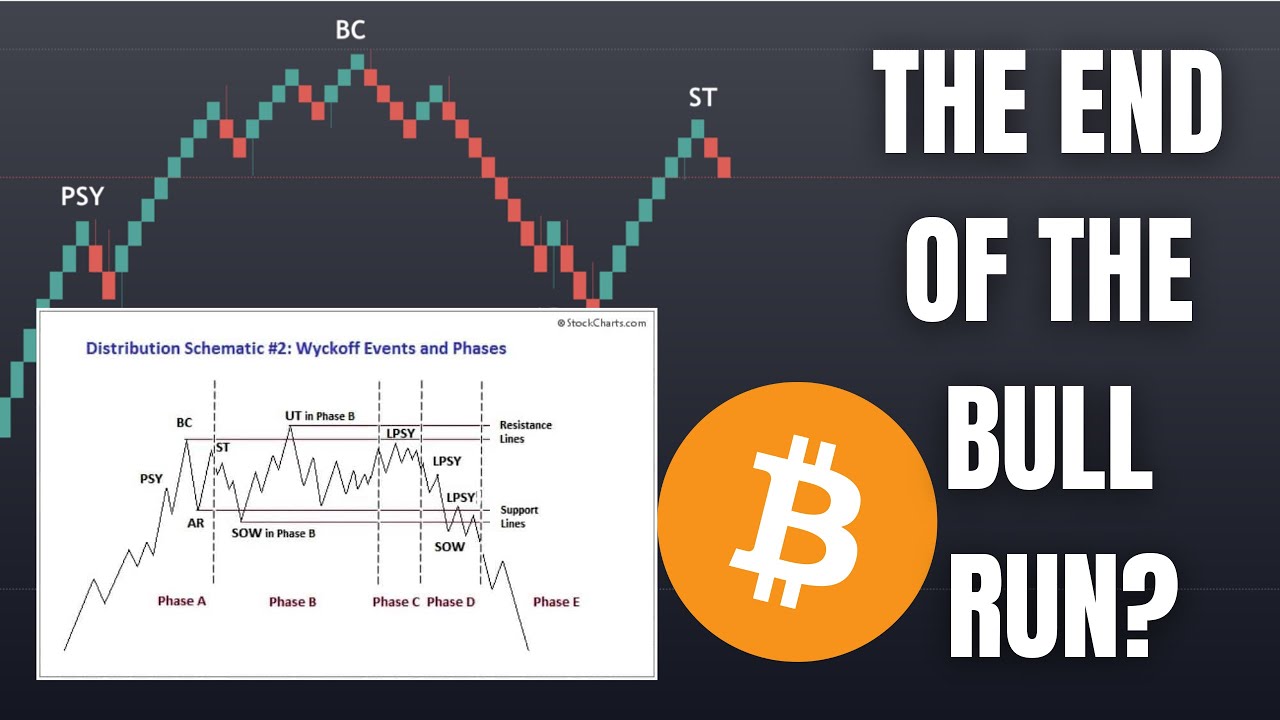
In this YouTube video, The Art of Crypto evaluates whether the cryptocurrency market—specifically Bitcoin—is entering a bear phase or if the recent rally will continue. The host introduces three analytical scenarios: (1) a classic Wyckoff schematic applied to daily charts, suggesting a potential bearish phase after a failed breakout above $50K; (2) an order‑block and market‑structure based analysis highlighted by a Discord member (Muffin Man), indicating a bearish order‑block fill and a projected decline to $24‑26K before a modest rebound; (3) a Renko‑chart perspective that also points to 2‑3 months of bearishness with a low‑range around $25K and a possible long‑term rally toward $75‑100K. The video then offers concrete trading guidance: watch the $47K resistance level, treat $49‑51K as a bearish order‑block zone for short entries, and consider long positions only if a clear break above $47K occurs. The host also promotes his private Discord, a trading course, and a specific ARX/USDT trade on KuCoin, providing entry, stop‑loss, and tiered take‑profit targets. Throughout, he balances short‑term bearish bias with a long‑term bullish outlook on Bitcoin, acknowledges the speculative nature of his models, and encourages viewers to engage with his community.
Chapters
What's up everybody? Welcome back to The Art of Crypto, the birthplace of absolutely legendary gains. In this video, we are going to discuss whether or not we are currently in a bear market. Now, the concepts discussed in this video is not something that many people would have discussed before. So if you find this video helpful, please make sure to share it to whoever who might find this helpful. So right before I get into it though, if you haven't already followed me on Twitter @TheArtOfCrypto, you're gonna wanna do so. This is where I'm sharing the latest market updates, stuff that I wouldn't otherwise be able to share on YouTube due to time constraints. And not only that, you're gonna get access to a $10K to $100K trading journal where I just, you know, write down my daily thoughts every day on what's going on, what I'm thinking, what's going through my head. So if that's something you would be interested in, make sure you follow my Twitter. So immediately, let's get into this concept that I am looking at. And in order to understand this better, we have to bring up this thing called the Wyckoff schematic. So I'm sure many of you have already heard about, you know, Wyckoff, Wyckoff, you know, this was Wyckoff and that's why you got the dump. You know, a lot of people seem to have forgot about the Wyckoff schematic. Now here's my thoughts about the Wyckoff schematic, right? It's really good for identifying Like you know, hey, this indeed was Wyckoff in hindsight, right? It's very easy to see it in hindsight. But you know, there's a couple of other skills that you sort of need to learn, some knowledge that you need to acquire before you can really implement Wyckoff as a method to foresee what the market's going to do. So in this case, I'm not saying that my understanding of institutional trading is at the peak, but I have learned enough about institutional trading that I know when to see it. I know the signs of you know the beginning of a bear market enough to tell. So in this case. Are we in a bear market? So immediately, there are three scenarios that I want to discuss in this video. So the first one is going to be you know this classic Wyckoff schematic, right? This is just vanilla Wyckoff schematic, and you can see from before that you know this was the PSY, right? This was the BC over here somewhere around here. I want you to ignore all these letters first, right? I will get into these letters later, but the BC was somewhere about here. And then this was the UT in Phase B, right? If you consider it that way, then this is how it would look like, right? And then you got the dump, and then you got your LPSY— sorry, you got the dump here, and then you got your LPSY here, and then, you know, uh, rest is history. And then now we seem to be going back into the bull market, right? That's something that a lot of people might be, you know, a lot of people might agree, right? Hey, we're back in the bull market now. Yeah, we're bullish now. So like, they may be right about that, but here, that, that was scenario number 1, and Here's the thing that you must understand. So after a Wyckoff distribution— sorry, Wyckoff accumulation, right? You might look at this and go like, hey, this might be Wyckoff accumulation. But at the moment, we are, you know, coming up, and potentially this could be the PSY, this could be the BC, right? That I know it doesn't look like traditional Wyckoff, and it doesn't need to be played out over this long of an extended period of time. But, you know, Wyckoff is something that is very fractal. Right? If you see this pattern happening on the daily chart, you will see this pattern happening on the 1-minute, on the 5-minute, on the 15-minute, and etc. So you could argue that this indeed was perhaps the BC, or this might be the UT in Phase B, and that now we are, you know, starting to go down, right? This pump, and then it will bring us back up to about this area right here. Let me just mark it down, right, at about $50K. And then we're going to get rejected off $50K, and then we are going to dump. So that's going to be scenario number 1. And again, any of the concepts that I mentioned in this video are just theories, right? This is just stuff that you might want to keep in mind because I personally know a couple of whale friends that have already sold most of your spot holdings, right? Not only here but over here as well. And it is in their sincere belief that we are currently already in a bear market. As for whether or not they are right, you know, not a lot of whale friends have done it yet, but I already have a couple of, you know, just smart money that are already doing so. So that's going to be scenario number 1, just, you know, just vanilla. And that scenario number 1 is indeed bearish. Now here's the scenario number 2 that I want to talk about, and we have to actually shout out a member of the private Discord group. So right now I'm in the moderator lounge. So all of the members in this, you know, the moderator squad are, you know, at one point new members in the AOC Discord. And Muffin Man, honestly, a big shout out to Muffin Man. This guy has been phenomenal, right? This guy came into, you know, the group knowing next to nothing. Okay, maybe he didn't Maybe he knew a little bit, but he was brand new to trading. And you know, I'm not gonna be— I'm not gonna be so bold as to say that I was responsible for everything that he's done. Absolutely not the case. This guy did it through his own sheer hard work and determination. And at the moment, this guy is a legend. He's seeing things in the charts that even I'm not seeing. And this Wyckoff schematic thingy is something that he observed. So if you flip the Wyckoff schematic around, right, and this is the pattern that he's sort of noticing. So If I just move this over here so that, you know, okay, actually that might not be very visible. So just give me a moment. Actually, let me just copy this image and let's see if I can paste it here. Okay, that's not the image. Okay, so now that I have pasted that picture over here, let's just move this out of the way for now. So let's focus on this picture right here. So if you just base it off of this picture, right now I'm on the daily chart, you can see that this PSY was like this area right here. Right? And then we got up, and then we formed this tree, this tree drives pattern, right? This tree triangle, like this tree peaks pattern over here. And you can see that this is indeed looks like a tree peak pattern. And then we started dumping, right? Dumping. And then right now you can see that we came exactly back up. I want you to notice here, we came back up to, you know, this area right here, which is what you would call a bearish order block on the daily chart. And just to show you what that looks like, this right here is your is your bearish order block right there. And you can see how the price came exactly up to the bearish order block, immediately gets rejected. So based on this theory right here, it would indicate that we are about— like, this right here is the peak, and we are about to go back into another 2 to 3 months of downtrends, maybe 1 to 2 months. And then it would ultimately lead us to about $24K to $26K, and then it will lead us to pump, right? See over here, we pump, right? After we get to this phase, we do a pump, and then it would likely lead us back to about $40K, right? Or maybe $37K before going back down, go up. And basically, if, if everything would follow this schematic right here— now, this is absolutely no— there is absolutely no basis off of this, but I'm simply telling you what I'm observing. Because currently, not only have we managed to fail, right? We failed to break above one bearish order block on the daily chart, right? This is a very major order block that I've been talking about, you know, for a while back when Bitcoin was still here, right? And I was discussing where, you know, Bitcoin could potentially lead to. I was discussing this bearish order block already. And at the moment, it does seem like, you know, not only did we get rejected off of here, but we got rejected off of this block as well. Notice how the price came, just dipped right into that block, and then bam, right? So usually when I am looking for signs of a bearish reversal, right, signs of entering into a bear market or just bearish times, what I look for is 2 things. First is a break of market structure. So you can see clearly, right, in order for something to still be bullish, we need bullish market structure. So something like that, higher highs and higher lows. However, during this move down here, we have already broken this higher low, which caused it to form a lower low. And then next one, we formed a lower high. So already that is one condition, right? One of the criteria needed in order to fulfill a bearish, you know, just bearish times. And the second condition in order to confirm bearish order flow is a bearish order block fill. And I want you to notice whenever we are going up, you can see that over here you have your, you know, your bullish order block, and then price comes up, fills the bullish order block before pumping, right? Pump after you pump. That's your bullish order block right there. Look where the price comes back to. Bam, right? And but the next time we aren't so, you know, lucky, and indeed we do get the break of structure. And that's how you know that, you know, things are starting— like the order flow is starting to shift bearish. As for the reasons why that happens, I'm not going to get into it in this video because that is going to make this video way too long. But simply put, this is scenario number 2 that you want to keep in mind, and this is something that signals that we are potentially going into a bear market. Now, don't worry, I will tell you at the end of this video how you can capitalize on, you know, this knowledge that you have just acquired. But before I do that, I need to get into the third scenario. Now, the third scenario involves the use of a Renko chart. Now, when you use a Renko chart, it actually becomes very, very neat. You can see, like, how neat is this? And if you just take a look like this, right, if you look at a Renko chart, everything becomes sort of very clear, right? You sort of have your PSY. Let me just enlarge this a little bit for those of you who might not be able to see it. You have your PSY over here, right? And then you've got your BC. That's the BC. And then you've got your AR over here, right? Because it dumps and it goes up, right? Dumps, goes up. And that's your ST, which means that at the moment we are indeed heading into 2 to 3 months of bearishness that will bring us to about $25K to— sorry, $26K to $24K before ultimately bouncing back up to what I would assume to be $75K to $80K, right? Potentially $100K, but According to this chart right here, this is indeed, you know, $75K to $100K seems to be where we would ultimately end up. And this is the third scenario. Now, do I think Bitcoin is bullish, right? Do I think the crypto market is still bullish? Honestly, I would say yes. However, sometimes you really cannot deny the effectiveness of, you know, just Wyckoff in general. And Renko chart isn't like— the Renko chart isn't something that people usually use. In fact, if it wasn't for the Muffin Man, Again, big shout out to him. I wouldn't have even known this, but it was definitely a scenario that I was keeping in mind. And at the moment, just based off of my, you know, understanding of institutional trading, I might be so bold as to say that we are potentially heading into a couple months of bearish, you know, just bearish times. However, not all hope is lost because now I'm actually going to discuss how you can, you know, take advantage of this information that you have just acquired. So in order to do that, we are going to have to go on to, you know, actually we'll start on the daily chart first. So here's how you will, you know, take advantage of this information. So assuming that you are already in bearish order flow, that means that remember how Bitcoin price got rejected off of order blocks over here? Now these are major, major order blocks, but remember everything is fractal, right? Everything when it comes to trading is fractal. So what do I mean by that? For example, you might see a Wyckoff accumulation over here, right? It sort of goes like this: bam, bam, and then bam, right? Something like that. And yet on a major scale, right, on a higher time frame, you are indeed in a Wyckoff distribution, right? Are both correct? Are both wrong? Honestly, they're both correct, and they both could be wrong at the same time. So you never want to place too much weight on this. However, right now we just want to understand if, hey, Are we bearish or are we bullish? In this case, you really just want to pay attention to a couple of things really. The first of which is going to be you want to see Bitcoin break above $47K.4 in order for it to be bullish, right? In the event that it does break $47.4K, you are going to go straight to $49K. And at $49K, this is where you are going to want to look for a bearish order block, right over here. You already formed your bearish order block right here. Right? Let's not include this part. So let's just include this part. This is already a bearish order block, which means you want to look for short opportunities over here, right? $49K to $50K, that is going to be your short area. Now you could potentially use this area as well. So let me just extend this bearish order block up here. You might, you, you might be able to use this area as well, right? $49K to $51K, this is going to be your major bearish order block if Bitcoin does not manage to break above this order block, then just give up on Bitcoin being bullish and just accept the fact that you are probably going to go into 2 to 3 months of bearishness. So that's going to be how you're going to utilize this information. Now, before I even get into that though, like, I actually just written a, you know, a, an update on Bitcoin before I post my, you know, before I recorded this video. So on that note, if you guys feel like, like, hey, most of the time you don't know what you're doing and you just, you know, you're just following the ebbs and flow of the market. And, you know, if you just want to learn how to do this for yourselves, right, maybe you've watched my videos and I seem to know what I'm doing and I seem to be right a lot of the time, then you're going to want to consider joining the private Discord group, right? Not only are you going to get like pretty much real-time market updates every single day, but you're going to get access to a trading course where I teach you everything that I've learned over the years. And you're going to learn how to filter out 90% of the things that don't work and only You know, learn the things that probably do work. Not only that, you're gonna get access to profitable trading setups every single day where people are making money, you know, literally every single day. And let's just say that there have already been a few people that have managed to pay off their subscription really, really quickly. So if that's something that, you know, you might be interested in, then make sure you check out the link in the description. For now though, let's get back into the video. And in the event that you do get rejected off of this bearish order block at the moment, We are in bearish order flow, right? In the immediate short term, I hate to say it. I do not like to be the bearer of bad news, but at the moment, it does seem like we are in bearish order flow, right? Long term, I'm still bullish on Bitcoin. Absolutely bullish on Bitcoin. And right now, you can see that Bitcoin is doing you know basically what I teach all the time just in my YouTube videos, which is price always moves in periods of expansions and consolidations. Downwards consolidations usually lead to an area of support before. Bouncing, right? And over here you can see that this is indeed a downwards consolidation into an area of support, and then now it broke out. So learn to spot these patterns on your own chart and you're going to be really, really successful. For now, $47K appears to be strong resistance. Would I take a long on Bitcoin? Absolutely not. Right now Bitcoin is literally in the limbo zone, right? There's a 50/50 chance that you're going to go up to fill this bearish order block before coming down. So if you were looking to take a short I would do it at around this level. But if you were looking to take along, then you are in a limbo zone as well, right? Because if you follow just you know that you know the three three to four scenarios that I gave from before, then you would understand that very likely you're still going down, right? And in this case, there is actually a very good argument for why you might be going down. The first of which is you know you've got liquidity here that you know you you did just clear. So chances are we are going up. But right now you're in the middle of nowhere. Like if you do go along here, where would you set your stop loss? You know, possibly over there, and your take profit would be somewhere there and somewhere there. Now, if you judge it in this way, then the risk to reward would still be pretty good. But I just, I would continue to remain flat, right? This is a weekend, especially this is the 9/11, you know, today's 9/11 at the time that I'm posting this. Again, tragic, tragic event. My prayers do go out to the families of those who were lost in the tragedy. But hey, you know, I know I talked a lot in this video and I shared Multiple scenarios, but let's just let's just try to summarize it, right? If you break above forty-seven k, you're very likely going to go to forty-nine k immediately. But at the moment, forty-nine k to fifty-one k remains to be a strong bearish area for Bitcoin to get rejected by. So expect a rejection there. Now, am I saying that one hundred percent is going to get rejected? Absolutely not. But chances are, you know, just like how it happened in the previous right over here, you've got your bearish block. You come up to fill it, and then you continue dumping, right? Just like how it worked for this previous, you know, the previous dump right here. Doesn't even need to be the May, you know, the May dump. Could be happening in April, could be happening in February, could be happening in March. Whatever the case, expect this area to be bearish until you get confirmation and you break above that level, right? If you break above that level, then absolutely you're going to go back to $59K, right? $59K to $60K, absolutely. But before that happens, we are, you know, immediately in the short term, we are bearish. And as for areas where you might look to buy Bitcoin, I've already posted about that in the video that I did yesterday. So, you know, not only are you gonna get access to, you know, Bitcoin entries, but you're gonna learn about exactly the best areas to buy Ethereum, XRP, Litecoin, Solana, you know, Fantom, Cardano, Polkadot, Chainlink. Pretty much every major coin is up there. I give exact entries as to where To enter those coins. So make sure you go watch that video after this one. But I will definitely 100% continue to monitor the previous, you know, scenarios that I talked about, and I will be sure to post regular updates on, you know, on YouTube so that you guys will have an idea of what to do. For me, you know, personally, I wouldn't pay too much weight to these, you know, schematics and predictions. We just take it one day at a time. We take it one level at a time. Should you sell your spot? Probably not. You could. For me personally, I've already taken a very good chunk of profits over here when I saw this distribution pattern going on. So me personally, I'm not panicking. But if it was you, you know, who knows, you could take some spot profit over here. But you know, here's the other thing you might want to consider, right? The Bitcoin stock-to-flow model, which has never, you know, never really been wrong. At the moment, we are still under the fair value of Bitcoin, you know, by right. We are supposed to be at $100K, but at the moment we are hovering around $50K. The stock-to-flow model does suggest that we are, you know, supposedly going up. However, who knows? Could this be the first time stock-to-flow gets proven wrong? I have no— you know, I have no clue as well. I can only take it one day at a time, and I suggest you do as well. At the moment, these are the levels to watch. And of course, as a bonus for staying until this point— of course you do get a bonus— And that bonus is going to come in the form of ARX, right? I called this in the Discord group over here when it was at this support line, but even if you watch it now, you still wouldn't be too late. So this is ARX/USDT. This is a KuCoin coin, so make sure you install KuCoin, right? If you want a referral code, I will leave it in the description below. You should be able to get 5% to 10% off your trading fees, but if you don't want to use it, don't. If you want to use it, use it. So ARX, right, you're going to want to mark down this level at 0.0489 or just 0.049, right? You're going to want to buy the breakout of this level, right? As the price is breaking out of that level, you're going to want to buy along with the breakout or on a bullish retest right here. Now doing so will allow you to get a pretty, pretty good entry because you can literally just set your stop loss right below a swing low. And you know, because a breakout is supposed to break out, it's not supposed to come up and come down. Right? And in the event that it does do so, then you could just get stopped out for a minimal loss. And here are going to be your take profit targets. That's going to be at about 0.054, 0.061, 0.071, 0.08, 0.091, 0.106, 0.121, and 0.181. Now the way you're going to want to utilize these take profit targets is as the price is going up, you're going to want to take 25, 25, 25, maybe 25, right? Just something like that, because nobody knows exactly where's the top going to be. But let's just say that, you know, um, at the moment ARX is consolidating very nicely, right? I hope you remember what I said about Bitcoin just now, right? Price moves in phases of expansions and then downward consolidation into support, right? This would be your support right here. Notice how this is your previous high, this is your bullish order block. Again, order blocks work like absolute magic, so make sure you learned the concepts of order blocks. So into support and then it bounces, right? Clearly it looks like we are bouncing already. But if you're watching this video at this point, you are not going to be too late. So if this pops, this is going to be an easy 10% to 20% potentially. So if you've watched until this point so far, you know, hey, just drop me a comment so that I know who are the real ones who stuck until this point. This has really just been a— just been a really like big, you know, brain brain vomit, right? I haven't really filtered my thoughts, really just, just, you know, scenarios that I was looking at in order to determine if, you know, the bear market is indeed upon us. So honestly, if you're still here, I'm so grateful that you're still here because I really could have structured this better. And I promise I will structure my future videos better. But hey, if you're still here, like for real, thank you. You are the reason why I continue to pump out content every single day. And let me just tell you, it means a lot to me. So if you're still here, just comment down in the comment section this word over here, Wyckoff, because that's what we've been talking about in this video, right? Wyckoff schematics. And man, much love to you guys. At the moment, if you're interested to join the private Discord group, I'mma see you inside. But to the rest of you, you know, may the gains be with you, and peace, my friend.




