Is A $200 Polkadot Still Possible This Chart Says ……
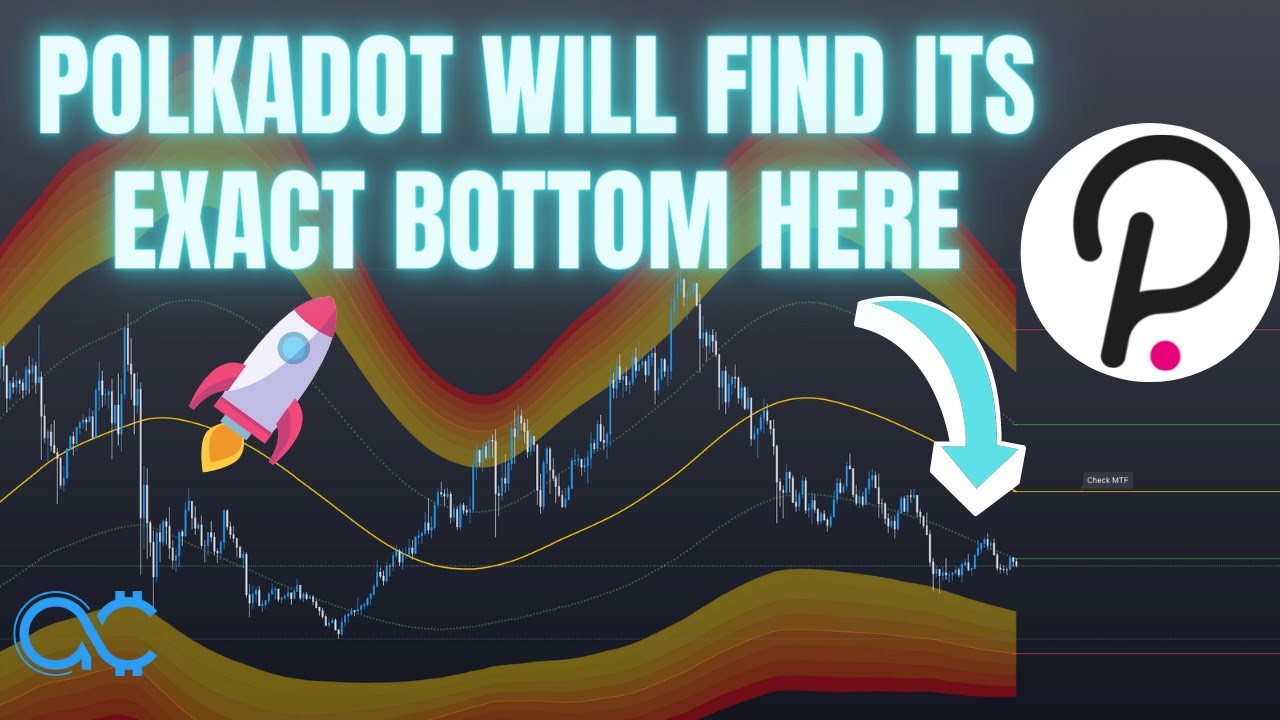
In this YouTube video, the creator (The Art of Crypto) delivers a comprehensive technical analysis of Polkadot (DOT) across multiple timeframes. He begins by setting premises about the long‑term nature of the analysis, the role of liquidity, and the influence of algorithmic market makers. Using daily, weekly, and 4‑hour charts, he identifies key support zones ($16, $13, $11, $7) through equal lows, order blocks, and mean‑reversion channels, and explains why these levels could act as bottoms. He then outlines short‑term (≈$28.5), mid‑term (≈$32) and long‑term price targets, employing Fibonacci extensions (1.618‑5.618) to project potential moves toward $100, $150, and $200‑$250 over the next 1‑3 years. Throughout, he provides trading guidance—stop‑loss placement, risk‑to‑reward ratios (up to 37:1), and profit‑taking advice—while acknowledging uncertainty and market‑driven volatility. The video concludes with a call‑to‑action encouraging likes, comments, and subscription to a paid private trading group for deeper market updates and trade signals.
Chapters
What's up everybody, this is going to be a longer-term analysis of Polkadot. And so if you want to figure out exactly where the bottom of Polkadot is going to be coming, or if the bottom for Polkadot on a macro timeframe is already in, then this is going to be the video for you. Not only that, I'm also going to be talking about some short-term, midterm, and long-term targets for Polkadot. So if these are things that you're interested in, make sure you stick around to the end of the video. Before I dive right into it though, I would like to set a couple of house rules, uh, just a couple of premises that you guys should keep in mind as I do this analysis. Firstly, this is going to be a long-term analysis, which means this is going to be done on either the daily or the weekly chart, which means that there are things that are bound to change over the course of the next 3 to 6 months. Where you know maybe there could be some you know piece of really bad news that might just tank the price. Maybe there could be a piece of really good news that you know maybe I might say that this is going to be the bottom, but it just starts pumping from there. So instead of giving you a clear cut, just like oh price is going to do this this this that that that. Instead of what I'm going to do is I'm going to give you what to expect at each key level for Polkadot. So now that you understand that, let's just jump right into it. First things first. Before I talk about any, you know, higher term, you know, higher time frame levels, you might be wondering, I do have a long position set over here. What is that? So to explain, I'm gonna have to go into the 4-hourly chart. So first things first, first thing I'm going to talk about is the fact that you have equal lows over here, right? And whenever you see equal lows in the chart, right, you always want to be thinking that those lows are going to be run sometime, you know, sooner than just Some time, right? Now the reason I say that is because whenever you get equal lows, you have liquidity there. By liquidity, what I mean is retail is probably going to be looking at this level right here and they're going to be thinking, oh wow, look at how the price came exactly back down to this level. That's going to be very strong support. Yeah, so if I do go long there, I'll set my stop loss right underneath that quote unquote support and I'm going to be safe. So here's how the market maker is going to do things. Right? They're going to bring the price down just a tiny bit below it, and they're going to wick it above it, right? So as it comes down here, right, there are a couple things that happen. Firstly, support. Once support gets breached, what are shorters going to look to do? They're going to short, right? Because, you know, you short the breakdown. When that happens, that's going to be one part of the equation. Second part of the equation, retail traders that went long are going to set their stop loss below here. So you're getting a, you know, an influx of sell orders at once. And so market makers know this. And before I get into anything else, you have to understand that the market runs on liquidity. So all these moves that you see here, it's because the market makers wanted these moves to happen, right? For those of you who believe that the markets are not manipulated, you might want to have to look into the data, because algorithms take up about 70 to 80% of daily trading volume. So if you fail to understand that, let's just say you're very likely going to get wrecked. And more importantly, when you understand that then you can start looking to trade with these algorithms instead of against them. So it's very important that you understand what's going to likely happen and where the liquidity is, because these algorithms work on liquidity, right? Where the liquidity is, they're going to move the markets there. So for example, I can explain it quickly to you, right? Once you put, you know, once you take, go down here, right? Once you break market structure and you go down here, there is a zone of imbalance, right? I'm going to draw it out here. Basically, in this entire zone right here, at the time, there was zero price action, right? Let's just put it this way. So this is going to be your bearish order block, and look where the price comes back to before getting rejected. Similarly, that is a bullish order block as well. Look where the price comes back to before bouncing, right? This is just an example that these algorithms need to fill in the imbalances, such as over here, right? So going with that same train of thought, assuming that order flow is bearish, you're going to take out both of these lows right here. Which are equal lows. And I've already said that liquidity— the market moves on liquidity. So first things first, this is just a— this has nothing to do with the video about a long-term analysis, but this will come in useful later when I start explaining other concepts. So that's going to be the first, you know, just a, you know, quick short-term trade that you can take. But otherwise, the first bottom that I'm looking for for Polkadot ideally is going to be at about $16. Let me explain. Firstly, $16, right? If you go onto the daily chart, it is a very key level. Historically speaking, whenever you come back to here, you've either found support or you found resistance somewhere about this level. But that's not why I'm talking about this level. The reason I'm talking about this level is because, again, take a look here. You have fairly equal lows over here, and you have a poor low formed on the 1-hourly chart. So let's zoom into that one. So just like a similar pattern of this liquidity purge and revert, You can apply that same concept down there, right? Wider stop loss, maybe a higher target, something like that. Because this is a key daily low. Do I expect— am I expecting that to happen at the moment? Not yet. But this low right here, fully expecting it. And who knows, you could just reverse from here, right, and just go into an uptrend. Something that could absolutely happen as well. So just pay attention to 17 and 16. These are my areas of interest in the immediate short term. But they might not be the exact bottom. So what do you do then? So the next level that you're going to want to look at is over here, right here at $13. In fact, before I start bringing up all these levels, let's just sum it up. I'm looking at $13, $11, and $7. So let's see, once I bring up the mean reversion channels, does these add up? And you can see that it does indeed add up. And I promise you guys, I've been filming this video back to back to back I filmed Solana first, and I filmed Chainlink, and I'm directly moving into Polkadot. Trust me, I have not had time to take a look at this prior to filming this video. So notice how I'm only bringing up indicators to double confirm my analysis rather than basing my analysis off of these indicators, right? I'm not starting my analysis off with these indicators. I'm using them for confirmation. And you can see that in fact, the mean reversion channels does indicate that That the area between $13,000, $13,500, and $11,000 is going to be a very key level to find a bottom at. And historically speaking, historically speaking, we have only touched, you know, this, the bottom band of the mean reversion channel about— let's see, I don't think this is the, uh, I don't think this is the latest chart that is available. Probably Bitfinex would be, uh, be a longer, be a longer chart. Let's see. Yeah, yeah, this is definitely a longer one. So based on this data, right, we have only touched the bottom band about once, and that was back in— it was back in the May crash. Yeah, the May crash of last year. And you can see that that was the bottom, right? The next move, it just went to the upper band. So could we have already had the bottom formed here at 16? Absolutely possible, right? Absolutely possible. So currently, that's why I'm telling you guys to pay attention to 17. Because if you do get a liquidity purge here, you might just, you know, just full-on just go on a full-on reversal, something like that, right? That's a— how many, how many risk-to-reward ratio? 37 risk-to-reward ratio. So something that could absolutely be possible as well. So back to the question at hand, you know, do I think the Polkadot bottom is in already? I think so, right? I think so. I don't think Bitcoin's going to go below $34K again, at least not in the near future. And besides that, uh, there is, you know, if Polkadot does go back to $13 or even $10, uh, not expecting $10 for sure, especially because, you know, remember what I said earlier about order blocks? This right here, that's, that's a bullish order block right here, this zone marked in blue. So if you do get back to $13, right, that's going to be really strong support. So if you do get here, right, that's confirmation along with mean reversion channels that this is likely going to be the bottom. Am I expecting that To get there? Frankly speaking, no. But again, as I said in the beginning of this video, I don't know what's going to happen next. What I can tell you is what's going to happen at each level, what's likely to happen at each level, and which levels that you should be paying attention to. So I'm preparing you guys for whatever happens. Yeah, so that's going to be, you know, bottom zones for Polkadot. Fully not expecting it to go back to $7, but if you do go back to $7 or even $4.50, right, God forbid, That's probably going to be the bear market low right there. It's going to come in between these two levels. So not expecting it to get there, but if it gets there, you know, you know what to expect. So now that we have identified possible bottoms, we're going to have to identify some short-term, midterm, and long-term targets. Now let's start off with the midterm, right? Let's go. Sorry, we'll start off from the short-term, but in order to understand the short-term, we have to go on to the weekly chart as well. So that's going to be a top that we want to pay attention to. So that's the one. Okay, so in the immediate short term, if order flow reverses to bullish right now— and let me explain what that means. Basically, when order flow is bearish, you're coming down to take out sell-side liquidity, right? I repeat, look at the lows here, sell-side liquidity, right? You target the sell-side liquidity, you wick just a bit below it, reverse it. That is what happens when order flow is bearish. Price is attracted to previous major lows. For example, over here you have that major low, wick below it, bounce, right? Same thing here. You will find this pattern repeating many, many times. Same thing here, that's a previous major low. Look at price, bam, right? So when order flow is bearish, you always— price is always attracted to previous lows. But when order flow is bullish, price is attracted to previous major highs. The first confirmation for order flow to be bullish. Honestly, right now it's definitely, you know, I don't think it's bullish yet, right? Not only do you have equal lows there, you have equal lows over there. So chances are it's probably going to get, you know, run. So the first major high in the short term that you want to see, you know, taken out is going to be $28.50, right? That's going to be the short-term target. I expect Polkadot to hit $32 in about a couple months, maybe 3 months. So that's the midterm target. And the reason I came up with that is from the weekly chart. That's a previous swing high. What, what's likely going to happen once you take out this level, right, is you're going to go in for some kind of reversal. This is what I'm expecting. Every time you take out a major high, you're going to go in for some kind of reversal. It could last long, it could last just a while, but either way, once this has been taken out, you understand that order flow is already bullish, which means you're going to probably very likely make a push for a new all-time high. On Polkadot, and that leads me to the next part of this video, which is long-term targets for Polkadot. And there's going to be a couple of issues with with using this method. Firstly, I'm going to use the fibs to identify where could a possible long-term target come for Polkadot. However, the thing with fibs is that you tend to need to use it with swing highs and swing lows. The issue with that is I don't know if sixteen is going to be the swing low. If it is indeed the bottom, then then you just draw it from that swing high over there to that swing low over there. Bam. But if it breaks below this bottom and it forms another bottom, let's say over there, then you just drag that down to there. I hope you guys understand. I'm preparing you for the future. I'm not trying to— I'm not trying to spoon-feed you everything, right? Mark down these levels yourselves and take a look at them yourselves. Yeah, so with that said, assuming that that was the bottom, we're going to mark out the 1.618 to 2.618, 3.618, 4.618, and 5.618 Fibonacci extensions. Now these levels are very key because especially 0.618, 2, and 2.618 tend to be very, very good targets that price will tend to be attracted to, especially when you go into an all-time high. So are we going to see a $100 Polkadot? Absolutely, right? This is only the 2 Fibonacci extension from all-time high to this swing low over here. That is nothing, right? If anything, Polkadot's probably going to go into, you know, the high hundreds, maybe even $150 range. Absolutely possible. And how long it's going to take to do that, in my personal humble opinion, I do think that we could see a test of $94, at least close to $100 by the end of this year. Of course, I don't mean just buy here and wait till the end of the year and you're going to have a $100 Polkadot. You know, that's not what I'm saying. Of course, you still have to do your own analysis. Of course, you still have to do your own analysis to figure out, you know, where things are at the moment. So do that. But otherwise, this is a very, very realistic target for this year. And heck, we could even see higher this year. And to touch on the higher targets such as $200 to $250, I do expect this to be a 2 to 3 year target. I don't expect this to get hit like immediately. So could Polkadot to these levels? Yeah. And if it does get to $235, right, actually before it even gets to $235, I'm probably going to have to make a new video. Because the thing about 5.618 extensions is it tends to be sort of a bull market top for at least for Bitcoin and Ethereum. No, not really even for Ethereum, but mostly for Bitcoin. So if it does get to like $230 or even just $200, I want you guys to secure most of your profit. And I know some of you guys are going to be thinking right now, Oh my God, how dare you tell me to take profit? He's telling us to sell as investors. Again, the way that you make money in the markets is by taking profit. Yeah, it's not your profit until you've taken it. And trust me when I say, if you don't take your profit, the market makers are going to take it from you. So take some profit, right? You can always redeploy when it comes lower. You don't have to, you know, hold this until Polkadot reaches $1,000 or something. Don't do that. So currently, I hope this video has been insightful to you. If it has been, it would help me so much if you could just drop a like on this video. It's a small gesture, but it really helps a lot. And while you're doing that, comment down in the comment section polkadot, or like just dot. Again, small gesture, but it really helps the YouTube algorithm out a lot. And if you guys are interested to take your game to the next level, check out the private group over here. You're going to get access to basically like all the market updates, all the coins I'm looking at, all All the trades that I'm taking as well as the trading course. We're making money every single day, so it's probably going to pay itself off pretty quickly. If this is something you're interested in, check it out. The monthly subscriptions are currently open for a limited amount of spots. I will link it in the description below. So if you just want to come in and try it out for a month, absolutely you can. But yeah, for now, I hope this video has been helpful. May the gains be with you, my friend, and peace.




