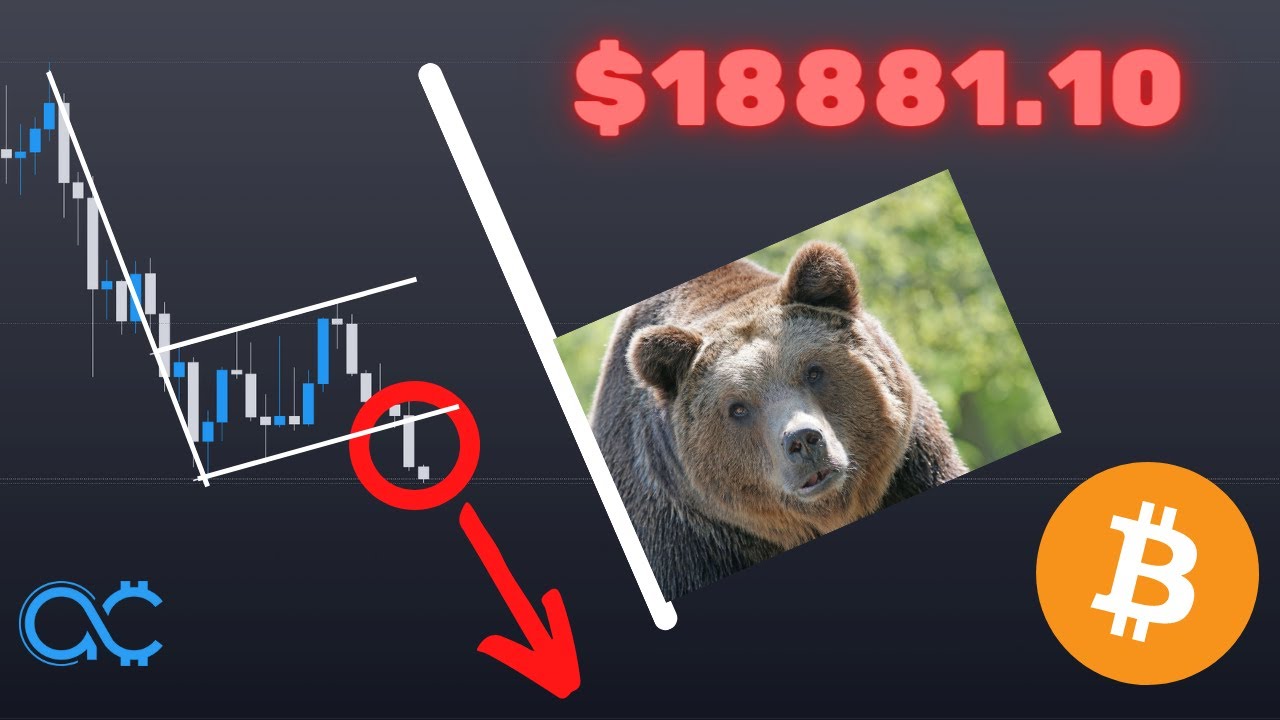
In this concise market‑update, The Art of Crypto examines the widely discussed Bitcoin bear‑flag pattern and argues that price action is driven primarily by liquidity clusters rather than chart patterns alone. He explains how market makers target common stop‑loss zones—identified by recent swing lows such as $33,800, $34,600, $29,000 and $28,750—and use stop‑loss hunts to trigger reversals. The presenter outlines a potential bear‑flag breakdown target around $18,800‑$19,000 but cautions that full flag completion is unlikely; instead, the price is expected to test the nearest major liquidity at roughly $33,000, with a secondary test around $28,000‑$29,000. He highlights weekly, daily, and hourly chart evidence of repeated “wick‑and‑reverse” behavior at these levels. Additionally, he identifies supply zones at $37,400, $40,700 and $44,000 as profit‑taking targets if the market rebounds, and references his three‑factor method for weekly directional bias. The video concludes with a reminder that traders can profit on either side by understanding liquidity dynamics and a plug for his scalping tutorial.
Chapters
What's up everybody? This is just a quick video to address this bear flag that everyone is seemingly talking about. This opinion is spreading rampant over all the major analysts and everyone's basically talking about it. So let's discuss this. Is a bear flag breakdown currently what is going on for Bitcoin at the moment? And if we do draw the flagpole of the bear flag, then it will look something like this. Which, if we extrapolate it over to this, you know, breakdown right there, then it would bring us to, give or take, $18,800, right? Or about $19,000. So is that possibility, well, possible? I would like to preface this by saying that bear flag or not, the markets move generally on liquidity. It's not about patterns or whatever. Patterns are very useful, but at the end of the day, you should base your analysis off liquidity. And when I talk about liquidity, I'm talking about previous swing lows, right? Levels like 38— like 33,800, levels like 34— sorry, this is 34,600, and levels like $29K and $28,750. So these are levels that I mentioned because they have liquidity trapped beneath the swing lows. And why is that the case? Well, you have to think of it this way. When you are a trader and you are looking into getting into a trade, most likely if let's say I place a long, say here, right at this white line here, which is quote unquote support. Let's say I place a trade there. Where would I realistically put my stop loss? If I'm gonna bet, it's gonna be below either one of these swing lows because as a trader, you're gonna be looking at those swing lows and you're gonna go like, hey, you know, price has found. Quote-unquote support at these levels for multiple times. So if I just put my stop loss underneath this support, right, quote-unquote support, then I'm going to be successful. And the market makers know this, right? The market makers are the ones that move the markets. They have data on where your stop loss is placed and etc. So that is what I mean by liquidity. When everyone places their stop loss at the same spot, when price hits that level What's going to end up happening is there's going to be a lot of market sell orders that trigger. And guess who's buying when those market sell orders trigger? Try it. It's the market makers. And immediately what they're going to do is they're going to reverse the price. I don't know how many times you've seen this, but if you watch that video that I made on Bitcoin just a few days ago when I mentioned that price was going down and I knew exactly when price was going down. So I'm just going to discuss it shortly, but if you want to figure out the 3 the main reasons that I knew price was going down from this exact point right here, then you're going to want to check out that video. It will allow you to consistently, on a week-by-week basis, identify if something's going to pump or if something's ready to dump. There are 3 factors that I use. Check out that video. But I was able, for one reason, right, I'm going to give you one reason I was able to identify that price was going down from the fact that it has taken out this liquidity right here. And I want you to visualize it this way. If you are a, say, retail trader and you think that this could be potentially resistance, right, this line at this swing high right here could be resistance. Once price breaks above this line, as a just a general retail trader, which is basically most of the market at this point, you're going to be thinking, hey, you know, price is breaking resistance, so it's time to go long. And that is exactly what the market makers want you to do, because immediately after, what they will do is they will reverse the price. The reason why they reverse the price is because they are here to trap buyers. The people who are buying here, guess who's selling to them? That's right, market makers. And why do they sell it to them? Because they want to trap them, right? If they reverse the price immediately like that, then everyone who bought up here would be trapped. They would either have to stop out their positions in a loss or keep holding until they get liquidated. In either case, they would get stopped out as well. So this is just like a basic, very fundamental rule of liquidity and the underlying thing that moves the markets. So now that you understand that, let's go back to The bear flag that a lot of people are talking about, is it possible for Bitcoin to go to $18K or $19K to play out the bear flag? And the short answer is we don't know until $28K, $750 is broken. And if I'm going to bet from my experience as like being in this market for as long as I have and seeing the things that I have seen, what I'm going to bet is bear flags don't generally tend to play out, you know, fully as much as You know, the traditional TA guys would like you to believe. What tends to happen is, you know, you just target the liquidity. Once you take out the liquidity, you reverse. So in this case, you can see that the closest points of liquidity, or rather the major points of liquidity, is right down here at $32,900, which is give or take, let's just count that as $33K. So this is also not just liquidity, but this is also a swing low. If you watch my macro analysis on Bitcoin, I said that we were potentially still bullish. And if you want to know my exact take on Bitcoin is on a macro scale and whether it is time for us to, you know, just sell everything and get out of the markets before it goes even lower, you're going to want to check out that video. Even though prices are at these levels, I'm not really panicking just yet. So this is sort of like your range at the moment, and I'm very certain you're going to wick below this range before rebounding because there is liquidity trapped beneath $32,900. And the question, right, the real question becomes, is this going to be the final level of liquidity that the market makers want to take out, or Are they perhaps targeting something lower? And when I talk about something lower, I'm talking about 29K. So right now we are on the weekly chart, and if you look on the weekly chart, you can see that there is a lot of liquidity beneath this level. And the way you determine where there is a lot of liquidity is basically by multiple swing lows. The more swing lows that you form at that similar level, right, at a similar level, means the more people are going to treat this as quote-unquote support. They're going to place a stop loss. The more people are going to place their stop loss right beneath, right, the more liquidity there is. The more money these market makers stand to make, and they're not going to pass up on easy money. So in that case, the question becomes, is the final level $29,200, or maybe even $28K, right, to wick below this before rebounding? Either way, my take is that either it's going to be $33K or either it's going to be $28K. Either way, markets move on liquidity. Once you take out the liquidity, you are going to reverse. It happens a lot. For example, right here you have liquidity. The moment you take it out, look how it reversed immediately, right? It's on the weekly chart, so it's not immediately apparent. But if, let's say, I go onto the daily chart, this will become much more clearer to you when I say that the moment you take out the liquidity there, immediately reverse, right? Trap all the buys here, stop them out before, you know, screw everyone up, basically. And same thing goes for, you know, just support as well, because if we just go on to, say, the 1-hourly chart, right, all these blue lines right here are previous swing lows. Now I want you to notice How price just very consistently, right, on every level, it wicks just beneath it before reversing, right? It tricks people to shorting here before reversing it. It tricks people to shorting here before reversing it. It tricks people to shorting here. Well, at the moment they would still be in profit, but you get my point. This happens like clockwork. And once you understand this, you sort of have a very good understanding of why the markets move the way they do. So basically, I know I just spent like 6 minutes Beating around the bush, but my opinion is that this is not a bear— I mean, this is a bear flag, but very likely won't play out, you know what I mean? There is no reason for them to take it down that low, at least without some kind of a short-term reversal or even a midterm reversal. So if you talk about a midterm reversal, then the price to watch is going to be at $37,400. The reason for that is because right now this block, this entire block here, has become a weekly block of supply, right? Supply is basically a level where you go in there, you know, there's a lot of supply, so there's a good chance that you get rejected. So if you do go back to $28K, the immediate level that you're going to want to take your profit, right, or just take some profit, it's going to be at $37K, $400K, and $40K, $700K. In fact, you could even go as far up to $44K. But either way, these 3 levels, you're going to want to keep them in mind, and you're going to want to take your profit. The reason is because This is a zone of supply. Until you break this zone of supply, you are bearish until proven otherwise. But my take is that the lowest it can go, probably just there. And I know nobody likes to see that. I do not like to see this as well. But we're traders. We're going to make money whether it goes up or down. And in the meantime, if you want to figure out if you can make money scalping the markets, then you're going to want to check out this video that I'm going to link right here. But for now, may the gains be with you, my friend. Bye-bye.