NOW Is The Time To Buy Solana, Or Is It? | Solana SOL Price Prediction and Technical Analysis 2021
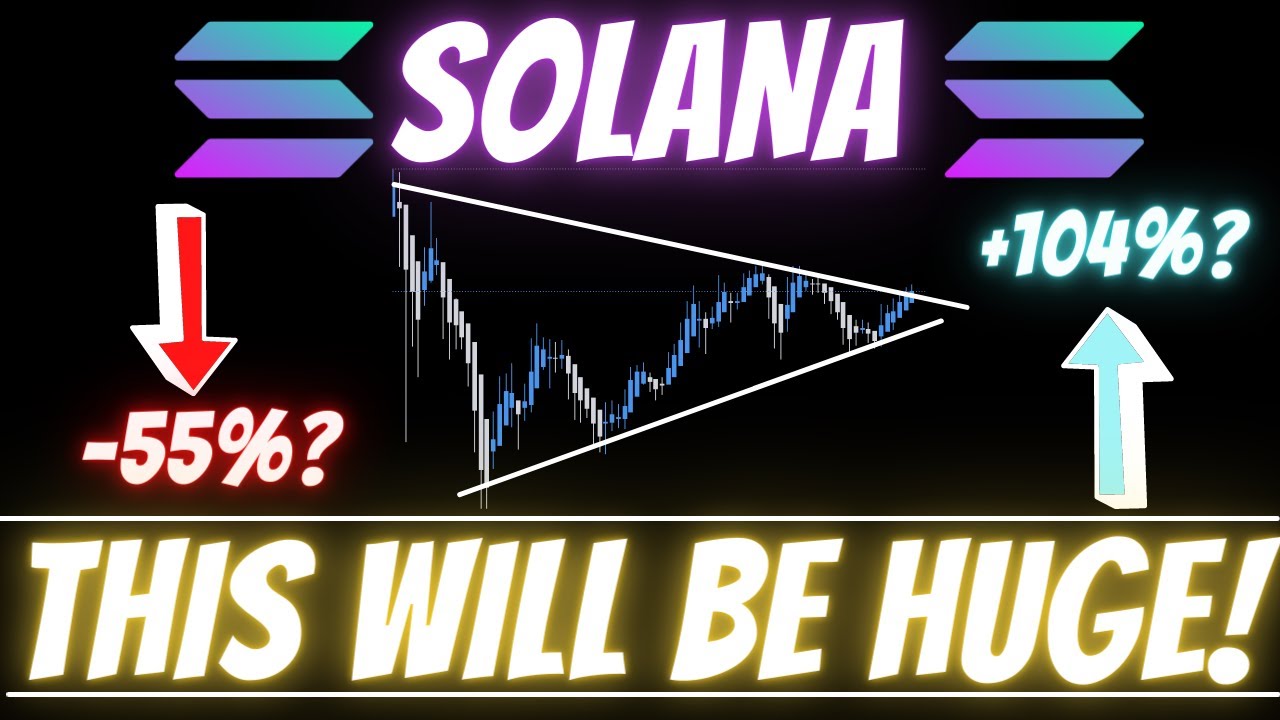
In this solo technical analysis, the host from The Art Of Crypto walks viewers through a detailed multi‑timeframe chart study of Solana (SOL). Starting with daily EMA analysis, he identifies key support zones around $22.5‑$32 and explains how Bitcoin’s current range‑top could affect SOL’s price. He then shifts to the 8‑hour and 4‑hour charts, highlighting a large triangle/falling‑wedge (bear‑pennant) formation that is poised to resolve within a few days. Using measured‑move projections and Fibonacci retracements, he derives bullish targets of roughly $63‑$74 and a bearish target near $19. The video outlines concrete trade setups: breakout entries, breakout‑and‑retest (SR‑flip) entries, and short entries, each paired with specific stop‑loss and profit‑taking levels. He emphasizes risk‑management techniques such as dollar‑cost averaging and position scaling. Throughout, he notes Bitcoin’s range‑top risk, maintains a balanced view of bullish and bearish outcomes, and concludes with a promotional pitch for a private Discord trading community offering daily trade calls, education, and a $1K‑to‑$10K challenge.
Chapters
What's up everybody, welcome back to The Art Of Crypto, the birthplace of absolutely legendary gains. In this video, let us take a look at Solana. And right now I'm spotting a really, really beautiful pattern forming on Solana. And you know, if you were interested in picking up some Solana for yourself, or perhaps you just already hold Solana and you want to know exactly what's going to happen next, whether it's going up, whether it's going down, you're going to want to watch this video to the end. So without any further ado, let's just dive right into it. Right off the bat, let's bring up the EMAs on the daily chart. And if you remember the last time, I called for Solana, right, to get— like, I called for you guys to get Solana at about 30.5. And the reasoning behind why I said, well, you could pick up Solana at this level was because it is an area where the 100 EMA on the daily chart is located. And at the moment, it seems that, you know, it has moved upwards, so we have to move that Target up to a different spot now, so that's about thirty-two dollars. So immediately, let's also mark down this level over at twenty-two point five to be a really strong level of support for Solana. And you know, if Solana gets to either one of these two levels, expect really strong support. So right now BTC is sort of at resistance right now, and you know, we're sort of in a range. And at the moment, we are at the top of the range for Bitcoin, which means that potentially we might be getting a Bitcoin dump, and. If we do get that, then you know Solana is going to dump as well. So if Solana goes down, then 100% pick up some Solana at these two levels. It's going to be a fair price to get Solana. And not only are you getting confluence from the 100 EMA, you also have you know previous support. You know over here you got previous support, previous resistance, right? You get the idea. So this level is going to be a fun level to pick up Solana at. And if we just bring our market cipher B. You can see that although money flow is confidently coming down and down and down, at the moment we are on the verge of forming a green dot. So perhaps Solana will go for one last run before momentum dies off on Solana and it needs to take a break. But nothing is confirmed until it is confirmed. At the moment, this is on the daily chart, which means it takes 24 hours at least to play out. So just take it easy for now. It's a bit too early to tell, but I will have to bring you guys onto perhaps the 8-hourly chart where I am spotting a very, very huge pattern forming on Solana right now, which is this massive, massive triangle/falling wedge. So if you just take a look at Solana right now, look at how beautiful this looks. And this is not even— I mean, technically you could consider this a bear pennant because, you know, this formed after Solana dumped. However, because we're in a bull market right now, and you know because bullish sentiment is starting to return to Bitcoin, we might see you know Solana do a nice little pump. And here's the thing about this pattern that I want you to pay attention to, which is the fact that you know we are at the apex of this pattern right now, right? We are at the tail end of this pattern right now, which means that very likely within the next about four days or so, Solana is going to be forced to make a decision no matter if it's going to be up. And right before I give you the exact entries and the ways that I would trade Solana, I want you to go and follow me on Twitter at _TheArtOfCrypto. This is where I'm sharing the latest market updates, and you are not going to want to miss out. So back to Solana. So if you just take a look at the 4-hourly money flow right now, it is very indecisive, to say the least. Over here we had, you know, confident money flow in the green. Over here we had, you know, not so confident money flow in the red. And right now We have not so confident money flow in the green. However, if we just zoom in right here, you can see that, you know, perhaps we might be going up, perhaps we might be going down. For now, it's too early to tell. Either way, you can see that, you know, money is coming back into the asset, which means potentially we are expecting a pump off of this pattern right now. And so I'm just going to mark down this level at about 42. So this level is going to mark the level of the breakout, which means if Solana gets to this point right here and, you know, it breaks above this point right here, it would mean that, you know, we're breaking out of the pattern. Potentially, if we just measure, you know, the measured move from Solana from the bottom to the top of the pattern, you can see that it will bring us right to about $63 to potentially $70, right? If I just, you know, straighten this out and, you know, if I want to, I could draw this pattern, you know, from here to here. And if we just move that measured move over here, then you can see that, yeah, it's either— we are either going to go to about $60, $63 give or take, or we're gonna go to all the way up to about $74, and I'll tell you the significance of that level soon enough. So if Solana does break above this level, how would you trade it? So firstly, the first entry would be for you to buy the breakout. So as it is breaking out, you know, you buy along with the breakout, and this is what you call, you know, breakout trading. It's pretty self-explanatory. And the second entry, which is a safer entry compared to a breakout, would be for the price to break out of this pattern, right? And then come back down to retest this level of resistance and then flip it into support. This is what you call a breakout and a retest, or an SR flip, however you want to name that. But whatever the case may be, this is a very bullish sign for Solana because, you know, nothing moves just straight up. It has to come back down to, you know, cool off a bit and before it goes back up. And the reason why this is such a safe entry, and this is my preferred entry, is because if Solana breaks out of this pattern right now, everybody who, you know, didn't get into Solana as it was breaking out will be waiting at this level right here, and potentially this level, right, give or take, from about $42.50 to $42-ish. Everybody is going to be waiting around this level, you know, because when price comes back down, you should see an immediate shoot upwards for Solana. That means that there are a lot of people waiting around this level, waiting to get in on the trade. And so if you do get that successful retest, where would be the profit-taking targets? So for that, I'm just going to draw a Fibonacci retracement from the swing top to the swing low. And you know, we can mark down the levels for the Fibonacci, right? Where would be our profit-taking targets? So as you can see right now, this is beautiful, right? This is textbook beautiful. The both the measured moves for Solana out of the pattern actually lines up with the Fibonacci, right? This smaller move right here lines up with the 1.131 level, and the bigger move lines up with the 1.414 level, which is absolutely brilliant. So you can see how beautiful this lines up right now. And the 2, right, this is the 2 Fibonacci level here. This is going to be a slightly longer-term target. And if we do break above that, then, you know, I will make another video on Solana just to let you guys know, like, hey, the entries have changed. So for now, these are going to be your profit-taking targets for Solana. And of course, right now Bitcoin, right, as previously mentioned, it is at the top of the range right now, which means that there is a very high possibility of Bitcoin, you know, dumping from here on out, which means rather than getting a breakout to the upside, we might be getting a breakout to the downside. So in this case, you know, as you know, in this channel we are grand strategists. We do not simply be overly biased towards any given direction, and we want to consider the bearish possibility as well. So in If Solana does break down from here, right? If it does break down from this pennant, which is supposedly a bear pennant, actually, this is not a this is not a bullish sign. So if we do break down from there, right now I'm on a log scale, so this might not be the prettiest. So let me change it to a linear scale, and you can see that the measured move for this breakout is close to about you know the previous low at about nineteen dollars. So if we do break down of this bull pennant, I'm sorry bear pennant, then you're going to want to look for Solana to get to about. About $19. That would be the end of the measured move. And on the way down, you can 100% look for Solana to find support at all 3 of these levels. And that is where you can pick up some Solana if you have not already. I am incredibly bullish on Solana, and you know, so are a lot of people because, you know, it's one of the strongest performing coins even during this entire dip that the market is going through right now. So if you haven't already picked up Solana, this is going to be good levels to do so. So because just now I was on a log scale, it might not have been, you know, the most accurate. So let me update that Solana measured move to the upside, and it would actually bring us up to about $63. So the rest of these levels, the 1.414, 1.618, and the 2 fib level, is just going to be longer-term targets. The measured move for Solana would be $62.6 and about $19, give or take a couple of dollars. So since we are traders in this channel, how would you trade Solana should it break to the downside? And you're going to want to look for a short at around this level right here. At like— actually, I might just go to a lower time frame and boom kaboom, right? If Solana breaks below this level right here at $37.2, then you are going to want to take a short. So the way you do this is, you know, as it breaks down, you know, you go in with everybody else and, you know, you short. And the second entry would be similarly for a bearish retest, and this is where you go in. So it's the same concept with, you know, a bullish retest and a bullish breakout, you know, just, you know, flip the concepts in the opposite direction. So the reason why this level is so significant is firstly, if Solana breaks below this level right here, you are going to break below the pattern. And secondly, on the 4-hourly right now, I don't know if you can see this purple line right here, but this is a 200-period EMA on the 4-hourly chart, which if you are a long-time follower of this channel You know that I always like to say that this level is going to act as very strong dynamic support or resistance in any trend. In this case, it's going to act as support, which means if price fails to find support at the 200 EMA and breaks downwards, when it comes back up, it's going to get rejected again, causing the bearish retest, and then the price is going to dump even more. So that these are going to be your, you know, indirectly, right, indirectly speaking, these are going to be your take profit targets. For Solana. I'm just going to draw a few more levels for you to take profits if you are going short. However, I am not going to be looking to pick up Solana at these 3 levels. This level right here, I mean, yeah, you can actually pick up Solana at all of these levels. And, you know, going back to the previous thing that I talked about Solana, because I've given you so many levels, you don't want to just, you know, if you take the short here, you don't want to close your position at $32. You're going to want to, you know, dollar cost average out. And same thing, if you take the long on Solana as it breaks out, then you are going to want to dollar cost average out of your position as well. So that would mean that let's say you went in with $1,000, then I would take 25% profits here, I'll take 25% profits here, I'll take another 25% profits here, and maybe, you know, just maybe Solana goes all the way up to $82, maybe even $100, then, you know, I'll take the rest here. So that's what you call dollar cost averaging. And pretty much no smart trader or trader who knows what they're doing ever, like, you know, gets out or gets into a position in one lump sum. So similarly, if you're buying Solana at a lower level, then you are going to want to dollar cost average as well. If you have $1,000, I would buy $100 here, $200 here, $400 here. You get the point, because nobody knows where's the exact bottom. By doing this, like, no matter how low Solana goes, you're gonna have You know, you're going to be averaging out your position. So that's how I would play Solana. And seriously, if you enjoyed this video so far, like if you feel that I have given you value, the least you can do is, you know, drop a like button. It's a very small gesture, but it really, really helps a lot. And if you, you know, enjoy the fact that I always give you such a thorough analysis, if you think that I sound like I know what I'm doing, you know, I give you the exact ways of how to trade things, then you are going to want to check out the private Discord group because over here we are literally trading profitable setups every single day, and I'm giving you guys the exact levels, the exact stop losses, and the exact take profit targets every single day. In this Discord group, we have people making absurd profits, and right now I'm doing a $1K to $10K challenge where, you know, I'm trying to grow an account from $1K to $10K. And if you're in the private Discord group, you know, you can follow along and take the exact trades that I myself am taking. There have been a lot of people in this Discord group who have literally paid off their membership in less than, you know, a couple of trades. And right now we have about 137 members. I'm gonna close this group at about 200 members, give or take, because I want to be able to dedicate focused attention to every single member in the group, and I cannot do that if the group gets too big. So right now there's only about 60 spots left, and if you pay with crypto, then you can get up to 40% off. So the instructions you can find on the website. Like, forget the chart calls, right? Forget all these calls that I'm making that are highly profitable. When you join this group, you're gonna get access to a literally like world-class education. There are people in here who have been doing stocks for years and they're still learning new things from this course right here. So guys, it's going to pay itself off. Like, it's going to be a small investment to ensure that you do not lose any more money in the markets. Like, trust me, you're going to be able to build a very good foundation here. So if you're new to crypto, I would even highly— I would even suggest this group even more for you because you're going to be able to start crypto off with the right foundations. So with that said, Solana, I have given you the exact levels and the exact ways that I would trade it. If you cannot even be bothered to mark down all of these levels on your own chart, then there is literally nothing more that I can do to help you. So please take a moment, pause this video, and mark down these levels on your own chart. And just remember that, you know, Bitcoin is at the top of the range right now, which means there is a good chance that Bitcoin's going to take a dump. So Don't be, you know, overly— I don't be taking on too much risk. And stay safe, all right, my friend? Right now I'm gonna sign off, and may the gains be with you. Peace. Peace.




