Should I buy Stellar XLM Now? | Stellar XLM Price Prediction and Technical Analysis 2021
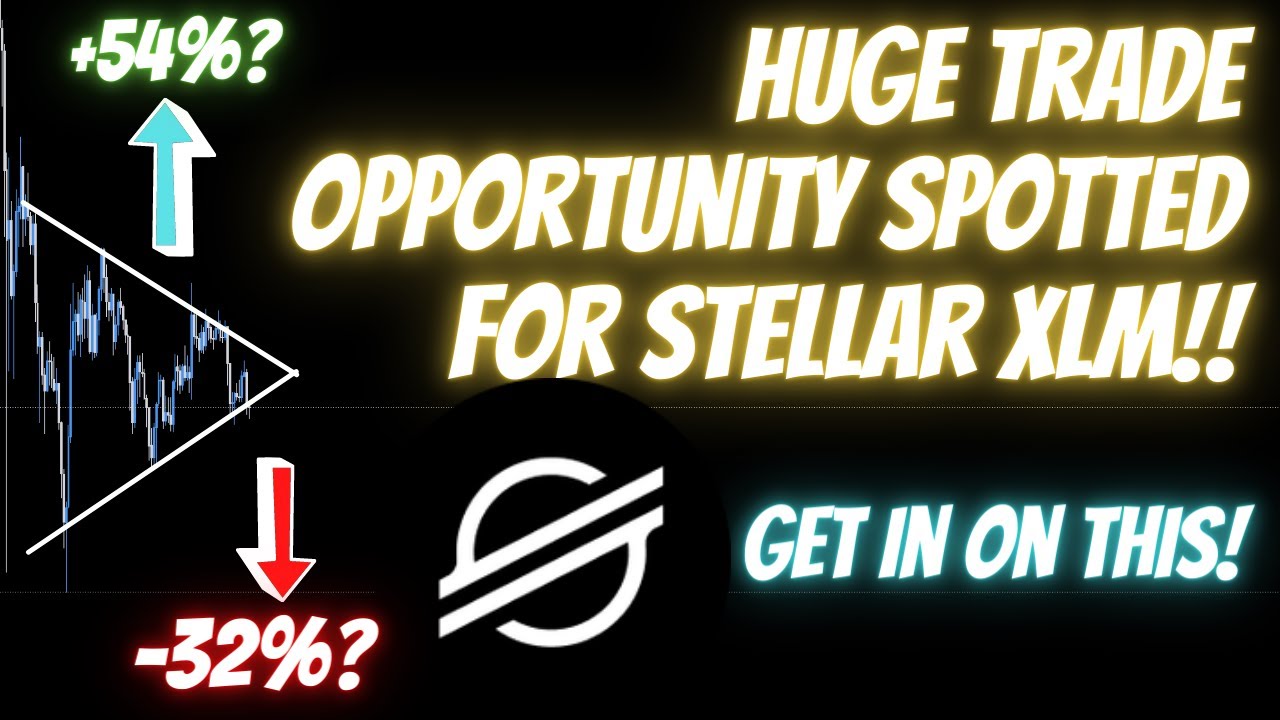
In this video, The Art of Crypto provides a detailed technical analysis of Stellar (XLM) across multiple timeframes, focusing on the daily, 8‑hour, 4‑hour, and 1‑hour charts. The presenter highlights key support and resistance levels, especially the 200‑day EMA, and uses the Market Cipher indicator to assess money flow, noting a shift toward the red. He identifies a symmetrical triangle/bear pennant pattern that he interprets as a continuation formation, explaining that a breakout could occur within 24‑48 hours. The video outlines specific bullish and bearish trade setups: bullish breakout entry around $0.411‑$0.4415 with retest strategies, profit‑taking zones based on prior support/resistance, and bearish breakdown entries near $0.378‑$0.371 with aggressive profit targets and stop‑loss management. The host also discusses risk management, position sizing, leverage usage, and a dollar‑cost averaging approach for longer‑term entries at deeper levels ($0.3, $0.21, $0.185, $0.165). Throughout, he promotes his private Discord community where he shares exact entry points and emphasizes the value of disciplined, probability‑based trading. The video concludes with a call to comment "Stellar to the moon" and an invitation to join the Discord group.
Chapters
What's up everyone, welcome back to The Art of Crypto, the birthplace of absolutely legendary gains. Today let us take a look at XLM, and right now I'm seeing a nice little pattern on XLM that could potentially bring you guys a lot of profits. So if you're interested to find out exactly what this pattern is and exactly how I would trade it with exact entries, then stick around to the end of this video and we're going to get into that. But right before we get into today's video, For those of you who might care, I wish to notify you that I just purchased a Shure SM7B microphone, which is a microphone that you see on Joe Rogan's podcast, and many other podcasts. So, let me know about your feedback in the comments section. How does this new microphone sound? Hopefully, there is a noticeable improvement. Otherwise, it would have been $500, probably wasted. But yeah, let's dive right into the video now. So XLM, let's start on the daily chart. And at the moment, we can see that XLM is currently finding support on this purple line right here, which is a 200-day exponential moving average. And if you are a longtime follower of this channel, I always like to say that the 200 EMA is always a very strong dynamic support and resistance, which means that by right, XLM should not fall below this level. However, with Bitcoin at resistance right now, and apparently it got rejected, we might even see XLM fall below this level, at which point we might want to look for the 2-day exponential moving average. We might want to look for the 2-day chart 200 EMA for support, which would be at about the 0.3 level. But I do not mean that XLM is going to fall that low, so don't panic. So if we just go on to the daily chart, we can see that if I just bring your attention to Market Cipher right now, You can see that there is a not very pretty pattern forming at the moment. Even though we have had double bottoms forming on XLM on Market Cipher, you can see that money flow happens to be crossing into the red. Now, what money flow basically is, like all it is, is an indication that money is either coming into the asset or it is leaving the asset. So in this case right now, it would appear that money is leaving XLM, but if It is a bit too early to tell. I might have to make an updated video a few days later just to see if what we see right now has played out. So now that we know that these are some of the major levels of support and resistance, let us go onto the 4-hourly chart because we need to zoom in in order to get a clearer picture of what's going on. So here is the pattern that I am seeing. Now, if you have seen this pattern before, it is actually quite common. This is what you would call a symmetrical triangle or a bear pennant. It depends on how you want to look at it, but at the moment it is definitely possible for both of these to be right at the exact same time. So how does this relate to you? So basically all you need to know about bear pennants or symmetrical triangles is that oftentimes they are what you would call continuation patterns. So they do not just appear out of nowhere, they Form in the same direction as the price chart, which means that if we get a bull pennant, the price tends to break upwards, and if we get a bear pennant, the price tends to break downwards. Now, as a trader, we have the luxury of going short, which means that we can trade either direction. But right now we're in a bull market, so let's try to look for buying opportunities. So in this instance right here, you can see that we are nearing the tail end of this. Symmetrical triangle slash bear pennant. And usually what that means is the closer you get to the apex, it means it's going to be decision time soon, which means that whether it chooses to break downwards or whether it chooses to break upwards, it is going to happen probably within the next 24 to 48 hours. I also want to bring your attention down to Market Cipher right here. So knowing this, that we have this bear pennant slash symmetrical triangle, which is usually a continuation pattern where if the price was already falling, there is a likelihood for the price to go even lower. But right now we do not panic because let's just take a look at Market Cipher. So on Market Cipher, you can indeed see that money flow is sort of going deeper into the red. And over here on this money flow wave right here, it appeared that we were coming up, but it failed, right? We got faked out and it came right back down, which is not pretty for XLM. So does that mean that we're about to break downwards? Yeah, probably, I would say so. So here's how I would trade XLM knowing that we have this pattern here. Decision time is going to be soon, and the daily chart and the 4-hourly chart are both pointing towards the red. And if we just confirm it on the 1-hourly chart, it is actually not that decisive yet on the 1-hourly chart, because oftentimes what you see with this kind of pattern right here— because we have already formed an anchor wave— oftentimes what you see, the price is going to do something like this. Okay, overall the momentum is shifting upwards, it's just that the wavelengths aren't exactly, you know, the most beautiful or the most uniform. However, when we use Market Cipher to trade, usually we respect the signals on the higher time frames much more. If we just go on to the 8-hourly chart, you can see that momentum is looking like it's shifting towards the upside. However, money flow is still deep, deep in the red right now. And again, if we just go on to the daily chart, you can see that money flow is starting to curve into the red. So Potentially, we might be getting a good short opportunity right here. So how would I trade this pattern knowing all that prior knowledge? So first off, I would mark down this level right here at about four zero point four one one to about zero point four four one five ish. So this level right here would mark a breakout of this symmetrical triangle towards the upside. Now how far that will take us, let us find out later. Or I would mark down this level right here at about 0.378. So this level right here would signify that we have broken down of this symmetrical triangle and we are potentially heading for some downside. So first of all, I would buy the breakout of this level right here. So a breakout simply means that it's breaking out of the pattern. It's pretty self-explanatory. So as the price is breaking out of this pattern with volume, okay, You need volume confirmation. Without volume, it is not a breakout, and without volume, the price is likely to just fall back into the pattern. So when the price is breaking out of this pattern with volume confirmation, I would look to buy along with the breakout. And in order to identify which levels that I would take profits at, this is going to be one level, and this is going to be another level as well. So basically what all these levels are is simply areas of Previous resistance or support, which is basically just you know major areas of of value. You know areas where price seemed to find a reaction off of right? If you just take a look over here, price finds support, support, resistance, right resistance here, support here, support here, resistance here. You get the idea. All it is are areas that the price might get rejected at. So these will be all my taking profit targets should XLM break towards the upside and continue upwards. So that was entry number one that I would trade. If I was looking at XLM. So entry number 2 is I would buy the breakout and retest of this level right here. So what is a retest? Basically all it is is when you break out of a pattern, right, and you come back down to that previous level— because nothing goes straight up— so when you come back down to that previous level right there, that is what you call a retest. And the way that you determine whether or not it is a successful retest is from the price Needing to find support at this level and bouncing upwards. Okay, so this right here would be a successful retest. All a retest tells you is that you have flipped this line of resistance into support. Okay, this is what you call an SR flip. So once you flip this level and come back down to retest it and find support there, this is an extremely safe entry because you know that the strongest group of buyers will be clustered at around this level. So you can literally just set your stop loss right below this level. And if the price were to break downwards, then you would get stopped out with a very minimal loss. And in trading, I always like to say that trading is a game of probabilities. There are no absolutes in trading. There are no guarantees in trading. So the way that you win in trading is simply by taking the higher probability trades every single time over a sustained period of time. And that is how you come out ahead as a trader. So if you buy the retest, generally it is really, really safe where the price has like an 80% chance, I believe, of bouncing towards the upside. So that is how I would buy the breakout towards the upside for XLM. Now let's discuss how we are going to short XLM, because remember, all the signs point towards the downside. So if I were to short XLM, I would 100% short the breakdown of this level right here at $0.378. Or if you want to play a little bit safer, you could buy the breakdown of this level right here at $0.371, because this level right here is acting as pretty strong support for price. As you can see, we have support here, support here, support here, support here. We even have like a short little, like tiny little rejection there. So all this means is that this level is an area of value that we are looking to enter a short at. So once the price breaks below this pattern and then comes back down and then comes back up for a bearish retest, that would be my entry. Okay, either you short this breakdown right here or you wait for this bearish retest. Okay, similarly to a bullish retest, the strongest group of buyers are going to be here. During a bearish retest, the strongest group of sellers are going to be around this area, which means chances are that price isn't going to find support. It means that chances are price is likely to find resistance here and not break above. So you can short at this level right here, and you can just ride it down to both this level and this level right here. And if the price goes even lower, about there. Now, am I saying that this short is going to play out that beautifully? Not exactly. So this is another level of support where you can potentially take profits on your XLM short. But whenever you are shorting, I just want you to keep in mind that you want to take profits rather aggressively. Actually, rather than take profits aggressively, you sort of want to move your stop loss to break even as as you hit— like, let's say once you— so let's say if you enter here, the moment the price comes back down here to find a bearish retest, I want you to move your stop loss like into here, right? If your entry was here and you move your stop loss here, that means that even if the price were to pump, then you would get stopped out in profits. Here's the thing about shorting in a bull market: it can be really, really profitable as well, but you need to know what you're doing. You need to manage your risk properly. Because when you're shorting, you are using leverage. And oftentimes you do not see me make videos about shorting because simply put, a lot of people don't know how to use leverage. A lot of people get wrecked on leverage because they do not know how to calculate their position sizing. And so if you want a full-on guide on how to calculate position sizing, if you want a full-on guide on how to use leverage effectively like the pro traders do, or if you appreciate the way that I do these exact kind of entries with exact levels given, I want you to check out the private Discord group where we are absolutely killing the market every single day, where I am giving you exact, like literally exact entries. If you take a look right here, I'm giving you exact entries and exact take profits. It is literally automatic money. Basically, if you remember the last few dips, we have been absolutely killing every dip. Now in the group, I am known as the sniper, and there is good reason for that because I am sniping the exact bottoms on a lot of these dips and we are making an absolute Now it's literally just, I give you the level, you set that level and take profits as you wish. It is literally automatic money and it does not get any simpler than that. So if you're interested in taking these kinds of entries along with me, I want you to go into the link in the description and sign up for the private Discord group. Since the last video that I posted about Cardano, we have already had more than 20 people join the group, which means there are less than 80 spots left. And mark my words, once this group fills up, I am not going to be opening this group for quite a long while because I want to be able to dedicate attention to my 100-200 members of the private Discord group. So if you want a world-class trading education along with exact entries and take profit targets, I want you to join the Discord group, link in the description. But with that said, these would be your take profit targets for an XLM short, and this would be your take profit targets for an XLM long. But what if you're looking to buy XLM? Then that is what all these support levels are going to be for. So if you want to buy XLM anywhere, you should buy at around these levels. But if I were to give you what are my best levels, I will have to bring up the VPVR indicator, which is an indicator I like to use a lot to determine how much volume is in any given area and how much support is the price going to find. So as you can see right here, at around the 0.3 level, which is where price found support previously, During the last massive dip, I'm sure you guys remember that the price actually found really strong support at this level right here. And as you can see, there is a lot of volume clustered around this area, which means that there is likely a lot of buy orders clustered around this area, which means the moment price drops into this area right here, it is likely to find a bounce. And as you can see, this area between 0.38 to about 0.32 is very volume scarce. Which means that if the price is going to fall down below this level, right, if we break down of this bear pennant/symmetrical triangle thingy, then expect the price to actually come down to, you know, $0.3 because there's just not much volume here. Granted, the way that I would buy all of these levels would be something called dollar cost averaging, which I will explain shortly. But just to mark down a few more levels where you can look to buy XLM, That would be at about 0.21, 0.185-ish, and 0.165. So those will be the absolute bottoms for XLM if it were to fall. And if it does go even lower than that, then, you know, just mark down these levels on your own chart because, guys, I'm giving you the exact entries and the exact levels where I think it would be best to buy XLM at. But if you cannot even you know, do your own due diligence and mark down these levels on your own chart, then there is absolutely nothing more that I can help you with. So the way that I would use all of these levels to my advantage would be to do something called dollar cost averaging, which basically every smart trader does. So if let's say I had $1,000 to play with, I would not enter all $1,000 at let's say $0.3 because the price might not even come down to $0.3. And then I would miss my entry altogether. So what I would do is perhaps I would take a look at the $0.32, maybe even $0.342, and I would start dollar-cost averaging. Basically, perhaps I say, you know, I enter with $100 here, and then I enter with another $100 here. I'll enter $200 at this level. And like, the lower the price goes, the larger my position size is going to be and the lower my average position is going to be. So this method prevents you from, you know, missing an entry altogether, and it prevents you from, you know, getting stuck holding bags because nobody can predict where the exact bottom is going to be. So by doing dollar cost averaging, you can at least secure yourself an entry that is decent, right? It's not going to be as good as sniping the bottom. And by the way, if you are interested in sniping the bottoms you should join the private Discord group because over here I'm giving you exact levels, right? My limit entries tend to be super duper profitable and we are absolutely killing the markets every single day with multiple, multiple wins every single day. If we just take a look at the profits page right here, boom, boom, boom, and boom, right? We are absolutely killing these markets and you are going to want to be a part of this private Discord group. About 80 spots left, so get in while you can. So guys, I'm just curious to know, for those of you that are still here, I want you to comment down in the comment section Stellar to the moon because I want to know who are the real ones that stay to the end of this video to listen to an in-depth analysis on how to trade any given direction. And if you are still staying around until this point, I am very, very sure that you are going to be very successful in crypto because you are already ahead of 99% of people who will not watch until this point because of their short attention span. So in essence, you are already putting in more work than the average person. And if you keep this up, right, just keep listening to someone who probably knows what he's talking about. And trust me, you are going to be very, very successful in the crypto markets. So with that said, may the gains be with you. If you haven't already joined the Discord group, join it and peace.




