Simple Swing Trading Strategy for Crypto | Make 50%-100% Gains Monthly | Beginner Crypto Trading
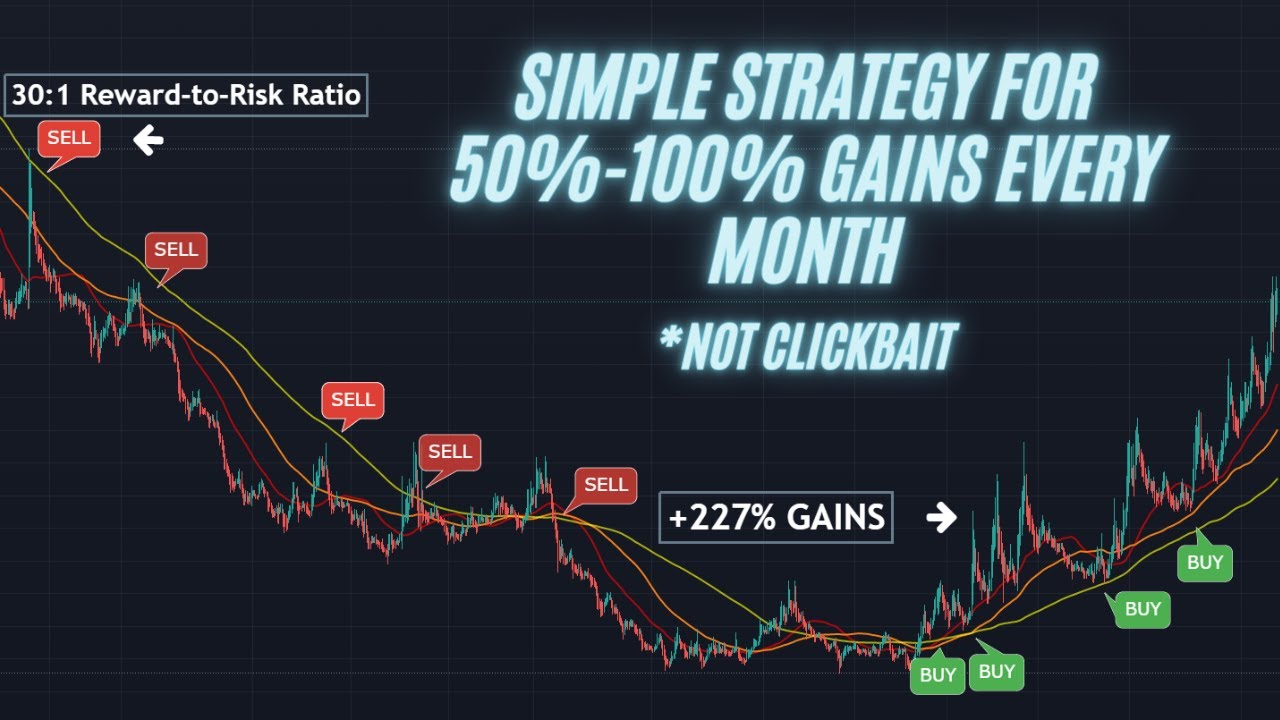
In this tutorial, The Art of Crypto presents a swing‑trading method for cryptocurrencies that aims to generate 50‑100 % returns per month. The approach relies on the TradingView platform and the CBC 5 MA indicator, focusing primarily on the 50‑period and 200‑period simple moving averages (SMAs) on a 4‑hour chart. The strategy’s core entry signal is a “golden cross” (the 50 SMA crossing above the 200 SMA) combined with the price holding above the 200 SMA; the opposite “death cross” can be used for short positions. The video walks through the indicator setup, explains the meaning of the SMAs, and outlines three exit techniques: trailing stops below the 200 SMA, trailing stops below the 50 SMA, and Fibonacci retracement targets. Multiple real‑world examples (Aeon/BTC, BAN/USDT, VIT/BTC, and a prospective AVAX trade) illustrate the entry, stop‑loss placement, and profit‑taking, highlighting risk‑to‑reward ratios that can exceed 1:5. The presenter emphasizes disciplined, non‑FOMO trading, risk management, and adaptability to both bullish and bearish markets, concluding with a call to subscribe and engage with the channel.
Chapters
Yo, what's up, what's up everybody? So I'm sure that based on the title of this video, you might be thinking clickbait, right? But I want you to bear with me. I know 50% to 100% every month sounds way too good to be true, but stay with me here, all right? Because this strategy that I'm going to talk about literally could not get any simpler, and I promise, I promise you, right, I'm not kidding, it will easily net you 50 to 100% gains every month. Now, if you stick around to the end of the video, I'm actually going to be letting you guys in on a trade that I am potentially looking at, which has the potential to get about 100% gain this month. So without any further ado, let's jump right into it. So, So this strategy is definitely not a day trading strategy. It is definitely not a scalping strategy. In fact, on this strategy, we're going to be primarily using the 4-hour timeframe. So right off the bat, you know that if you get into trades using this strategy, it's probably going to take a few days to at least weeks, right? Even months. But I promise you that 50 to 100% gains, I am not joking. All right. It is truly, truly possible. Right, so now let's dive right into the strategy. So the first thing you're going to need is obviously a TradingView account. Now if you're new to trading and you do not have a TradingView account, I highly, highly suggest you to sign up for one because it's going to be like— it's a necessary tool. Trust me, you're going to make the money right back. In fact, you don't even have to pay for this. You can use TradingView absolutely for free, and this strategy works too. If you like, you can still use this indicator that I'm about to show you even on a free account. So let's just dive right into it. So on TradingView, what you want to do is you want to open up the indicator section and you want to look for something called CBC, right? Just type in CBC. This should be the only one that pops up, right? The CBC 5 MA. Now I already have it enabled here, but I'm just going to run through it, like what is this about. So all it simply is, it is a bundle of 5 simple moving averages. Now, if you don't know what's a simple moving average, all it is is that, for example, the 50 simple moving average, it will show the average price of the last 50 candles. So this will be 1 candle, 2 candle, 3 candle— you get the point. Once you have, like, once you open up the indicator, all you simply have to do, like, for this strategy, we will not be using the 21, we will not be using the 80, Heck, you could even do without the 100, but I just keep it open for extra confirmation, you know. But primarily, we are going to be using the 50 moving average and the 200 moving average. So now that you have the indicator enabled on your TradingView, let's get into the strategy. Here's the 3 things that we're looking for. Number 1, for the 50 simple moving average to be below the 200 moving average. So in this case, for Bitcoin, that would be here right now. If you remember, the red line is the 50 moving average and the yellow line is the 200 moving average. So just to give you a little bit of an explanation as to what this means, so that you're not just jumping right in, like just say, oh, as long as the moving averages go up, then the price is going to go up as well. So simply put, The 50 SMA is a really good indicator for a healthy trend. So if you notice over here, the moment the price broke above the 50 SMA, and as long as it did not break below, like it can test it, like it can come down to test it, but as long as the price didn't break below the 50 SMA, the trend is generally very, very healthy. And the 200 SMA is more used to identify like a weak trend. Or just a general market direction. Notice how if you go way back, way back, like perhaps a year ago, in this part here, Bitcoin was sort of in a— in this part here, right? Bitcoin was sort of in a downtrend until it broke above the 200 SMA and held above it. As long as the price is above the 200 SMA, we could be considered that Bitcoin is in an uptrend. Now that you understand how the indicator works, let's get into the second thing that we're looking for, which is for the 50 SMA to go above the 200 SMA. In this case here, that would be about at this point. So what— when this happens, in trading terms, we call this the golden cross, right? And it happens when the 50 crosses the 200. It signifies a change in direction. So notice how over here, when the price broke below the 50 SMA and it failed to close above and hold above the 50 SMA, we went into a downtrend almost, right? Downtrend. So what the golden cross simply means that we are shifting from a downtrend into an uptrend. So notice how the moment the price breaks above the 50 and holds above the 50, Boom, uptrend. And now we look for the third thing, which is for the price to hold above the 200 SMA. So in this instance here, the moment the 50 SMA crossed above the 200 SMA, and as long as it does not fall back down— so if the 50 falls below the 20, uh, the 200, that would be what we call a death cross, which doesn't sound good, does it? So once the price breaks above the 50 and manages to hold above the 50, then that would be your entry over here. This would, this would've been your entry. Notice how the moment that happened, we went all the way up here. If you would've entered here, all the way up here, you would be up like 57% right now. Now I know this happened over the course of 60 days, which is not the 50% a month that I promised you. But this is Bitcoin we're looking at. Bitcoin has a really, really large market cap, so it will not move as easily. So I'm going to give you a few examples of this strategy in action and some trades that I've personally taken and have been up huge, right? So let's jump right into the other examples. All right, so let's take a look at the first example, which is Aeon Bitcoin. Now over here, remember the 3 things that we're looking for: price to be— for the 50 SMA to be below the 200 SMA, and then for the 50 to cross, and the price to cross above the 200 SMA and hold. So this would have been your entry number 1, but, um, sadly I was not looking at Aeon Bitcoin when this happened, so I did not get in. And once it did break above Once it did pump like crazy, like absolutely crazy, like this thing went up 125% in half a month. Now I didn't get in on this because no FOMO, right? FOMO is seriously the number one reason that a lot of new traders get absolutely wrecked in crypto. So no FOMO, right? There's like thousands of coins that you can look at and there's gonna be hundreds of opportunities every day. So you don't have to rush. You don't have to take a trade if things are not yet in your favor. So when I did enter was over here, when the price came back down to retest the 200 SMA. Now remember, in any kind of a trend, as long as the price is above the 200 SMA, usually it tends to hold, right? It tends to hold pretty strongly. Because this is like, honestly, if any coin breaks below the 200 SMA on the 4-hourly, you pretty much know that it's like, it's gonna be in a downtrend right now. If you look here, watch the moment the price breaks below the 200 SMA and fails to break above it, man, this would be downtrend prime. Right, see over here it comes to retest but fails, right? Downtrend, strong downtrend, downtrend, downtrend, downtrend, downtrend, downtrend until over here, boom, golden cross, and we are now in an uptrend. So back to the example, right? This is where I entered and I am still in the trade in fact, and I will probably ride this guy to, I don't know, but at the moment in just 24 days I'm already up by 132%. Which is, which is right up there with the 50 to 100% that I promised you every month, right? So before we get into any other examples, we have to talk about like exit strategies. Like when do you take profits on this strategy? And the first method is to simply like over here, when you would've entered at the test of the 200 SMA, then you could have put your stop loss like right below. Like, your stop loss could have been like here, right? Because if the price breaks below the 200 SMA, then you know the uptrend is ending, right? It's gone, done, we're done. So what you can do is you can trail your stop loss. So say from this, from my entry, the 200 SMA has since gone up by a substantial amount. So what I can do is I can simply move my stop loss As the SMA goes up, say maybe my stop loss is here, and eventually when it reaches here, I'll just move it to here. I'll move it to here, move it here, move it here. You get the point. So that's method number one of exiting. And the second method of exiting is Fib levels, right? Fibonacci retracement levels. So if you go over to TradingView on the left side here, right over here, Fib retracement. This is what you want to use. If you need me to make a video on how to draw Fib retracements, I would gladly do so, but just let me know. So what you do is from the swing low. So notice how this move began from here to here, right? This is one swing. So I will go from swing top to swing low, and I would have my levels. So this was my entry, which as you can see is right on a Fib level. So I could take profit like. At the 0.5, I could take profit here. I could take profit here. Oh no, this is not a fib level. I could take profit here, here, here, here, and here. Now actually, now that I look at this, I should have set a take profit at this level because 1.618 is a really, really strong zone of resistance. But whatever, right? Profits are profits. Again, this goes to show how simple this strategy is. Like you can literally set it. And forget it. And that's what I did, basically. So the 3rd and final take profit strategy that you could use is to trail your stop loss below the 50 moving average. So this, in this case, this would be more of an aggressive take profit strategy, cuz you tend to get stopped out a bit early during the trend. So for example, like this was my entry. Once it broke above the 50 moving average, I would have trailed my stop loss like here, here, here, here, here, right? But in this case here, the price actually came down and I would have got stopped out of the trade and I would have missed this move right here. So if you don't want that to happen, I mean, it's different take profit strategies, right? One is more aggressive than the other. So it depends on what is your trading style, right? Are you gonna hold this for the long term or do you wanna like get in and out of a coin in a few days? It depends. You decide that for yourself. But those are the 3 profit-taking strategies. And just to recap, number 1, trail below the 200. Number 2, trail below the 50. And number 3, Fib retracement levels. So now let's just— I'm just going to give you real quick a couple of really quick examples. So this is BAN/USDT. Notice here, price breaks below 200. Death cross happened, which is when the 50 crosses below the 200. Price tries to break above the 200, fails, fails, and this time it succeeds. And here is the key part: it manages to hold above the 200 moving average, which is prime entry signal. So over here, you would have rode it up and beautiful. Right now, the now this strategy, like right now we're in a bull market, right? So generally, you tend to want to go long. But if say you wanted to go short. The this strategy works for shorting as well. You it's just like vice versa, right? Instead of looking for the golden cross, you will be looking for a death cross. So that will be happen that that would happen over here. So notice how price at 50 crosses below the 200. Price tries to break above the 200 but fails, right? Remember, as long as the price is below the 200, the 200 tends to act as really really strong. Either support or resistance. So once you got confirmation that the price failed to break above the 200 here, that could have been your short entry. So that could have been your short entry. You get the point, right? You short, you rode it all the way down here, take profit over here. Same thing, short, boom, short, boom, right? It's, um, it works in a downtrend as well, but in a bull market, the price tends to have a bias towards going to the upside a little bit more. And another example would be another example would be VIT BTC, I believe. So I made this call to my group a while back. But basically, notice here price breaks above, right? Fifty SMA goes up above the two hundred. Price breaks above the two hundred and holds. This would be your entry right here. And look what happens immediately after. Boom! Ninety five percent. max gains if you would've taken profit there in 18 days. So again, this ties in 50% to 100% every month. I kid you not. This strategy, if you find entries like this, go in, you will not regret it because these are really safe trades, right? The risk to reward ratio is bonkers. Say this would've been your entry, right? Right here. Your stop loss would've been below the 200 SMA. From here to here, this would've been your risk. This is how much you're risking and this is how much you are gaining, right? The risk to reward is ridiculous. So try the strategy out. Let me know if it works, right? Let me know in the comments if this works for you. I would love to hear how you guys find success with this strategy. So simple but so effective. All right, and now just to leave you guys off with AVAX, right? This is a trade that I'm looking at right now. So notice over here, price breaks below the 200, um, tests it, fails, tests it, fails, right? Like over here. It came up, but it didn't manage to hold. And over here, right, 50 moving average about to cross above the 200 moving average. Price is going up similarly as well. So I wouldn't enter now, but I would definitely be looking for an entry because if this crosses up, then man, we could be seeing $60 AVAX again. And this is what's beautiful about this setup. If you guys know anything about technical analysis, You know that this is sort of looking like accumulation, right? Where the price is doing nothing slash a rounded bottom. So this is what I'm expecting will happen. So just keep an just keep a look out, right? Because if it really breaks above, then we are looking at a very strong uptrend, at least for the next I don't know month. Oh, and the bonus side of this trade is that in the month of April, AVAX has a lot of news. So I'll try, I would look out for an entry, and if you guys do get in, you're welcome for the gains. Now, if you enjoyed this video and you want more strategy videos like this, drop me a comment, let me know. But most importantly, I want you to press the subscribe button, press the like button, and press the notification bell button, because in this channel, we are going to be talking way more about crypto investing and crypto trading. I'm going to try to get you guys proficient in trading as soon as possible, and if you're interested in videos like this to come, stay tuned. All right, and with that, may the gains be with you.




