Solana’s Bottom Might Already Be In… Or Is It? #SOL Long Term Analysis
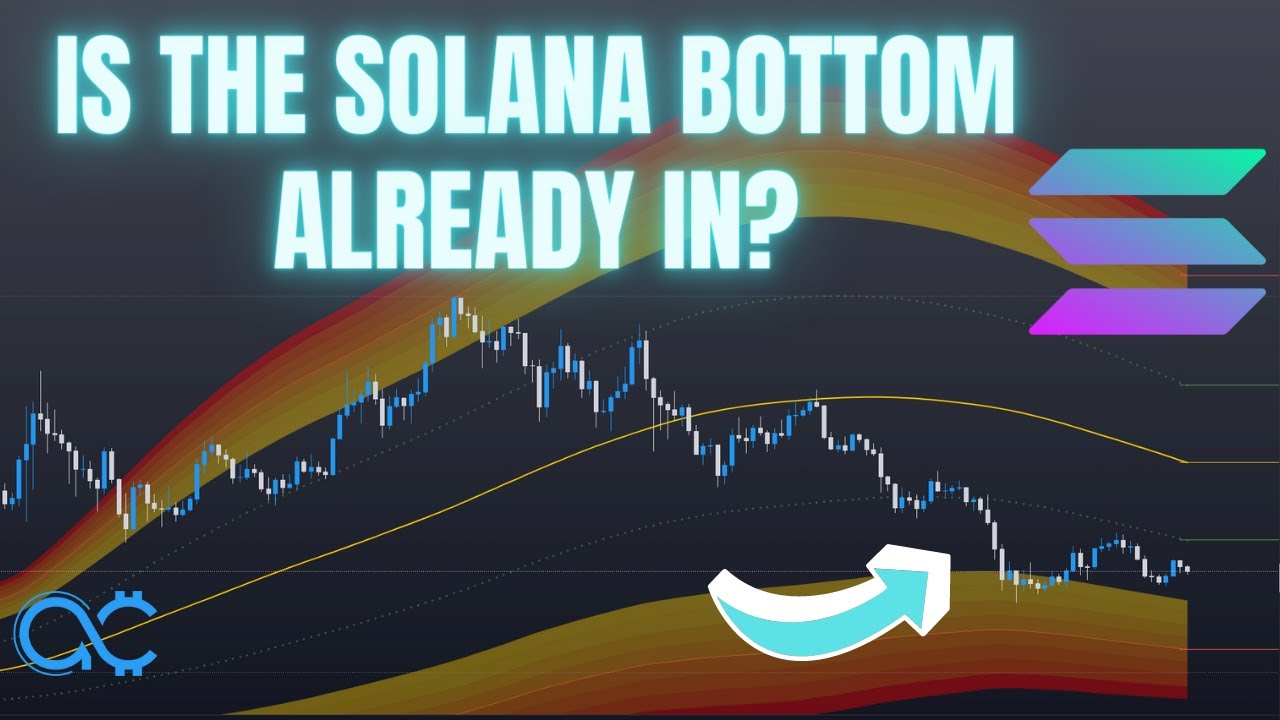
In this solo, long‑form video the creator (The Art of Crypto) delivers a multi‑timeframe technical analysis of Solana (SOL). He begins by framing the piece as a long‑term outlook, promising to identify the likely bottom, short‑term profit‑taking zones, and longer‑term upside targets. The core analytical framework relies on order‑block theory, volume‑profile (VPVR) analysis, mean‑reversion channels, and liquidity concepts such as equal lows/highs. He cites specific price zones: a near‑term bottom around $82 and $67, a deeper support band between $45‑$37 (practically $47‑$38), and a bear‑market floor between $20‑$12.5. Short‑term resistance is mapped at $110 and $133‑$142, a mid‑term target at $200 derived via Fibonacci retracement, and long‑term extensions at roughly $370, $434, $545 with speculative possibilities up to $900‑$1,000. Throughout, he emphasizes market‑maker driven liquidity dynamics, warns about potential bearish scenarios, and concludes with community calls to action (Discord subscription, Twitter follow) and teasers for upcoming analyses on Chainlink and Polkadot.
Chapters
What's up everybody, this video is going to be more of a long-term analysis of Solana because it has been very underperforming as of late. And in this video, we are going to try to figure out, you know, exactly where the bottom of Solana is going to be, or is the bottom already in, as well as give you some short-term targets as well as some long-term targets. For Solana and where I think it could go. So before I get started, this is going to be a series of a few videos that I'm going to be recording back to back. So after you finish this video, head over to my channel and see, and, you know, stay tuned for a couple other, you know, coins that I'm gonna do. I'm going to be doing one on Chainlink, and I'm definitely going to be doing one on Polkadot as well. So if you're interested to find out, you know, the best areas for you to buy these coins at, look out for them on my channel. So to dive right in, this is going to be again a long-term analysis, so a lot of things can happen in between, right? But in here, we're just trying to figure out where is the best place to buy and exactly, you know, where you might want to take profit and the most likely take profit targets. So in between, you know, you could get ups and downs and ups and downs, but ultimately we want the trajectory to be, you know, to where we want to go. So before you start complaining about, oh, where's Where's another Solana update? Oh, where's another Chainlink update? Yeah, I'm setting the premise of this video right now. This is a long-term analysis, okay? So to kick things off, firstly, I talked about $82 back then about being a potential bottom, and indeed we did get the bottom. And to explain why this was the bottom, you have to understand the theory of order blocks. So an order block is basically just, you know, a zone of— yeah, just call it a zone of demand where after the market makers take the price up all the way back to here, they need a way to recoup their positions, right? They need to rebalance their positions. And what do I mean by that? Basically, the markets are moved by market makers, right? They are the ones who price things, assets, wherever they want to, right? Or wherever the liquidity is. So back then, this was not caused by quote unquote selling pressure or like buying pressure from retail. Is caused by the institutional traders and their algorithms repricing things higher. So the thing about market makers is that they are not in the trade to make you or to allow you to win. They are in the trade to make money for themselves. So whenever you win a trade, they have to pay you out of their own pockets. When you lose a trade, you're paying them with your own money. So basically, anyone who went long throughout any stretch over here, right, especially anytime here, would have gotten a free ride to a new Solana all-time high. I want you to picture it this way, right? Notice how there is zero price action, zero price action from this point to that point, right? So anybody who went long in between this gap right here would have gotten a free ride to massive gains. And of course, you might be thinking, why does this matter? It matters because market makers have to take their positions, you know, it has to reprice the price back down to fill in the imbalance. So that they can, you know, close their positions that they took over here, right? That's just basically how it works. So this order block gives us a very reasonable area, a very solid area of where things might return back to. And that's why I love order blocks so much, because after an imbalance such as this, right, you get an imbalance, price comes back down into the order block, fill it in before continuing the trend. Same thing here, you have imbalance here, that's an order block, price returns very close to the order block. Very close, but just bounces. But you get the premise of this. So this is an order block that hasn't been filled for very long. Recently, we have came back down to fill it. So would this constitute a bottom? That's what we're trying to figure out. So firstly, I'm going to say this right now: that the immediate short term for Solana does not look bullish at all. But if you do go back to 82, and more importantly, you're going to want to note down this level right here at 67. If you do go back to any one of these levels. I do think that is going to be very close to the bottom. And even if it's not the bottom, it is going to provide you a very solid area to, you know, just make a purchase, right? Because ultimately nobody knows exactly where the bottom is going to come in. I might make this video now, but in, you know, a couple months, some market conditions like inflation, maybe the rate hikes are higher than expected. There's so many factors that can affect this. So Eventually, in two to three months' time, you know market conditions might have changed, and maybe you're going to start going down from here, right below sixty-seven. So we're also going to discuss what happens if you do go lower, right? So before we talk about that though, if this video has been helpful to you so far in any way, shape, or form, it would help me a lot if you could just drop a like button. Small gesture really helps a lot. So in order to figure out exactly, you know where might this Alana bottom come in. In case you do go lower, right, we're going to have to bring up a couple of indicators. First one is going to be VPVR. This will give us like very solid areas where— notice how there is not much volume in any of these places compared to down here, right? So there is a huge amount of volume at this area, which indicates that if the price were to return back to that area, it is likely going to be finding very, very strong support. So that level is going to be between 45 37, right? 45 to 37. I would go just a tiny bit above to put it at 46, for example, right? Or 47. Because if you time— a lot of the time, especially when it comes to any calls that I might be making in a private Discord group, I have a tendency to always, you know, be too accurate with my entries. And, you know, I end up not getting the position filled at all. So you don't want that to happen. So we're going to go with 47 here. To 37.5, give or take, right? Or 38. Do it however you like to. This area is like has a surplus, absolute surplus of volume. So if you do get back here, I'm expecting really strong support from this area. Now the second indicator that we're going to pull up is going to be the mean reversion channels. So according to this, you could see that we are already like we have already hit the bottom because I don't think in the entirety of Solana's existence we've only hit The mean reversion bottom. I mean, we're not going to count this because like it just started its journey. So, but you know, if you want to count this, that is the only other time that you've hit, you know, the bottom of the mean reversion. And as of the moment, this is oftentimes, especially when you're using mean reversion channels on the daily chart or like some kind of higher time frame, it gives you a very good solid area where you might find the bottom. So according to this, If you do come back to 82 or 66, I do think that's going to be very close to the bottom, right? I'm not expect— I'm fully not expecting 47 or 38 to get hit, fully not expecting that to happen. But if it does, you guys know where to look out for. So that's going to be the ideal levels to get Solana. Now I cannot end this video without first talking about one last thing. What if you fall right through the mean reversion, right? That is very unlikely, super unlikely. If that happens, you are guaranteed in some kind of bear market, like very heavy bear market. But I don't want you guys to get discouraged here because bear markets provide you a very solid— it's where generational wealth is made, right? It's not here, right? It's not here. You make really good money, especially if you just happen to be lucky and catch the start of the trend. But the most solid, consistent way that money or generational wealth has been created is through bear markets because the asset is highly undervalued. So you're going to want to take that opportunity to stock up on that asset before it goes for another 20x, 30x, 50x run. So the bear market bottom for Solana, in my opinion, is going to come in at around $20 to $12.50. I know this is really hard to wrap your mind around because if it hits $22, it will have been over a 90% drop from all-time highs. And if it hits $12, that's going to be more than a 95% drop from all-time highs. So yeah, 95%. I know that makes zero sense to all of you guys right now, and I am not expecting these levels to get hit. Just painting the picture that if you were to return back to these areas, that's going to be the bear market low. And I'll give you a couple reasons. I mean, not a couple reasons, but I'll give you the reason why I think that is the case. Firstly, you have 1, 2, 3, 4 equal lows over here. Which indicates that there is a surplus of liquidity over here. Which means, remember when I said that the market runs on liquidity? How the market makers like to price things according to liquidity? Same thing. They always wick just a tiny bit above previous highs such as this, bring it back down, trap buyers— sorry, trap the buyers. Yeah, trap the buyers, stop out the shorts, and then come back down. You know, stuff like that, right? The market runs on liquidity. And whenever you see equal lows like this, 1, 2, 3, 4, Expect them to get hit. And basically, when you see these equal lows, when you see there is liquidity to be run such as this, right? If you zoom back in, like if you zoom back out, right? There's one, two, three equal lows. This is all on the daily chart, right? In fact, this looks a lot like ADA is looking like at the moment. I'll make a separate video for ADA. But you know, could we see something like this happen? Who knows? We'll find out. But basically, in the event that you do come back down to take out the liquidity here. It would mean that the buy side liquid— sorry, sell side liquidity. Basically what that means is if you do come back down here, uh, if you went long, your stop loss would be a sell order. So this is why, hence, you know, sell side liquidity. You come back down to this area, that's going to be sell side liquidity. Once you take it out, you take this part out, there is going to be very little sell side liquidity remaining. And I'm not saying that it's going to come back down to this area, but I hope you can apply this concept Elsewhere to your trading. This works both on the daily chart, the four-hourly, the one-hourly, the fifteen-minute—you name it. When whenever you see equal lows, expect them to get run. Okay? Same thing goes for equal highs. So when these two levels are run, I do not see any more liquidity that you can take. In fact, there is just a lot of institutional investors and involvement in Solana. So I don't even think that just you know especially when it comes to institutional investors. And I'm talking about investors, I'm not talking about traders. Like, you know, they have so much venture capital funding that, you know, I highly doubt Solana is going to get back to there. You know, there's going to be like a base price for Solana just based on how much of the supply has been already invested by, you know, by early investors. So could we see this? Maybe not. But if you do, I mean, no, could you see this? Absolutely not. Very low chance, but if you do see it, you know what to do. So now let's get into some short-term targets for Solana, and then we're going to talk about some long-term targets. So firstly, let's try to mark out some key areas of resistance for Solana. And to do that, I'm going to go back onto the daily chart. And that blue box right there, that's a zone of supply, right? So if you get back there, it's going to provide a lot of support— sorry, a lot of resistance. So that's going to be a very logical area where you might want to take some profit. So that's going to be the first one, this is going to be the second one, that's the third one, and then the rest is just all-time highs. So you need— you have 3 zones that you need to overcome before you can make a push for another all-time high. If you break above this one right here, then very likely you're going to go for a new all-time high. Of course, again, it's not going to just go straight up. What's likely going to happen, you're going to come back up here Notice how you have equal highs over here. You'll take out the liquidity there, come back down, you know, spend another few months coming back down before the ultimate, you know, push. Because remember, the institutions need to rebalance their positions, right? They need to recoup their losses on the way up, for example. So market runs on liquidity. So understand this. So basically what I'm trying to get here is short-term targets. And when I say short-term, I'm talking about like the next 3 months. And when I say long term, I'm talking about like the next year or two or three years. So just get that through your head. This is a long term analysis, right? Don't be expecting me to give you targets that's going to happen in like the next few days where oh, Solana is going to go to 150. That's a 50% gain in like a week. So first target. Actually, I'll give you like a really short term target. This block right here, very key resistance at 110. If you do get back here, expect it to hold some. Expect it to act as resistance. For you to take a short-term trade down before flipping long and going into the next zone of resistance. But ideally, even this wouldn't be considered like a short— like, this wouldn't even be considered like a midterm target. This is more of a short-term target where I expect this level to get hit within the next couple months, right? So $133— in fact, the next month or two, right? Within 60 days. So that's going to be, you know, one key level, which is $133 to about 142, give or take. And remember, right now I'm giving you the exact levels that I'm going to be looking at. So if you haven't, you know, if you're not marking these down on your own chart, you know, there's nothing more that I can do for you. So those are the short-term targets. Now let's talk about midterm, right? Midterm, where do— where can you expect Solana to go? So midterm target is definitely going to be 200. Now whenever you see price, you know, returning back to an uptrend, that is a signal that order flow has changed and the institutions and the market makers are taking price up to attack the buy side liquidity. So notice how this entire run down here has been to attack sell side liquidity primarily, right, which means sell stops. Eventually you're going to run out of sell stops to target. Maybe their target has already been achieved at certain levels. After that happens, you're going to go target the buy side liquidity. So Immediately in the immediate midterm, this high right here is going to be the first target in the midterm because that is the only real area. I mean, this is going to be the short-term high, right? But that's going to be the midterm high. So that level right there at 200 is going to be the first midterm target. Once you take out 200, then we have to figure out, you know, what's next. In my opinion, it's going to reverse, go through another few months of, uh, just chop before ultimately going back up. Now How do you determine this one? You determine this one by using the same concept that I taught just now, which is order blocks. And not just order blocks, but assuming that you do, you know, you just go straight, assuming something like— whoops, let me just draw that out. Assuming something like this happens, you know, forgive my, uh, forgive my drawing, but I'm just trying to show you the concept here, right? You want to draw a fib from the start of the move right there, assuming that's the start of the move, to the top of the move, right, at 200, right? 200 is over there. So ignore this, ignore this part here. So draw it to 200, right? That's assuming that's the high. You know, you come back down, you're going to want to look for 0.618 or 0.705 in order to get your entry, right? That's how I would do it. Very likely you're going to have a bullish order block around this area, and that's how you know that, you know, things add up. So that's going to be how you determine that. And now for the long-term targets for Solana, for that we are going to need to use Fibonacci. Flips again, but this time I'm going to draw from that swing. Well, there, there is just a slight bit of an issue if you use this method because, uh, right now we don't know that $82 is the exact bottom yet. But assuming that it is, right, some long-term targets for Solana is definitely going to be $370, $434, $436-ish, $545, and usually $5.618 tends to be like the absolute top. So could we see a $1,000 Solana? I don't know, but I'm going to bank on at least— I'm at least going to bank on a $550 Solana, right? A 2.618 extension doesn't seem too far out of the realm of possibility, especially in, you know, a couple of years when the crypto markets can be exponentially more, you know, could have exponentially more value and money inside it. And that's the way that— that's the direction that we're heading in anyways. So, you know, could it be— would it be odd to expect a $900, a $700, or a $1,000 Solana? I think not. So could you get a 10x on Solana still right now? Yeah, but it's gonna take you some time. Let's just put it that way. I'm not expecting this to get hit in like the next 2 to 3 years. So as long as you have that kind of a timeline in mind, you know, that's all you need to know. So if this video has been helpful to you so far, I want you to comment down in the comment section, SOL, right? If you appreciate this kind of long-term analysis, let me know as well. I'll try to do more of these for many, many different coins. But you know, for now, if you want to get more of these, uh, if you want to get more value out of the videos and you want to level up your trading game, check out the private Discord group. Monthly subscriptions are currently open right now, uh, limited spots though. So if you just want to come in and try it out, get the latest market updates, follow along with All the trades that I might be taking, as well as get access to the trading course. Check it out. If you don't, don't do it. But if you do, I'll see you inside. And if you want to get the latest market updates, follow me on Twitter at underscore the art of crypto. With that said, watch out for the next video. I'm going to do Chainlink or Polkadot next, so stay tuned. May the gains be with you, my friend, and peace.




