The Next Move For Bitcoin + Is Q4 Still Gonna Be Bullish?
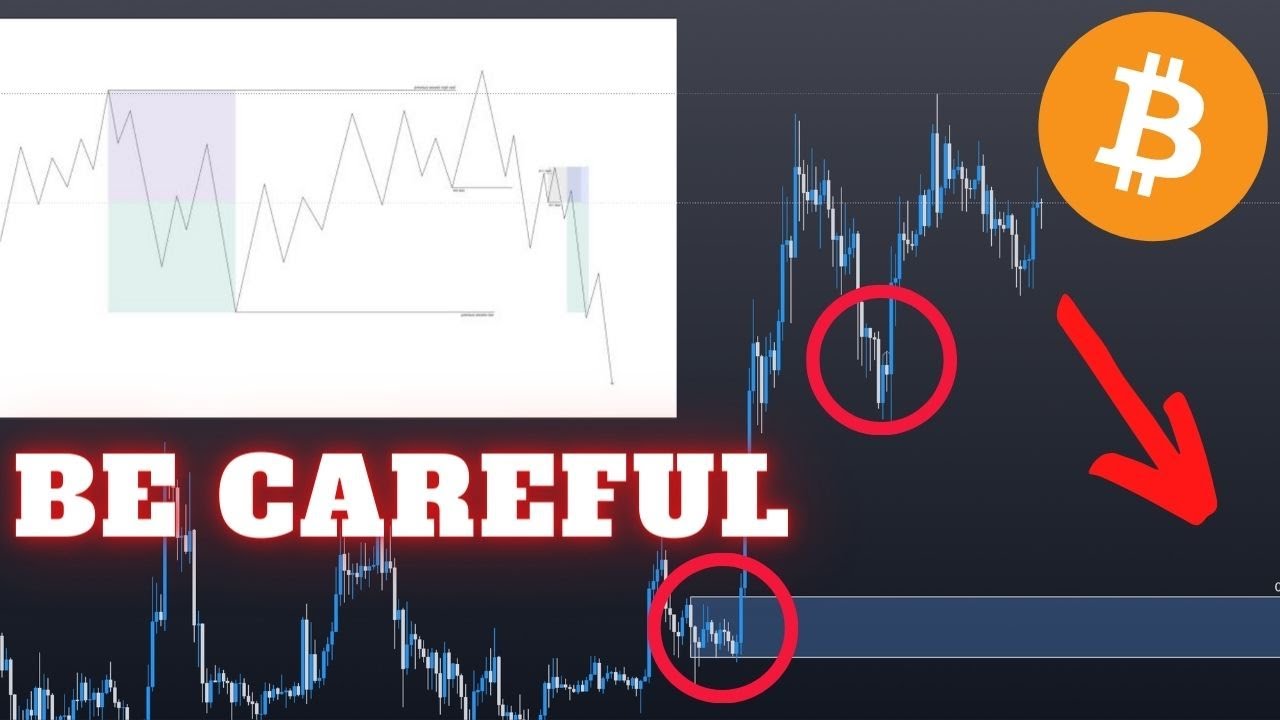
In this solo market commentary, the creator from The Art Of Crypto walks through multi‑timeframe technical analysis of Bitcoin, focusing on a 1‑hour fair‑value‑gap bounce, 4‑hour bullish order block, and daily swing dynamics. He explains how to use Fibonacci retracements (including the golden pocket) to locate entry zones, and proposes a short‑trade setup around $20,800 with a 30R risk‑to‑reward profile targeting $19,400. The video delves into liquidity concepts—sell‑side liquidity, market‑maker stop‑loss hunting, and the premium‑discount theory that algorithms use to keep price near a mid‑range equilibrium. He links Bitcoin’s price to the US Dollar Index (DXY), illustrating an inverse relationship and projecting that a DXY pullback to around 107 could lift Bitcoin toward $25k. The upcoming FOMC meeting is highlighted as a macro catalyst that could swing Bitcoin sharply either way, prompting a recommendation to stay flat until key price levels are hit or the meeting concludes. Throughout, he stresses strategic thinking, one‑step‑ahead planning, and high R‑value trades, while also promoting his private Discord community and a paid mastermind program for serious traders.
Chapters
What's up? So last week I made 2 videos on Bitcoin. The first one was predicting the bottom here, and I told you guys to buy once it takes out this liquidity over here. That's exactly what you got. In the middle of the week, I made another video saying that the next time that you go above $21K, you're gonna wanna sell off your Bitcoin and close out your long positions. This is exactly what we're getting right now. Now, if you wanna figure out the next move for Bitcoin, stick around. I'm also going to talk about a potential entry that you can use to make some money, just like over here and over here. I'm also gonna talk a little bit about the DXY because that is very significant. And then we're gonna just discuss a little bit about the FOMC meeting that is going to be happening later this week. So without any further ado, let's just dive right into it. First off, I want to bring your attention to the 1-hourly chart, and I want you to take a look at this fair value gap over here. This is going to be an opportunity for you to potentially get into a sort of relief bounce, right? It's not gonna be huge, but it's gonna be something. If you simply draw a fib from that low over there to that high, you can see that this lands somewhere within the golden pocket. So this is going to be an area where you're gonna be interested in getting into a long. However, I do not think that this is going to be the best entry for a swing long. I'm not saying that you're gonna get in here and just, you know, pump all the way to $22K. Absolutely not what I'm saying. This is just going to be the relief. Now, the actual level that I'm watching is at about $1,950. Why is that? Let's go onto the 4-hourly chart so that I can visualize this a little bit clearer for you. So this is what is known as a bullish order block, or rather, some people would like to understand this as a demand zone. Basically, this is a level where when price returns here, this is where the smart money is accumulating. And if you're going to find support anywhere, you're gonna find it here. Now, this is also being backed up by the fact that if you draw a fib from swing low to swing high over here, and the reason I draw it from this swing low to that swing high is because if you look at it, like if you look at a move like that, if I go onto the daily chart, you can see that this move from basically like $18,500 all the way up to $21K basically started from here. Until there. This is how you use Fibs. Now here's a pro tip. Fibs are very fractal. For example, within this range to this range, you can draw another Fib from, let's say, this range to this range to determine where price is gonna pull back to. For example, you get in here and then it pumps to here, then you can draw another Fib from swing low to swing high to figure out pullback, you know, stuff like that. You can use Fibs in basically any scenario. And you might be wondering, hey, are Fibs actually a technical indicator? And the answer to that is actually no. The reason why Fibs work is simply because the algorithms that are moving the markets, which basically account for 80% of daily trading volume, volume are programmed to move the markets using the Fibs as a guideline. And that's why this works. That's why you'll find that it is no coincidence that all the areas of value happens to land at the golden pocket of the Fib and stuff like that. Well, that's just a free bit of value over there. Now you can see that this pattern right here lines up exactly with this pattern right here, where you get a wick above this previous high just to clear out the liquidity before you show the true move. Now, like, even Before Bitcoin hit this point over here, I was already like, hey, you know, I saw it coming. It's going to happen. How did I know that? Well, it will be very helpful for you to think about the market in terms of liquidity, right? Where are the levels with the highest liquidity? For example, how did I predict the bottom over here? Well, it's because if I go onto the 1-hourly chart, there is a previous swing low over there, and beneath every swing low— now arguably, this is the, um, this is not the perpetual futures chart, which I use to trade. But let's go on to the perpetual futures. And as you can see, there can be some slight differences. So it all depends on which chart you're using. For example, if you're trading on FTX, then you're going to want to look at the FTX chart. For me, I trade on Binance Futures, so I'm going to want to use this chart to refer to all the price action. So if you see beneath in the 1-hourly chart, there is a previous swing low. Beneath every swing low is what you call sell-side liquidity, or SSL, right? Sell-side liquidity. Above every swing high is buy-side liquidity. Now, well, what does that mean? Basically, above this swing high, there are a lot of people that are looking to short, or maybe they shorted at any point over here, and they would very likely put their stop loss above this high. Why is that? Well, think back to how you were trained to find where to place your stop loss. It's probably above previous swing highs or below previous swing lows, right? Because that is quote unquote support or resistance. The market makers know this and they have access to the data that shows them where all the liquidity is concentrated at. So you can imagine the moment price hits this area, a lot of these traders are just gonna get stopped out and then they're not gonna be able to make money during this move. Now you might be thinking, hey, these market makers are really, really cruel. Why would they wanna do this? Well, because every time you win money from a trade, the market makers are paying you out of their own pocket. So it is in their best interest to make you lose as much money as possible. So it's very important that you learn to read the market from the perspective of the market makers and not from the retail traders, because the MMs are the ones who are moving the markets. And currently, do I think Bitcoin's going to go down? Well, at the moment it seems like it is, and I'm not really going to look to be shorting here because currently I just don't see an opportunity where I might be able to short because the price action that led to this downfall is really, really clean, and there is no like areas of imbalances that you can take advantage of. The most I can do is perhaps hop onto a 15-minute chart. Let's assume that the price bounces at this fair value gap over here. Let's try to think ahead a bit, because that is something that I love to do and something that I always preach and teach in my programs, which is the fact that you want to try to think one step ahead. The reason why a lot of people find themselves panicking is because they fail to see the big picture and they fail to think one step ahead. So I am a huge believer that the genre of strategy is a really good genre to help you with your trading. I don't know if you guys noticed this, but my username on TradingView is literally called The Grand Strategist. It's always been that way, um, ever since I was a child. Always been very heavily favored towards strategy, like not just books but like games. And in fact, I think if I did a Myers-Briggs or some other kind of personality test, and my natural sort of inclination is being a strategist and This is going to be another pro tip. Strategy really helps you with trading. Why is that? If you think about it this way, right, the general, or in this case you, who does not observe the environment— in this case, this will be the higher time frames— if you don't look at the higher time frames before you go into the lower time frames and charge into the enemy, you're very likely going to lose a lot of soldiers very quickly. In this case, the soldiers is your money. It's a very simple analogy. Being able to just think one step ahead and having a plan for every scenario— for example, if price hits this, then what? If price goes there, then what? And not being bought into a bias like, oh, price must do this, oh, price must do that. Because let's— truth be told, the only certainty in the markets is that there are no certainties. So if you're able to just think in terms of probabilities and try to think one step ahead, dude, your trading is going to improve so much. Oh, that was just a little bit of a rant and me sharing a little bit about my passions. Anyways, back into the video. Let's assume that, um, price is going to find, you know, its bottom somewhere around here. So we're just going to draw the Fib beforehand. Now what I'm looking for is an area of value that is located somewhere within the golden pocket. And right now I see that area of value immediately, right? That is an order block that has not been mitigated yet. So if price returns back to $20,800, I will look to short this with a stop loss at give or take $20,877. And my target for this trade is going to be all the way back down to $19,400, something like that. So that is a trade that is worth 30R, which basically means that if your risk is $100, like basically every $100 that you put into this trade, you're gonna get $3K back. For example, if you put $1,000, that's $30 grand. So as you can see, even though the percentage gain itself is not huge, it's only a 6% move, you can still make a ton of money from this trade. And that's why I always preach, it's not really about the percentage gains, it's about the R-value that you're getting back. From a trade. So just because this trade will give you 50% gains does not matter one bit if your stop loss is like 25%. In that case, it's just going to be a 2:1 risk-to-reward ratio, which is horrible. Like, I mean, it's all right, but nothing compared to, say, a 30R trade. But of course, this is all just a hypothesis, and this assumes that we are going to bounce from here. If we do though, I think that's going to be a really good area because it just so happens that that level is within the premium zone of this move, and it's in the 0.705, which is the golden pocket. Now you can also You could consider getting in at this area right here, which is at about 2,600 with a stop loss at 2,650. Now the only reason that I wouldn't be such a big fan of that is the fact that if I move, like see, this is below the 0.5. Now in any given range, I want you to imagine that within any given range, anything below the 0.5 is known as a discount, right? It's cheap prices. Anything above the 0.5 is premium. So what you wanna do is you ideally, you wanna always look to sell in a premium and you want to buy in a discount. You don't really want to buy— I'm sorry, you don't really want to sell when you're in a discount. In this case, I would disregard this entry. Now, it can be a viable entry, but this one is going to be way better compared to this one. Hopefully that makes sense. And if you're wondering why this premium discount theory even exists in the first place, um, I'm just going to tell you a quick story about algorithms. Because the algorithms that move these markets, which basically account for 80% of daily trading volume, they— like, their sole purpose is to keep the markets in a state of balance or in a state of equilibrium. So a state of balance would basically mean that the markets should stay within the mid-range as much as possible. So when price deviates away from the mid-range, let's say price stays in a discount— sorry, in a premium for too long, then the algorithms will try to bring the price back down into a discount to balance things out, to give both sides of the players a chance to participate in the markets. So that's why this premium theory discount exists, and Hopefully you learned something from that. So currently that is the plan for Bitcoin. Now let's get into the DXY. Now, reason why I bring up the DXY is because whenever the DXY is going up, Bitcoin's basically going down. The reason for this is very simple. I'm gonna give you a very simple analogy, which is Bitcoin is valued against the USD. When, so when the USD is going up, you can imagine Bitcoin's probably gonna go down, right? The DXY is an index that measures the strength of the US dollar. So when DXY goes up, Bitcoin goes down. Now I'll give you an example. DXY started dumping on March of 2020 and it started pumping again back in like May 2021. Now if you recall, Bitcoin started its bull market at March 2020 and found one of its tops at May 2021, right? This is just to visualize it for you. And ever since then, Bitcoin has just been dumping really hard because DXY has been pumping really hard. At the moment, the update is that If you see DXY right now, you can see that DXY has been moving basically in a parabola, right? It's just been going straight up, and recently it has just broken the parabola. So this is really huge news and why I believe that Bitcoin is going to have a really bullish and maybe even a bullish Q1 of 2023. But this all hinges on the fact that DXY has found its temporary top and it's going to retrace all the way back down to 107 points. Now, why is 107 points Again, if you draw a— no, sorry, not 107. Um, ideally you want to retrace all the way back to 100. I don't think that's going to happen within this move. I think this move is just going to target 107, which will put Bitcoin somewhere in the range of $25K-ish, which is still huge. But if, again, if you draw a Fib swing low to swing high, you can see that this level right here is the first swing low beneath the 0.5, i.e., a discount. Now, I do not think that we will get there this year, and I— and this will probably happen sometime in summer to fall of next year. But right now our sights are set on basically 107 points, because if Bitcoin gets here— I mean, if the DXY gets here— that's a $25K Bitcoin easy. Anyways, back to the DXY. You can see that it's pumping right now, and that's why Bitcoin has been going down. So if you just go into the 4-hourly, let's identify an area where DXY might find its top. And you can see that there is an order block over there. And if I just draw a fib from this move high to that low, you can see that this is the first area within the 0.5. Now you can argue that there is another key order block over here and you will be right. So I'm looking for DXY to get rejected at either one of these levels. Now there is no certainties again, and especially because there are relatively equal highs over here, there is a chance that DXY could just pump all the way back to 113, in which case Bitcoin's gonna go dump all the way back to like 19, maybe even 18K. But at the moment, given that our analysis of Bitcoin is predicting a pullback with a pullback so that you can get into a long before another up move. I'm going to say that with DXY, you're going to find resistance and you're going to find the top somewhere between these 2 levels over here, and then you're going to do this. Now, if you are finding value from this video, you are going to absolutely love the private Discord group because this is where I'm sharing tons and tons of trade ideas. This is where you're going to be able to follow along with my trades as well as market updates basically in real time. So consider joining the Discord group in the description box below. Anyways, Time to talk about one last thing, which is the FOMC meeting. Now, this Wednesday we're going to get an FOMC meeting. So why does this matter? Well, FOMC is one of the biggest news events that you should pay attention to because it literally dictates how Bitcoin and crypto is going to perform as a whole. If FOMC comes out with some bearish news, you can fully expect Bitcoin to just dump all the way back down to $18,000-$19,000. And if FOMC is bullish, well, that is the catalyst that Bitcoin needs to continue its Up move. So what I would highly recommend is that you be patient for now until I've given you two levels on Bitcoin that you should pay attention to, which is right there and right there. Before Bitcoin hits either one of these, oh also the that block over there, like to actually draw that block. Then you want to look for this block right here. So until Bitcoin hits either one of these three levels, you do not want to do anything, especially before Wednesday. Right? Highly recommend just staying flat until. One, either these levels are hit or until the FOMC meeting is over and you know exactly what the Federal Reserve has in mind for the rest of the markets. And this is also a pro tip, which is the reason why a lot of people get wrecked when they trade and lose a ton of money is because they lack the patience to just wait until price goes into a key level before they trade, right? Instead, they try to catch every little move in the middle of nowhere and they don't know where to set your stop loss. Even if they do set a stop loss, it's going to be horrible because All these levels in the middle is just prime liquidity for the market makers to play around with. Instead, you wanna wait for the key levels to be hit. That is where you're gonna get the biggest risk-to-reward trades and the highest probability of success trades. And lastly, if you found value from this video, the people that work with me one-on-one literally get 10 times the results in 1/10 of the time. Chances are this whole time all you needed was a little bit of coaching and guidance to push you in the right direction in order to be profitable. In about 2 weeks, I'm about to start a beta mastermind of about 20 people. Currently, 10 have already been taken. And I still have a lot of calls to go through this week. Now, because this is a beta mastermind and I wanna be able to get you results, like mad results quickly, you should have at the minimum $5K to $10K to work with. So if this is something that you might be interested in, I just want you to drop me a DM on Twitter before all the spots fill up.




