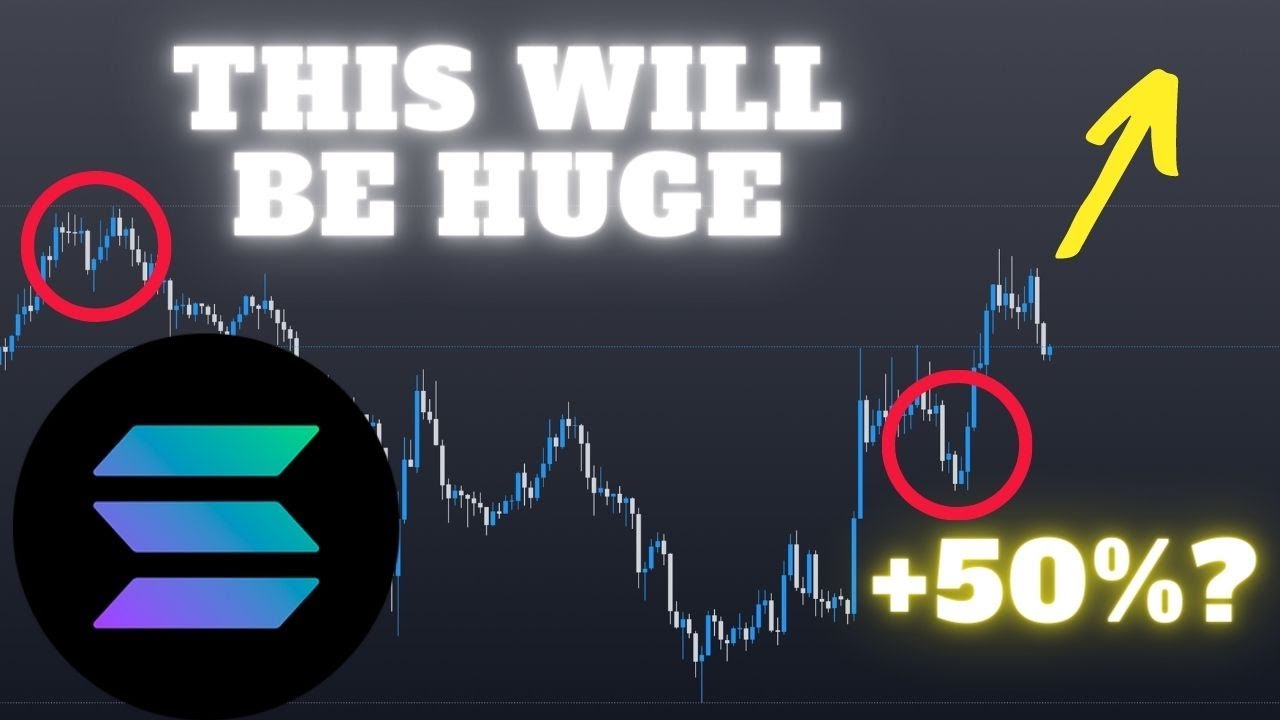
In this video, The Art of Crypto presents a detailed technical analysis of Solana (SOL), arguing that despite a weak October, the cryptocurrency is poised for a significant rally up to $50. The presenter links the upcoming post‑midterm election bullish trend (historical data back to 1942) to Solana’s price action and explains how market‑maker dynamics, liquidity zones, fair‑value gaps, Fibonacci extensions, and order blocks can be used to identify precise entry, stop‑loss, and target levels. He outlines short‑term targets around $35‑$36.70, a mid‑range target near $39, and a long‑term target of $50, describing three potential entry points within a fair‑value gap and the use of the “golden pocket” (0.618‑0.705) for optimal positioning. The video also promotes his Discord community and a beta mastermind mentorship program aimed at traders with $5K‑$10K capital, promising six‑figure earnings within 90 days.
Chapters
All right, what's up everybody? In this video, I'm gonna talk about a really nice opportunity on Solana because this chart is just so clean and I believe you guys should know about it. Now, I talked about Solana about 3 weeks ago and I mentioned that Solana has the opportunity to just go absolutely crazy and go all the way up to $50, which is basically a 50% pump from this point onwards. I still highly believe that even though the month of October has not been good for Solana. There are a couple of reasons for this. The first one is going to be the midterm elections. I talked about this in another video. Basically, the general premise is that usually after the midterm elections, which happens in November, markets just tend to go into a bullish trend. This data goes back to 1942, where every single year where there is a midterm election, October tends to be the month where every single market finds the bottom. Now, I understand that history is not an indicator for future performance, but it does rhyme, and you cannot deny 80 years of data to support this. So October being a bad month, well, it's understandable, but that doesn't change the fact that Solana still looks absolutely gorgeous. So I've already gone through the liberty of marking out key levels that you need to know, but all in all, the long story short is I'm expecting Solana to go up. However, there is going to be some retraces where you might be able to get into Solana that is going to give you a really good opportunity. You want to figure those out? Oh, we're going to get into those right now. So let's start with a key level that Solana is going to reach for, and I believe that within next week or maybe even the next Probably next week. Before Wednesday, we should see somewhere about $35 to $36, like a $37 Solana. Why do I think so? Firstly, you have just taken out the sell-side liquidity over here. Now, if any of you were in the private Discord, I talked about the fact that Solana might just be forming another mini range here before the next move. And I was sort of expecting some kind of a rejection over here, but turns out you are just gonna expand straight out of the range. Now, if you follow that theory, usually when you expand out of any ranges, you tend to go for a 1.618 sort of extension. to maybe 2 extension. Now in this case, I'm actually going to go with a Fibonacci extension of about 2. Now the reason for that is because there is a previous swing high over here, which basically just means that there is liquidity above these levels. Now you always wanna read the market from the perspective of liquidity. Basically, this is going to be a pro tip. If you wanna figure out where the markets are gonna go, you simply look at where is the highest liquidity, usually above previous swing highs and previous swing lows. And especially if you get relatively equal lows, for example, like over here, you get relatively equal lows. Look at how aggressively the market moves below the equal lows because whenever you get just liquidity, the market makers are gonna take it and they are the ones who move the markets. So you really don't wanna mess around with them basically. Now you might be wondering like, hey, what is liquidity? Now I want you to think of the markets as a Ferrari and in order for the markets, or rather this Ferrari, to go up or down, it needs liquidity, right? It needs fuel. Liquidity is that fuel. Basically, like if the market makers don't take liquidity, the markets are just gonna continue on in a state of perpetual ranging. To build up liquidity. And ranges, again, is a way for market makers to engineer liquidity. That's why every time you see a range, you always want to go long at a range low, or like once the range low has been taken. And usually, usually you want to go short when the range high is taken, unless the higher timeframe bias is towards the upside and the market makers are aiming for expansion, in which case Solana is aiming for some kind of an expansion. So I believe the ultimate target is going to be at $36.70. Now, why is that? Now, if you just go onto the 4-hourly chart, you can see that there is a fair value gap Over here, from this point onwards to this point, I want you to see this right. Like the only two times that we retested this fair value gap, we got rejected hardcore. Now this whole thing is a fair value gap. Why does this matter? Well, the algorithms that move the markets, which also account for about 80% of daily trading volume, they like to keep the markets in balance, right? In a state of balance. And usually whenever you get a gap means that that is an imbalance. That's why you always hear other people talk about how oh the CME futures gap has to be filled. or something like that. That is the same kind of theory. So whenever you get a gap in the market, that's a gap in liquidity, which the algorithms are going to love to fill up. So usually you have 3 possible entries when you're looking at a fair value gap. The first one is going to be at the beginning of the fair value gap. As you can see, that was a perfect entry. Imagine if you just went short there. That was about a 10% drop, more than 10%. If you just took profit later, that would've been almost almost a 30% drop. This is how you catch tops, by the way. And this is like catching tops and all these market maker concepts is something that I teach a lot in this channel. If you watch through every single one of my videos, I'm not just trying to give you like, hey, you know, do this, do that, do that. I really want you to understand how these markets move because ultimately that's going to be the only way that you're going to find success. And it's not true watching videos like this, and it's not going to be from people telling you, hey, yeah, oh Bitcoin, um, you got a trend line, you got a trend line over there, it's going to break out, or You know, something like that. It just doesn't work. Anyways, going back to what I was saying before, you have 3 possible entries with a fair value gap. You have one at the beginning of the fair value gap. You have another one at the golden pocket of the fair value gap. How do you do that? Well, since we're looking for a short, we're gonna draw a fib from high to low. You can see that the mid-range of the fair value gap is a very, very possible entry. Now you will see that I have the 0.618 and the 0.705 on the fib, 'cause that is the golden pocket and that's usually the money zone. But the reason why I'm disregarding both of those levels at the moment is because if you just take a look at this wick over here, this lines up perfectly with the 0.5 fair value gap. And trust me, this is not a coincidence. The algorithms that are repricing these markets up and down, they are repricing it in a way that is predictable. Like, if you just learn how to read Fibs, fair value gaps, order blocks, as well as just market structure, you literally— you're set. Forget all the random indicators, RSI, whatever. That's just going to confuse you. If you just learn to look at the market in this way that I'm trying to teach you, Dude, you're gonna be golden. Now, this theory that I just gave you lines up with the idea that there is liquidity above these levels over here, which the market makers are going to target. So what I'm expecting most likely is going to be something like this, maybe that. Then you're gonna get some kind of a local rejection whereby you're gonna get an opportunity to go into a long, go all the way up to the mid-range, $39, and potentially even higher. So let me show you how exactly this is going to play out for you. Once these levels of liquidity have been taken out, as well as the fair value gap basically, What you're gonna wanna look for is, let's assume that the high is going to be formed over there, right? Let's assume. What you're gonna wanna do is you're gonna wanna draw a fib from this swing low over here, right? Put the fib there and then go to the high. And then what you're gonna wanna look for is the 0.705. Usually there is going to be some kind of an order block or the 0.618 works as well. Like both, like basically this zone right here would be absolutely golden. I mean, it's literally called the golden pocket. So what you will find is that you'll see some kind of an order block over here. An order block is basically just the last down candle before a really aggressive move upwards. Usually there will be a fair value gap left behind, as you can see over there. Like, train your eyes to look for these fair value gaps and order blocks, and trust me, your trading is gonna improve so much. So that's the fair value gap, and then below you have the order block. Now, assuming that that is going to be the high, you can see that this order block lines up perfectly with the 0.618, which, hey, I'm just saying, these price movements are not a coincidence, okay? The market makers move these markets in a very deliberate, calculated way. Basically, that's gonna be the area where you're gonna wanna take a long. You're gonna place a stop loss beneath the order block, and your target is going to be literally the range high. At about $50. That is again going to be about a 50% trade. Of course, there is a lot of nuance that goes into this. There is going to be a lot of different take profits that you can use. And if you just wanna follow along with those, consider following me on my Twitter. That's where I'm sharing the latest market updates that I otherwise find it difficult to share on YouTube because it takes quite some time to make a video. Also consider joining the Discord group because I'm giving you literally a breakdown every single day of the coins that you should be looking for, as well as all the important news that you should pay attention to. And you can also follow along with all the trades from me and my team, which, hey, fun times, right? Anyways, if you're still here, listen, the truth is you can watch as many videos like this as you want and chances are you're gonna get a ton of value. You're gonna feel like you're learning, but the people that work with me one-on-one get 10 times the results in 1/10 of the time. Chances are this whole time all you probably needed was somebody to guide you and push you into the right direction in order for you to find success trading, and that's been missing all your life. So in about 2 weeks, I'm going to be starting a beta mastermind where I'm only gonna be taking on about 15 people. Into a mentorship where I'll be working with you really, really closely to get you some massive results. The goal is to get you making 6 figures within the first 90 days of starting the program. Now, because this is a beta program and I wanna be able to get you massive results like basically no time, the only people that are gonna be a good fit for this are people who have at least $5K to $10K to work with because otherwise you just wouldn't be a good fit. Now, if you're interested, drop me a DM on Twitter and just ask me about the mentorship. And I'll get back to you. Cheers.