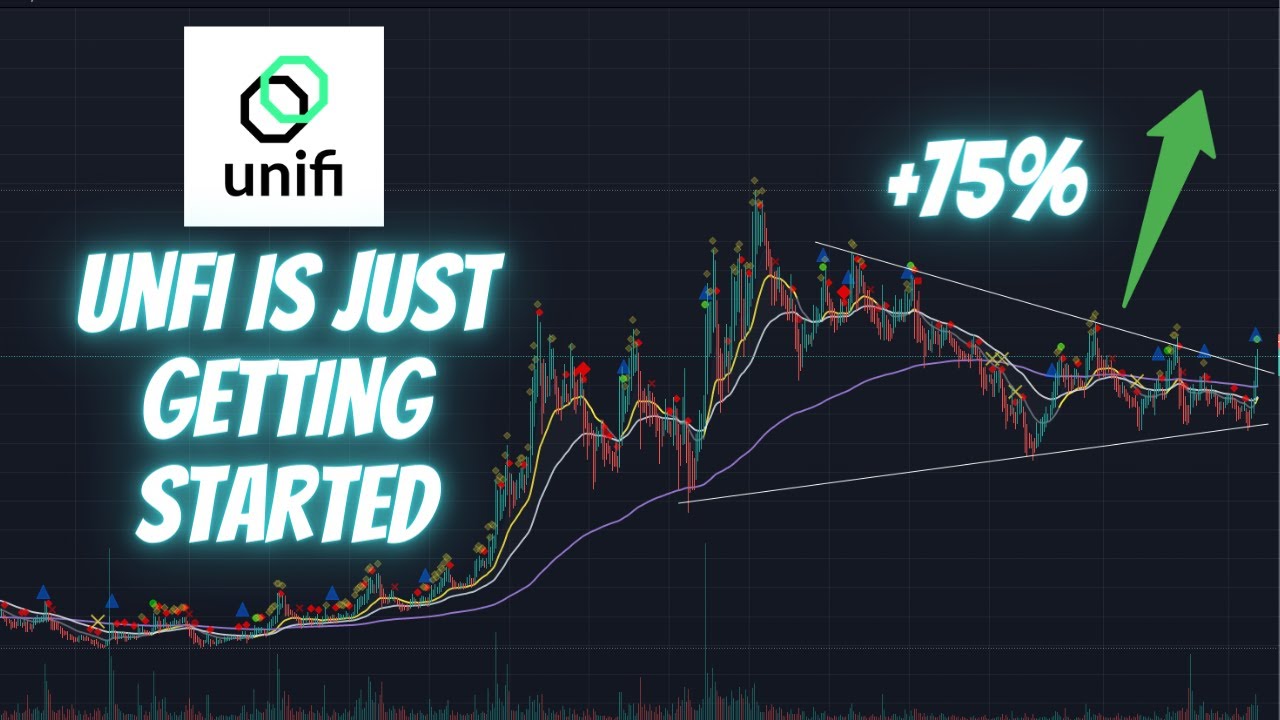
In this video, The Art Of Crypto provides a detailed technical analysis and price prediction for the UNFI/USDT pair. He begins by highlighting a prominent falling wedge on the 4‑hour chart, noting that such patterns typically break to the upside but may also result in a fake‑out. To differentiate between a true breakout and a fake‑out, he relies on the Market Cipher indicator, describing it as a tool that can anticipate price moves before they happen. Using the 4‑hour, 1‑hour, and lower‑timeframe charts, he examines EMA levels (21, 50, 200), stochastic RSI, and overbought conditions to anticipate a pull‑back to support zones around $28.5, $27.5, or even $24.3. He outlines entry criteria (wait for a retest of EMA support and bullish candlestick patterns such as a bullish engulfing or double bottom) and sets short‑term profit targets at $31.6 and $32.85, suggesting a partial‑take strategy for roughly 15% gains. For longer‑term expectations, he projects resistance between $38 and $44, with a trend‑line target near $39.22 and Fibonacci‑derived extensions up to 61.39% of the swing. Stop‑loss placement is recommended just below the 200‑EMA on the 1‑hour or 4‑hour chart. Throughout, he emphasizes caution, advising viewers to wait for confirmation before entering, and concludes with a hopeful tone about potential gains.
Chapters
What's up everybody, welcome back to The Art Of Crypto, the best place for you to learn crypto trading and crypto investing. So in this video we are going to be looking at UnFi USDT. Now this is going to be more of a price analysis, price prediction sort of video, and I believe I will be doing more of these videos from now on. So if you guys would like to see more of these kinds of videos, drop a like, and if you guys want me to do an analysis on any coin that you are looking at, just drop me a comment. Now Without any further ado, let's just jump right into it. So right away on the 4-hourly chart, we can see here there is a massive falling wedge. So usually a falling wedge breaks to the upside, and at the moment in real time right now, it's breaking. It's trying to break out. Like, see, the thing is, in traditional technical analysis, there is no way for you to know whether or not something is going to really break out or if it's just going to be a fake out. Which is where price breaks out of the pattern and just falls right back in. So with traditional technical analysis, you would not be able to tell. So I'm going to bring out a tool that I use all the time. In fact, it's probably the only indicator that I really use, and that is called Market Cipher. Now, I don't know if you guys have heard of this, but the creator is on YouTube. His name is Crypto Face, and he is making bank every single day. And I can see why, because ever since I have learned to use this indicator, it's like absolute magic, man. Like, it really— I would say I would relate this to Market Cipher is like shining a light onto the darkness, because in traditional technical analysis, you wouldn't be able to know whether or not price is gonna break out or it's— or is it gonna fake out. And that is where Market Cipher comes in. It tells you exactly what is going to happen before it happens. So over here, if you see green dot trigger wave, and we're off to the races. So let's just let's not get sidetracked, and let's do some analysis. So in order to get a better sense of whether or not this will break out or fake out, I will have to go down to the lower time frames. So on the one hour time frame, I can see that the price is nearing a peak. The stochastic RSI is at a peak. The RSI is overbought. Which means that there is a high likelihood that we are going to come down for a bit, probably. So it's either gonna come down to retest this trendline, or it's gonna come all the way down here to retest the EMAs, right? The yellow line, the yellow line right there, that is the 21 EMA. The purple is 200. And the white line, see this white line here? That is the 50 EMA. So what I'm expecting to happen is for the price to come down to retest one of those EMAs. At probably around this level right here, $27.5, if it breaks— if it breaks below $28.5. Because in any pattern breakout, previous resistance— see how the price came up here and got rejected? So previous resistance tends to become future support. So now that the price has broken above this resistance, it should under normal circumstances act as support, but we have to wait and see. So if this support line breaks, I'll expect the price to bounce at 27.5, and then we are probably off to the races. In fact, if you look at it this way, it could even come all the way down here, all the way down here to about 24.3, and we would still be considered in an uptrend because that would be a higher low. So here's what I'm expecting it to do just based off of these signals of Market Cipher. And if we go to an even lower timeframe, we can see this playing out even more. Even more clearly, which is price is at a peak, everything is overbought, and look what happened. In just in the last half an hour, 40 minutes, we've already dropped by 3%. So I'm expecting the price to retest the trendline, retest this support, probably retest the 21 EMA, at most fall to the 50 EMA, and continue its pump. So if you guys are looking to get into this trade, that is what you should be waiting for. So what are the profit-taking targets? So if it really does get a retest, if it really does bounce from here, then the immediate level of resistance would be about 31.6, and the next would be about 32.85, right? If you were a short-term trader, you could take probably half here, half here, and you'll be out of the trade with approximately 15% of profits, right? But right now, I'm not telling you to get in now because It has already pumped by 26% in just the last 8 hours, 12 hours or so. And at the moment, on the lower timeframes, it's definitely looking like it's a peak. So wait for the retest if it bounces, if there is a— so when you look for retest, right, um, you can go down to say the 5-minute timeframe and just look for, look for a bounce, right? Look for a bullish engulfing pattern. Like, if you know what that is, actually, I'll give you a real-time example of how a bullish engulfing candle looks like. So yeah, so Right here, if you see this doji, like this doji candle was really small and the next candle was like huge, right? It pretty much engulfed this. It pretty much engulfed the candle, which is hence the name bullish engulfing candle. So you want to look for something like that, or perhaps a double bottom, which is one of my favorite patterns to trade. But we might not get that, so just look for this line and this line here to act as support. And if we do hold as support, then we are off to the races. So for a longer-term profit-taking target, it would look a bit more like $38 to perhaps $44. You could just draw the trend line from here to here, and the target would be right around this resistance right here, $39.22. And if it does break even higher— God forbid if it does break even higher— You can use a Fibonacci retracement from swing high to swing low, and you would get targets of 51.8%, 55.75%, and 61.39% as the ultimate target. But those are more longer-term profit-taking targets, which will probably take about a few days up to a couple weeks, who knows. But everything takes time to play out, right? But either way, I would say that this is a pretty safe trade to take because if anything, This is about like just based off the one hour golden cross happened, right? Fifty crossing over the two hundred. So you could just set your stop if you if you are going to set a stop loss. It could be just below the two hundred EMA on the one hourly or maybe even the four hourly. So yeah, that's Unfi USDT massive falling wedge. It's about to break. It's breaking out right now, but it's looking more of like a fake out than a breakout right now. So if it really does break out and retests. then we are looking for a lot of upside. So if this trade works out for you, you're welcome for the profits. And this is me signing off. May the gains be with you, my friend. Peace. Peace.