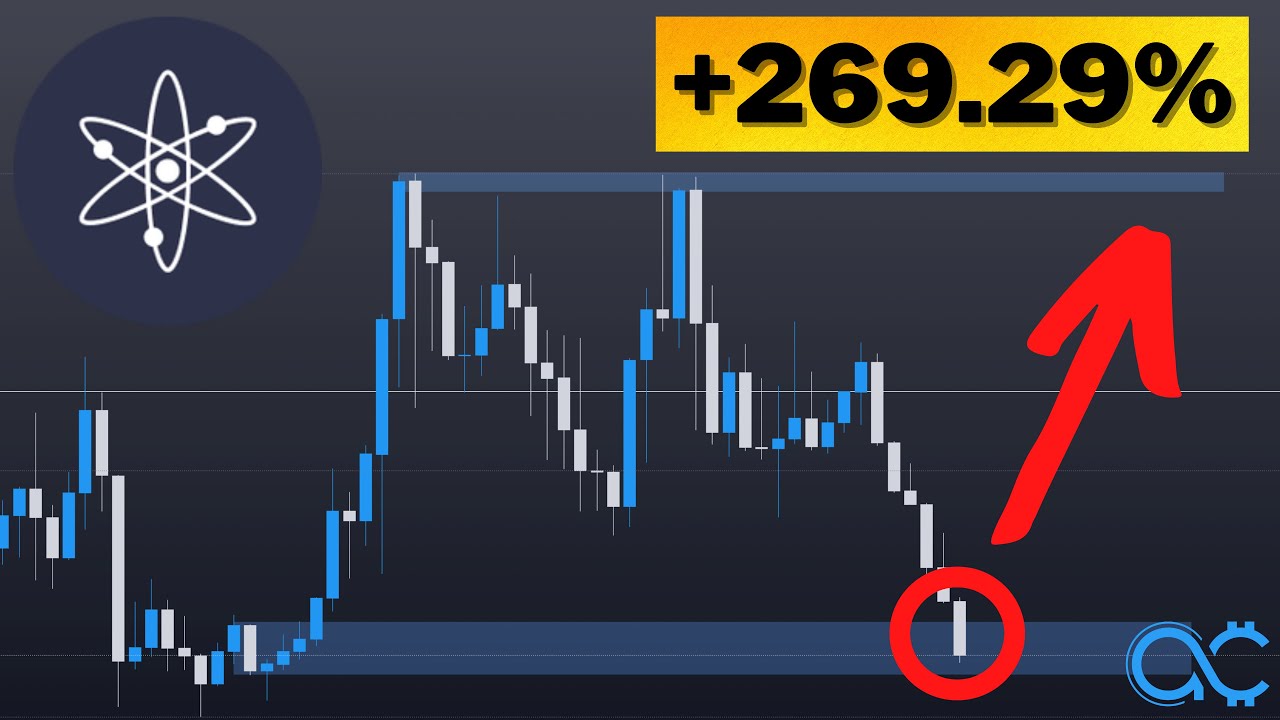
In this video, The Art of Crypto provides a detailed weekly‑chart technical analysis of Cosmos (ATOM). He identifies a bullish weekly order block between roughly $14.2 and $9 as a primary buying zone, explains how the recent break of the previous price range creates a new macro range, and outlines specific entry considerations. The presenter maps multiple Fibonacci‑derived and range‑based take‑profit targets: a first target near $20.5 (old range low), a mid‑range target around $26.3 (0.5 Fib), a third target near $33.3 (0.705 Fib), and a final target at the macro range high around $45, with an extended upside scenario up to $55‑$67 and a year‑end target of $67.8. He describes the criteria for confirming a swing low (three‑candle pattern) and stresses the importance of the order block holding for the trade thesis. Risk scenarios are covered: if the range low fails, price could drop to $9 or even $7.8, prompting a hard rebound due to liquidity dynamics. The analysis emphasizes that weekly‑timeframe signals carry higher conviction than lower‑timeframe moves, and the video concludes with a call to comment “atom” and a wish for gains.
Chapters
What's up everybody, this is just going to be a little analysis on Cosmos and I'm gonna give you the exact level where you should look into buying Cosmos because I think it's going to be a really strong support level. And if it doesn't hold, I'm going to discuss that possibility as well. And the target for this trade in particular is going to be at least 2x and beyond if you get it beyond. And the reason I stumbled upon this is because I set a couple of alerts right here where the price is at at the moment And I said it like a couple months back and, you know, it finally hit. And that's why I was alerted to this. And basically ATOM is going back into a key zone for buying that I marked out a few months prior. And that's gonna be this blue box right here. Now this analysis is gonna be done on the weekly chart. So this is gonna be a swing trade at the very minimum. So just keep that in mind. So before this, I was actually looking forward to ATOM holding this range low right here, but clearly it didn't. And clearly it has broken beneath the range low. In fact, let me just mark out what I mean by a range low and a range high. If you look at price before it broke down, you can see that price was basically gyrating between that range high, range low, range high, and back to essentially the range low before reversing. But during this reversal right here, it failed to make a higher high on the weekly chart, and that's why it got rejected. And now we have broken below the range, which means that the next time that we go back to retest the prior range low, we are very likely going to face some kind of resistance. But basically this old range has been broken and my theory has been broken. Although price tends to wanna stay within a range 70% of the time, there's still 30% that it likes to break down. So now that price has broken the range, now we have to look at it from a new perspective. We have to look at it from a new range. And you could argue that this is another swing low as well, right? Range low, sorry. And within the range low, there is going to have to be like a buying zone. Let me just go down to the daily chart so that I can give you guys a clearer entry, it's going to be between $14.2, give or take $12.7, and give or take $10.86, and even $10.2. And on the low end, right, on the low end, if you can get ATOM for $9, you are gonna get some sick, sick returns. And I'm— but I'm not saying that ATOM is going to go that low. I'm just giving you guys the numbers here. Now, the reason why I mentioned those levels is because this level is what you call as a weekly order block, and this is a bullish order block. And basically, when price goes back into an order block, that is sort of like your area of value if you were to buy. And if price goes back into a bearish order block, which I'm going to mark out as this one right here, then that is where you'll be looking to sell or take some profit. And the target for this trade, if you pick up ATOM within this block right here, basically from 14.2 until 9, that's going to be like a very good buying zone, at least when you view it from the weekly chart, which means it's going to be a very strong level for price to hold. And if it doesn't hold, then you're gonna have to get really worried for ATOM because it might be going to break that swing low right there, and we do not want to see that, right? Because currently, assuming that this is our new macro Range low and macro range high, then we are going to want Atom to really hold the range low. Otherwise, you're really going to get screwed. Just like how when you broke that range low right there, then Atom's basically just been taking a nosedive, basically like 20-30% over the course of two weeks, which is not what we want, right? As investors and as you know people who believe in crypto. And again, I'm just going to prove it that you know we are indeed in a new range at the moment, a new macro range where this is going to be your range low and your range high. You can see that the zone of supply right here, right, the bearish order block, just happens to line up with the 0.5 fib right there on the right side. I'm not sure if you can see it, but right there at 26.34, that is the 0.5 fib, which means that is the exact midpoint of this macro range right there. So that's going to be your first take profit target. Of course, your first take profit target could absolutely be at 20.5 because this is the old range low right here. So That could be your first take profit. So assuming that, you know, we average out our entries— so I'm not going to like pinpoint a specific entry, I'm just going to assume that we get the middle, right smack dab in the middle of that weekly order block— then if we take profit at the first level, that's going to be a 60% target. And do I think it's going to hit? Well, as long as this range low holds— in fact, as long as this weekly order block holds and we form a new swing low on the weekly chart— and when I say swing low, I mean Like it has to be a candle, like I'm gonna draw it out, right? Like this, right? It has to be a fully closed candle, 3 fully closed candles. In fact, you know, the middle candle has to be lower than the 2 candles right next to it. So for example, that is a swing low, that is a swing low, that is a swing low. If you form a swing low within this order block right here, there's a very, very, very good chance you're at least gonna go back to 20.5. And not so likely, but still likely, you're gonna go back to the mid-range of the range low. Because here's the thing, you're gonna go back to the mid-range of the macro range. And trading can be as simple as this. You don't really have to complicate it much. And I hope you've learned something from this video about ranges, 'cause it's really simple. You simply buy at the range low and you sell at the range high or the mid-range, and it tends to happen a lot more than you think. So assuming that you buy at the bottom here and your second take profit for this trade is at the mid-range, then that's gonna be 100%. And your third take profit, I'm gonna recommend is to take it at the 0.705 Fib, which is at 33.9. And I'm gonna narrow that down even more and say that your third take profit should be at 33.3, and that's gonna be 163%. 43% from entry, assuming you just get like smack dab in the middle. And for your final take profit, you're gonna take the rest at $44.88 or like basically $45. Now this is the range high, this is the macro range high, which is about a 250% pump. Now is price likely to go back there? Only time will tell. But what is the possibility that price could break above the range high? So if that is the case, then you're gonna wanna look to take your profit somewhere between $55 and $67, right? In fact, I'll just say it that if price really just, you know, keeps forming high lows and high highs and high lows and high highs, then the ultimate target for ATOM come the end of this year or maybe early next year is gonna be at $67.80. And if that happens, then assuming you got this entry, that's gonna be about 426%, 427% actually. So that is currently the scenario that I'm looking at. Again, this analysis is done on the weekly chart, so it's going to be higher conviction and more likely to be right. Than something that happens on, say, the 5-minute or, you know, even the 1-hourly chart, for example. But what is the possibility that price breaks beneath the range low? So let's see. Once price breaks beneath the range low, I'm going to want you to understand that the market moves on liquidity. Basically what that means is when price breaks this, basically 7.8, right? If price does break 9 or even 7.8, then you're gonna wanna expect some kind of a hard rebound. Now, the reason I say that is because price moves on liquidity. And I made a full video just earlier today. In fact, right before I recorded this video, I made like video just explaining how liquidity works and how Bitcoin is probably not going to go back to $20K. So if that's something you're interested in, check out that video. I'm going to link it right here. If you're still around at this point, I just want you to comment down in the comment section, atom. It really helps out the YouTube algorithm a lot, and I will be sure to acknowledge your comment within the first 24 to 48 hours. For now, may the gains be with you, my friend.