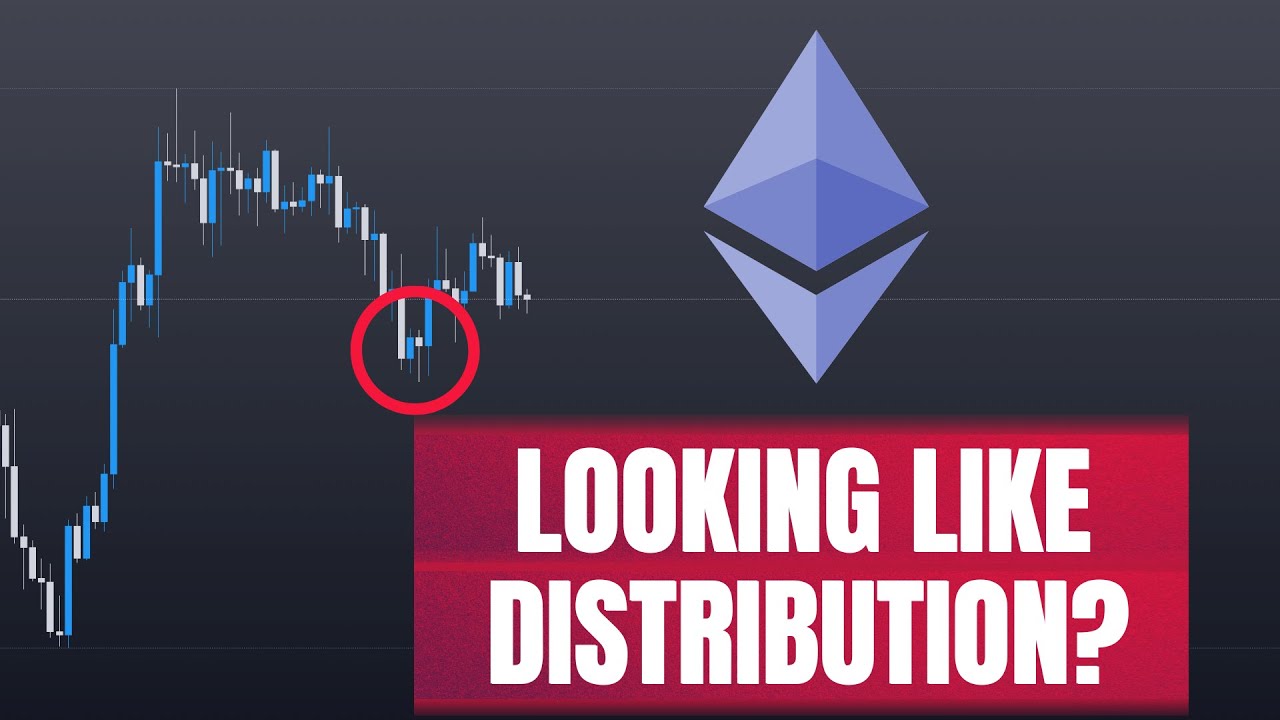
In this video, The Art of Crypto provides a step‑by‑step technical analysis of Ethereum (ETH) over the next few weeks, teaching viewers how to derive trade ideas and risk‑management rules. The presenter begins with a higher‑timeframe (daily) assessment, noting a bullish market structure and identifying two primary price targets around $1,782 and $1,923, contingent on a confirmed higher low above $1,555. He then drills down to a 4‑hour chart, drawing a Fibonacci retracement from the recent swing low to swing high and highlighting the 0.705 level as a high‑probability entry zone, often coinciding with a bullish order block. Throughout, he shares four “pro‑tips”: start analysis on higher timeframes, recognize that markets move on liquidity (previous swing highs/lows), stay patient and let trades come to you, and always reference higher‑timeframe targets before entering a lower‑timeframe position. He explains stop‑loss placement below the swing low, the psychological pitfalls of ignoring risk management, and outlines a bearish fallback scenario (potential retrace to $1,450, the 0.786 Fib level). The bullish bias is reinforced by Bitcoin’s strength, with the expectation that ETH will follow BTC’s rise toward $28,000. The video concludes with calls to follow his Twitter and join a private Discord for more trade alerts and a trading course.
Chapters
Hello, hello everybody. In this video, I'm going to tell you exactly what Ethereum is going to do over the period of the next week or a couple of weeks or so. And even if you're not here or interested in taking any trades, it will still be immensely helpful to you if you simply observe the way that I come up with my conclusion. Trust me, you will learn so much. And if you try to apply some of the things that I do while coming up with the analysis, you're going to be so much more successful than what you are right now. So immediately jumping into Ethereum, we're going to take a look at Ethereum against USD first, and then we're going to talk about the CME futures gap, and then we're going to take a look at Ethereum against Bitcoin. Now Ethereum is sort of the mama of all altcoins, and because Ethereum is the highest market cap coin in total too, it's very important to determine the performance of Ethereum, especially if you're interested in getting into altcoins, especially in the top 50 or so. So to kick things off, we're going to start off on a higher time frame. Now, this is a pro tip number 1 for all of you watching this, which is you always start off on a higher timeframe and then you go into a lower timeframe. The reason for this is because the daily chart is often the timeframe that institutional traders, as well as the algorithms, use. It is the timeframe that they use in order to determine if they are going to reprice the asset lower or if they're gonna reprice the asset higher, like what Ethereum is doing right now. Every time you see a shift in market structure on a higher time frame, for example the daily chart, for example the 4-hourly chart, you immediately start looking, hey, what is the next level that price is going to target? And usually, like in 90 to 95 or even 99% of cases, you're going to immediately want to look for previous swing highs or previous swing lows. Now if market structure was bearish at the moment, then you're going to target previous swing lows. It's as simple as that. But at the moment, because daily market structure is bullish in the sense that you have a high high, high low, high high, high low, high high, high low, high high, and now at the moment you are in the process of forming a higher low, which is really really good. In fact, in order to confirm if this is going to be the higher low, all we need to do is simply not break below $1,555 over the next twenty like over the next fourteen hours, and this will be the higher low. And once this is confirmed, you will immediately look to these two levels right here. Here at $1,782.83 as well as $1,923 as the ultimate targets for Ethereum. Like, it's basically guaranteed that Ethereum will at least go to this first target. As for the second target, that remains to be seen. Of course, we're going to take a look at another chart later to determine if we are actually going to go back to $1,923. In this case, if you really do confirm that, that is a further 16% pump. For Ethereum over the period of likely, likely over the next, just within 14 days, you're going to arrive at this point right here, which is absolutely huge for not just Ethereum, but just the NFT markets or just everything that uses Ethereum. Because we simply haven't been back at $2,000 for Ethereum like more than a month at this point. And it's wild to think about because just a few months ago, nobody believed that ETH was even going to go below $2,000. So just goes to show you how quickly the crypto markets can change, and adaptation is key. If you do not adapt, you will probably die. Now, the reason why I say that price is going to target at least one of these 2 levels can be attributed back to the fact that if you just take a look at a lower time frame— in this case, I'm going to use the 4-hourly chart— there is no reasonable, like, fair value gap for you to fill in. And if you take a look at this, yeah, maybe you could argue that, hey, this is like really strong resistance in terms of the VPVR, But honestly, the markets always move on liquidity, which is tip number 2. Always keep this in mind. Now, what is liquidity? It's basically previous swing highs and previous swing lows. Now, why is there liquidity there? It's because more often than not, when retail traders see a previous swing high get taken out or a previous swing low, they immediately assume that resistance or support has been broken. And usually when resistance has been broken, you tend to go long. When support has been lost, you tend to go short. The market makers and the algorithms notice, and because of this, what often happens is after they take out all the liquidity, because everyone is looking at this level, right? After they take out the liquidity, they immediately reverse the markets. Why? It's to trap everyone that just went long here. This simple distinction right here is going to save you so much money and improve your trading so much that if you appreciate this little tip, then make sure you like this video and follow me on Twitter at underscore the art of crypto because I talk about so much more trading tips as well as things to help you make money as well as. Sharing trades and stuff. So definitely follow the Twitter if you want just the latest advice, tips from me. Now because there is no reasonable area of resistance over here, then we definitely just assume that this level is going to get hit. Of course, if that level doesn't get hit, then you start reading and reacting again. But more often than not, this statistically speaking, you are going to hit $1,782 at least minimum if you confirm this high low. Because we're dealing with the daily chart here, I expect $1,782 to get hit at the minimum, and there is also a pretty good chance that $1,923 gets hit as well. So that's going to be Ethereum on the daily chart. Now that we understand the daily chart, let's hop on to a lower time frame to see if we can identify just an entry that we can get into. And in this case, I'm actually going to draw a fib from this swing low right there to that swing high. Now why do I do that? Well, it goes back to what I just shared just now on the daily chart. Notice how you have a previous swing high here. The moment you take out this swing high, All right, you immediately reverse the markets. Why do you do that? To trap everyone who went long here, who FOMO'd. And after that's done, then you put the market back into the direction that it's supposed to go, which is why you always, always— this is pro tip number 3— you always be patient and allow the trade to come to you. Develop that hunter mentality, right? Let— just sit and wait for your prey to come, and that is going to be the way that you catch, you know, the biggest of prey. This is advice that I shared on my Twitter, so make sure you follow me on Twitter if you want more daily trading advice like that. And following that, you know, hunter mentality mindset, you never chase a trade after it has broken like resistance or support because there is always going to be a retrace. And when you retrace, that is when you enter into a long. For example, you understand that market structure has broken to the upside, so what happens then? You immediately start looking for a long. Where do you start looking for a long? Well, that's where the fib comes in handy. You draw a fib from the recent swing low to the recent swing high, and then you identify the 0.705 is usually going to be a superb entry. Like, it's going to be one of the best entries that you can get if you are looking to get in on a retrace. And oftentimes, more often than not, it's going to come in the form of a bullish order block, or at least a previous just zone of demand. For example, this is a bullish order block. Notice how the price comes right in there and bounces. So once you have that, you know, once you have your entry, again, you target the higher time frame levels. Again, This is gonna be pro tip number 4, I think, at this point. A lot of traders, they make the mistake of not identifying the higher time frame levels first before they dive into the trade, and this has 2 very, very big issues. Firstly, if you do not know what level that the higher time frame algorithms are programming the price to, then you have no idea if you should be looking for shorts or you should be looking for longs. And the second problem is going to be, where do you TP? I'm sure a lot of you can probably relate to this. Like, you jump into a trade on the 5-minute, like let's say you enter into a trade there and you take profit over here, and then the price goes all the way up to here. Now, how— like, you took profit way too soon. And if you just understood the higher time frame levels, you could have held on to the trade much, much longer and got a much bigger reward. So this simple just thing is going to improve your trading so much, you won't believe it. So now targeting the higher level and stop loss below that low. Why do I keep it below that low? Well, it's because if the market structure breaks beneath that swing low, right, you have to assume that, okay, when you enter here, if market structure breaks below that swing low right there, it would indicate that you have just formed a lower low. And when you form a lower low, it indicates that the next high is probably going to be a lower high. And that is usually where you would start looking for a short, not here. Okay, remember what I said about always waiting for the trade to come to you and never FOMOing On the first move. So once it retraces, you expect it to go even lower, and hence that is going to be my invalidation point. Now you could also argue that maybe you could just run no stop loss, right? When the price breaks here, since it's going to reverse anyways, don't run a stop loss, then you don't lose money, right? Price is going to retrace back to the entry and you can just stop your trade out, break even. You can do that, but that is generally not the best trading practice, and I would highly recommend, especially for beginners or people that haven't been doing this for very, very long, to use a stop loss. It might feel bad to lose a trade just to see it go in the other direction, but this is going to protect your account from like massive downside. Because the thing about beginners and intermediate traders, and even for expert traders to a certain extent, is that managing emotions becomes really hard because, well, you have like— the moment you get into a trade, right, you sort of have like a confirmation bias, right? You're bought into the trade, you believe you're right. And if you, if the markets prove you wrong, you tend to feel an attack to your ego. So you'll think, hey, I know that the markets are gonna go up, so I'm just not gonna run a stop loss. And usually ends up happening to most of the traders, especially if they don't really know what they're doing, is the price is going to take out their position and it's gonna go a little bit lower than expected, maybe sometimes a lot more lower than expected. And that's how traders sort of blow out of their account. And then they become really depressed, and then they go on Twitter and start being toxic to everybody, and they start saying, oh, crypto is a scam, you should— nobody should get involved in crypto, you're just gonna lose all your money. So yeah, don't be that guy. Use a stop loss, highly recommended. So this at the moment is the 4-hourly low, but now we actually want to talk about a bearish scenario. Like, even though our bias is bullish just because the daily chart is showing bullish structure, You know, in the event that things go bearish, then what are the levels that you want to pay attention to? Now, since the daily swing low is all the way back at like $1,300, you're going to want to take a look at the 4-hourly to be able to react to the markets quicker. So once either this low— yeah, if this low gets taken out, immediately start looking for a short, and you're just going to target up, basically lower. And for the target of this, I'm not actually going to say that it's going to take out this swing low because it's just so far away. Of course, if there are changes in the markets, I'm definitely going to make another video to update you guys about it. But in general, I'm going to want you to keep in mind that you can retrace all the way back to $1,450, which is at the 0.786 Fib from this swing low to that swing high, and you can still maintain bullish market structure. Either way, I am still bullish on Ethereum, and the primary reason for that is going to be Bitcoin. If you haven't watched the Bitcoin video that I posted 2 days ago, you're going to want to do so. But there is just so much imbalance over here. And there is zero resistance preventing Bitcoin from just taking off all the way to $28,000. So because of that, I expect Ethereum to follow suit. And well, my bias is going to be still looking for longs. In fact, if it retraces all the way back here, I'm gonna be really, really happy because then you can take a long here, you can build it, build along there and target like $300 to $500 worth of Ethereum in terms of gains. And if you love the video and the advice that I've shared in this video so far, then You are absolutely going to love the private Discord group where we are sharing trades. That's where you're going to have access to the trading course, and you know, we're making money every single day. If you want to fast-track your trading progress, then this is going to be the place to be. Check it out in the link in the description box below. Anyways, I hope this video has been helpful. For now, may the gains stay with you, my friend. See you in the next one. Bye-bye.