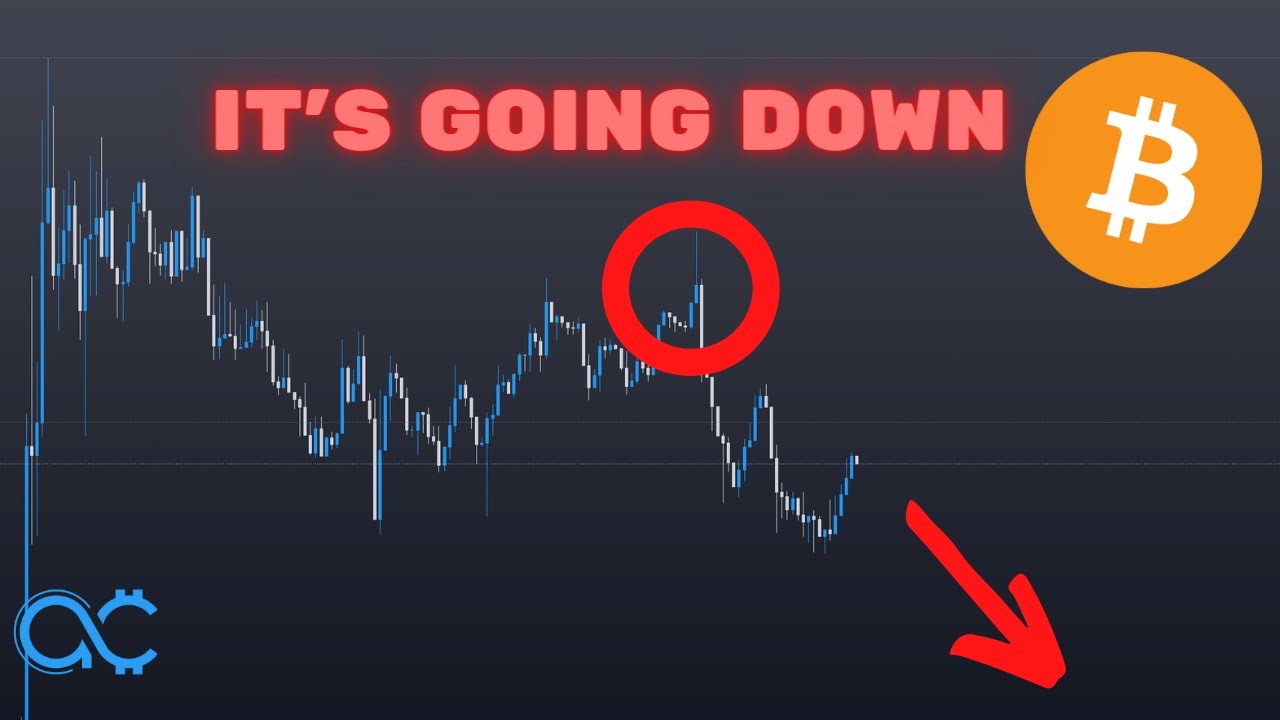
In this YouTube video, the creator (The Art of Crypto) delivers a short‑term technical analysis of Bitcoin, focusing on the upcoming London trading session. He argues that Bitcoin is likely to move lower because (1) market structure broke just before the London open, suggesting a retracement before a down move, and (2) a liquidity sweep of a 1‑hour high has trapped long positions, a classic market‑maker maneuver. He outlines a concrete short trade: entry just below the broken structure, stop above the recent high, and two profit targets (around $39,238 and a lower level near $38,580). The trade offers a risk‑to‑reward ratio between roughly 4.8:1 and 7.7:1. He then references higher‑timeframe levels – daily swing highs at $40,000‑$40,780 and a 4‑hour swing low at $38,580 – explaining how breaking these would affect bullish versus bearish bias. The speaker also discusses broader trading philosophy, emphasizing taking higher‑probability moves and understanding market‑maker dynamics. Finally, he plugs a recent Ethereum macro video and invites viewers to join a private Discord for live trade updates.
Chapters
What's up everybody, just making a quick video to update you guys on what I think is potentially going to happen today, and more importantly, why I believe that the London session for today might be leaning towards the downside. Now usually when the London session is going downwards, the New York session tends to continue, so it's more of a continuation move. But for the New York session today, I'm not actually too certain if it's going to continue to the downside. So for now, we'll just focus on the London session. Now, if you go onto a lower timeframe, you can actually see that I already have an entry plotted out, and that's going to be a short there with a stop there, and then, you know, the TP down there. Now, just looking at the lower timeframe, the reason why I believe that, you know, London could be heading towards the downside is the fact that you just broke structure prior to the London open. Now, the London open tends to happen at 2:00 AM New York time. So as of the time I'm recording this, we are about 15 minutes away from the London open. So you can see that the market structure broke just prior to the London open, and because of this, I'm actually going to look for a retracement back there before a move downwards. So this is like reason number one. And as for the TP, if you zoom into the 2-minute— in fact, actually not even the 2-minute, if you zoom into the 1-minute, you can see that there is a point of a balance over there where you have a bullish order block right there. And I believe maybe the target for London today could be there Or maybe it might hit during New York. You don't necessarily know immediately right off the bat. And there is also another low over here at 39,238, so that could be another low that Bitcoin targets as well during the London session. So that's another target that I'm going to look at, which at the minimum is going to give us a 4.78R. And you know, at the maximum, if it hits the other TP, it's going to be about a 7.7R trade. So either way, it's going to be good. Now that you understand what's you know, going on on a lower time frame, then we're going to take a look at the higher time frame to, you know, just get an idea about why I believe the immediate short term could be looking towards the downside for Bitcoin. So a couple of things to get out of the way: these daily swing highs right here are denoted by the blue lines right there, and the reason why I marked them out is because it's a level that price could potentially target and be attracted to. But that's on the daily chart. Even though I say that price could be attracted to those levels, which is at $40,000 $40,780. Those are on the daily chart. And more importantly, if you take a look at the 1-hourly chart, you can see that this high has been taken out. And when I say the high has been taken out, it means that the liquidity that is trapped above this high has been taken out during this move. And notice how the price just wicks slightly above that high before reversing. And this is very common, just, you know, market maker tricks that they like to play on retail traders, where retail is going to be looking at this like, oh, you know, price has broke resistance. And so, you know, it's time to go long, it's going to go to the moon. But that's what they want you to believe, because the moment you go long there, they're going to reverse the price. And what ends up happening is everyone who bought once the resistance, quote unquote resistance, was broken would have been trapped, you know, holding on to their longs. And if they reverse the price enough, then these longs are going to get liquidated, and the cycle repeats for shorts, and so on and so forth. That is how the markets move. The sooner you realize this, the better. But of course, there is no saying that, you know, you could by the end of the day hit $40,360 before a potential reversal back to the downside. But given that today is Thursday, and usually the high of the week, right, the high of the week as a general rule of thumb tends to come either on Wednesday or before Wednesday— it's a very general rule of thumb, it is not black and white, and it is simply a You know, a guide. So there is a risk that it might fail, but more likely than not, this theory tends to play out. And when it comes to trading, the way that you become successful trading is simply by taking the higher probability move over the lower probability move. And over time, that is how generally you become successful. So now that you understand, you know, 2 parts of why I think the price might be going down, which is a liquidity sweep of a 1-hourly high and the fact that today is Wednesday— today's Thursday actually, but as of the time I'm recording this video— the fact that you just broke structure Prior to the London open, so all of these signs just sort of add up to me thinking that perhaps today is going to go down. And now I'm going to discuss my target. I mean, in the beginning I discussed my target already, but generally speaking, if you want Bitcoin to continue to hold bullish structure, you don't really want it to break this level right here, which is at 38,580. Granted, this is a very short-term, you know, just a very short-term analysis, so a lot can change. Which is why I'm probably going to make another video next Monday. But for now, you know, these are the levels to pay attention to if you want Bitcoin to continue to be bullish. You want it not to break below this level right here, which is a swing low on the 4-hourly. Once you break this one, then you have just formed the first lower low, and potentially the next high is going to be a lower high, and bam, and you're just going to continue downwards. But if you do want to understand my viewpoint on the bigger picture for both Bitcoin and Ethereum, I actually just filmed videos recently. In fact, I just filmed an Ethereum video and I just released it today, so check that video out. It's a really helpful video, gives you a macro viewpoint of Ethereum. But not only that, there are a lot of tips and tricks in that video that will be of great, great benefit to you. So definitely check that video out. I'm going to just put it right here. And remember, if you want the latest market updates and follow along with all of the trades of me and my analysts, check out the private Discord group. The link will be in the description box below. For now, check out our Ethereum video that I will link over here. May the gains be with you. Trade safe. Bye-bye.