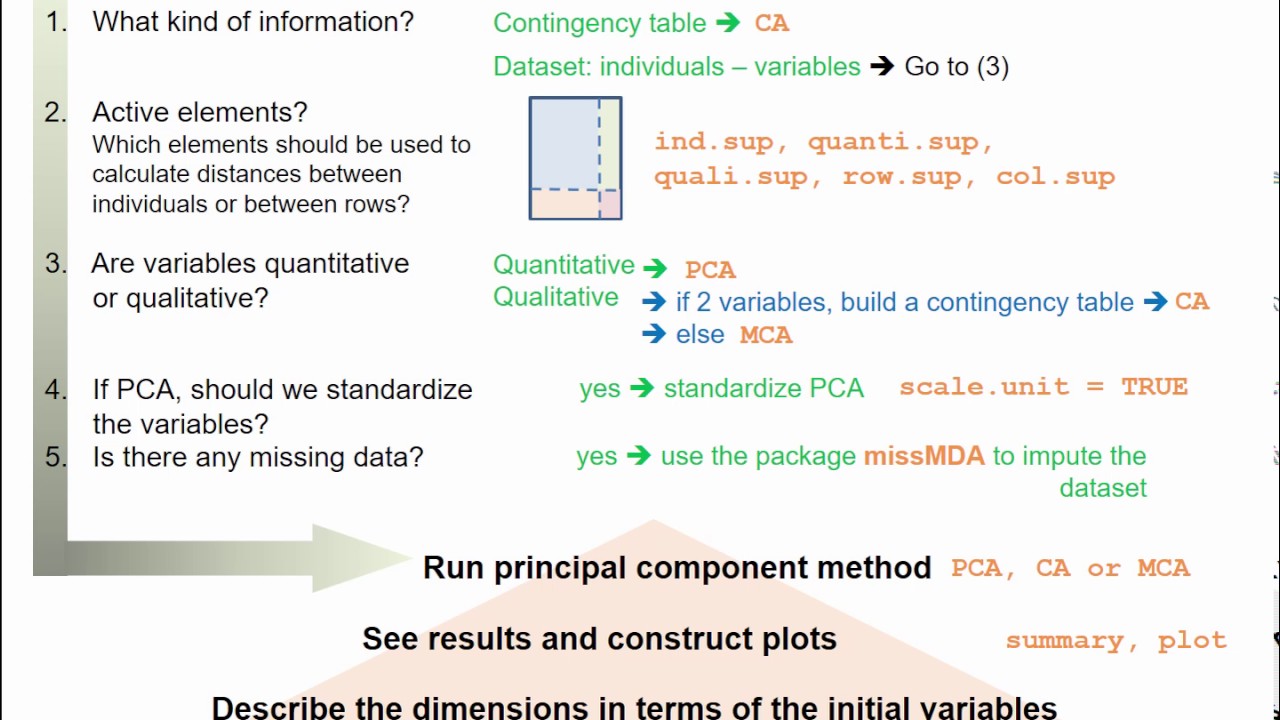
In this instructional video, the speaker reviews the full suite of factor‑analysis techniques covered in the course and provides a practical decision framework for selecting the appropriate method using the FactoMineR R package. The narrative begins by distinguishing the two main data structures—contingency tables and individual‑by‑variable tables—and maps them to correspondence analysis (CA), principal component analysis (PCA), or multiple correspondence analysis (MCA). It then explains how to designate active versus supplementary rows/columns (n.sup, quant.sup, qual.sup, rows.sup, col.sup) and how this choice shapes dimension construction and distance calculations. The speaker discusses handling quantitative versus qualitative variables, the need (or not) for standardization in PCA (scale.unit), and the treatment of missing data via the missMDA package. After the methodological choices are settled, the workflow proceeds to running the selected analysis, extracting summaries (summary.PCA/CA/MCA), improving visualisations (plot.PCA/CA/MCA), interpreting dimensions (dimdesc), and optionally clustering individuals or rows/columns with HCPC. The video concludes with two extensions: Factor Analysis of Mixed Data (FAMD) for datasets containing both quantitative and qualitative variables, and Multiple Factor Analysis (MFA) for highly multidimensional, multi‑source data with grouped variable blocks. The speaker emphasizes the importance of balancing information across sources and maintaining the factor‑analysis framework throughout.
Chapters
In this final video, we are going to summarize all of the methods we have seen during the course. Each method is considered in terms of the questions it can be used to answer when doing data analysis. To start, what kind of data and information have we been given? 2 possibilities: either it's a contingency table, in which case we are going to think about doing correspondence analysis, Or it is a table with individuals lined up against variables, in which case we can think about doing PCA, MCA, or even CA. Suppose for example that we have a contingency table. This means running correspondence analysis using FactoMineR and the function CA. Another question is which elements are active. By this we mean Which elements should we use to construct the dimensions? Which elements should we use to calculate distances between individuals or between rows? By making these decisions, we end up with a table with active elements in blue, supplementary columns in green, and supplementary rows in pink. Thus, depending on the situation, we are going to have some or all of the following terms in the code: n.sup to indicate supplementary individuals, quant.sup to indicate supplementary quantitative variables, qual.sup for supplementary qualitative variables, and rows.sup and col.sup if we are doing CA in the presence of supplementary rows and/or columns. Once the active elements have been defined, we need to know whether they are quantitative or qualitative. If the variables are quantitative, we should do a PCA using the PCA function in FactoMineR. If the variables are qualitative, 2 things: if there are only 2 variables, we suggest constructing a table for them with the categories of one variable as rows and the categories of the other as columns, then filling in the contingency table and analyzing it using CA. And in the case where there are more than 2 qualitative variables, do MCA instead, this time with the MCA function in FactoMineR. 4th question: if we decide to go with PCA, should we standardize or not the variables? We have seen that if variables are given in different units, it's necessary to standardize them. Now, if all the active variables are in the same units, we can decide whether to remove some or not. Standardizing the variables will go hand in hand with giving the same importance to each variable, whereas keeping all variables goes with assigning more importance to variables with higher variance. So, if we standardize the variables with PCA, we must put scale.unit= TRUE in FactoMineR when using the PCA function. 5th question: Is there any missing data? If we have missing data, it is helpful to use the missMDA package alongside FactoMineR. The missMDA package helps us to impute missing data. Then, with the resulting full data table, we can use standard PCA or MCA on it. So, these are 5 important questions that need to be answered before running analysis. Now that this has been done, we can run the principal component methods we desire. Depending on the type of data we have, this means doing PCA, correspondence analysis, or multiple correspondence analysis. Next, we obtain the results and output plots. This means looking at the results using the summary functions like summary.PCA, summary.CA, and summary.MCA. Then, if we want to improve the automatically output plots, we can use the functions plot.PCA, plot.CA, and plot.MCA. Then, it is always interesting to characterize the principal dimensions in terms of the initial variables. In order to do this, we can use the dimdesc function on the factor analysis results. Then, perhaps, we can do a clustering of the individuals, or a clustering of the rows or columns in the CA case, after running the factor analysis. After doing the clustering, we can try to characterize the clusters found using the initial variables. To do the clustering, we can use the HCPC function in FactoMineR. Now, let's talk about a few direct extensions of these factor analysis methods. Firstly, it may happen that some variables are quantitative while others are qualitative in the same dataset, and we want all of them to participate in the construction of the axes. That is, we want all of them to be active variables. How can we manage this? A first idea is to divide up the quantitative variables into classes. In this case, we are left with only qualitative variables as active and can run an MCA. But we lose something by doing this, by removing some of the quantitative information from these variables. So instead, if we want to keep the quantitative variables in the game, we can turn to what is known as factor analysis on mixed data. This can simultaneously take into account quantitative and qualitative variables as active. The function to do this in FactoMineR is called FAMD. A second situation, which is seen more and more often, is highly multidimensional data, coming from different information sources. Here, the data can have a group structure, and the idea is to define a set of individuals in terms of different groups of variables. In one group, the variables can be quantitative, in another qualitative, so we end up with these different groups of variables, and even contingency tables. For example, the data structure could be 3 groups of quantitative variables, 2 groups of qualitative variables, and a contingency table. And what we want to do is to compare individuals using all these information sources simultaneously. In order to do this, it's necessary to balance the information provided by each information source which can be done using what is called multiple factor analysis. This can be run using the MFA function in FactoMineR. This is a very useful extension to the methods we have seen, in which we remain in the factor analysis framework and look for orthogonal dimensions that best represent the individuals. And there you have it, the methods seen in the course, along with a couple of extensions. Thanks for listening, bye for now, and see you soon!