
Diabetes Prediction project Using machine learning | coding didi #mlwithakansha
Akansha Yadav builds a diabetes prediction model using the Pima Indians dataset and scikit-learn. She loads the data, standardizes features with StandardScaler, trains a Support Vector Machine that reaches 77% test accuracy, and shows how to make predictions on new patients. She suggests comparing other models like logistic regression and random forest.
Chapters
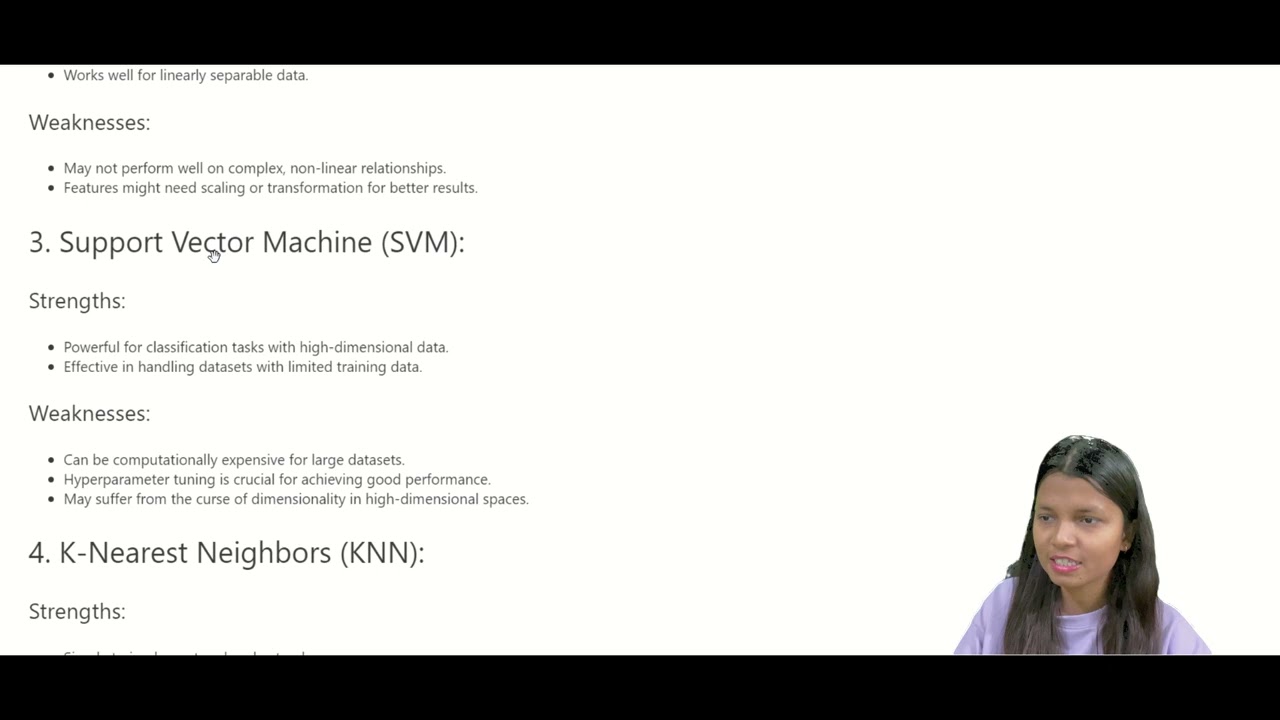
Ladies and gentlemen, hello everyone, welcome back to my YouTube channel. In today's video, I will tell you about one project which is for beginners, and that is the diabetes prediction. So let's get back on the screen and see what are the details of this project and how to build it. So basically, it is the project objective. I have written the objective of this project is to build a machine learning model where we are going to predict whether that person has diabetes on the basis of the certain features which I have written in the data. So for doing this, what I— what do we need is we need a Python library, Pandas and NumPy. Along with that, we need an updated version of Python. We need a scikit library, matplotlib library. So this is our data. This is the sample of our data where we have the pregnancies, glucose, blood pressure, skin thickness, insulin, BMI, diabetes, uh, pedigrees, function, and then we have the age and the outcome. Outcome is our target variable. So these are the details of the data that we have. So I have already written the code for this project, that is predictions. So first, what do we need is we need the dependencies, it means the libraries to work on. One is the NumPy library, then Pandas library, and then another we need a sklearn library. So according to the sklearn library, we are importing all the necessary functions and the things that we need. After that, we have to load the data. So for loading the data, we need the path of the data that where you have saved it. So once you know the path of it, you have to copy it and paste it over here. And then you can do the pd.read_csv because my data is in the CSV file. Once I have loaded the data, I have to read it and check it whether that data has been loaded or not. So I'll just remove it. And here I am reading it. I am reading the first 5 rows of the data using the head function, which gives you the first 5 rows. So 0, 1, 2, 3, 4, which example that I have shown you, all the columns we have: pregnancy, glucose, blood pressure, skin thickness, insulin, BMI, diabetes, weight increase, and age and outcome. Then we need to check how many rows and how many columns do we have. So in total we have 768 rows and 9 columns. So let's see what is the statistical measure of the data. So I know that now after printing the describe— using the describe function I have printed it. So using it I got to know that there are in total 6— 768 data and there is no missing value out of these. And then I know the mean value, standard deviation, minimum value, 25%, say 50%, and 75% value, and then the maximum value as well. So what do we have over here is we have in total 9, but out of these 9, 1 is our target column. So outcome is the target column and all these are the features. So I wanted to know how many values are there in outcomes and what is the division between them. So in outcomes we have 2 values, 0 or 1. So I have printed the value count of the outcome variable using the function saying, uh, value_count. So here gives me an output that 0 are 500 and 1 is 268, where 0 means that the person is non-diabetic and 1 means the person is diabetic. After that, I have to do the groupby of the output function to check the mean with reference to all other parameters or the features that I have. So on the basis of the pregnancy, 0 is 3.29, which is the mean value, and so on. I have printed after that our task is that I got to know over here, descriptive one, that I don't have any missing value. So I don't have to handle any missing value. I just have to go and I have to create a model on this. So if you have any missing value, you have to deal with that. You have to resolve all the errors and everything. If not, then what we have to do is we have to separate the data and the label. So label is something which is the output— it means the output column, we can say, or the outcome column. And X is something which is the entire data. So diabetes dataset, I am dropping outcome because I don't want outcome to be in the features or the data, data. And in the y, I don't want any other data, I just want one column, so that is the outcome. Then I am printing it, I am printing x, and I got that output outcome column is not there in the data. Then I printed y and I got that only the outcome column is there. So it means we have successfully split our data into x and We have considered X and Y successfully. Next is to do the standardization of the data that we have. So for this, you have to use the StandardScaler function from the sklearn, which we have already imported above, which we have already imported above over here. So I just have to use it to scale our data. Then I have to fit the scalar data with the X. Like, I have to fit— I have to give the data to the scalar function, and I am giving the X data to the scalar function. After doing that, I have to transform my data. To transform the data, we have to mention, uh, what do we want to transform. So I wanted to transform the X data, which consists of the entire data except the target column. Then we have to print the standardized data. So I have printed all the standardized data. Now I have two things. One is my standardized data into the X variable. Another one is the outcome variable. Now we have printed and both are in the array. So that was the main thing, because in the— if you are creating a model, array is very important. Following up with the train test split so that I can split my data into 80/20 or 70/30 ratio to get the perfect efficiency and the accuracy. So I've used the train test split method to do it. I have defined X and Y, then test size is something you have to define, which is how much do you want it to be split. So I want 20/80, so 20 is 0.2 and then you have to write the stratify on which value you wanted to do it, and then the random state. Then I am printing the shape and I got this space shape over here. There are multiple models that you can implement on this. On the basis of the strength and the weakness, you can choose which one you wanted to use. But in my project, I have used SVM, which is support vector machine, because it is powerful for the classification task with a high-dimensional data and effective in handling the data with a limited training data. So we don't have a big data, we just have the data which has 768 rows, so which is a small data obviously. So if you have a limited training data, I have selected SVM. You can choose any of them, KNN also, or logistic regression, or random forest. So we are right training the model. So to train the model, I am using the SVM model, SVC. Then kernel I am defining at linear, then I am training it onto the X_train and Y_train. I have already created a model. Now I have to do the model evaluation. To do the model evaluation, I have to use the classifier variable which I have already used above in the training, and then I am predicting what is the X_train, and then I am checking the training data accuracy, whether what is the accuracy of this. So I got to know that the accuracy is 78% of the training data. Now I am doing it same with the test data on the basis of X_test and X_test prediction and y_test. Now I got to know that the accuracy is 77%, which is pretty good. So it means my model is working fine. I have the good model with a good accuracy score on the both training and testing data. Now it's time to test it whether this model is working fine or not. So what I have done is I have created an input variable, and in this input data variable I have written different values, random values on the features like pregnancy 5, glucose 166, blood pressure 72, skin thickness 19, and so on. Now what I have to do is I have to see input data as a NumPy array. So I have to convert it into the NumPy array. So using the NumPy library, I will do it. Then I have to reshape it. To reshape it, there is a direct function called reshape, and then you have to write down the, uh, we are predicting it for one instance. So I will write as the, uh, what exactly we need as an array. Then we have to standardize our input data because obviously other— when we were training the model also we have done this. So we have to transform it and we have to standardize our data. So once we have standardized, we have to predict whether that person has diabetes or not. So what I have done is I have added a classifier. I am saying that predict, and this is our standard data that I am providing it to you. And now you have to print the prediction. So once I have the prediction, prediction will be in the array, and I am not sure what that array is gonna be. So I have said that if the prediction is it means the first value of the prediction is 0, then that person is a— is not a diabetic, else the person is diabetic. So wherever it says 0, 0, 0, 0, 0, 0, it means that person is a diabetic. So that's how you can create it. I have some general recommendation for you. To start with a simple model, you can go with the random forest and logistic regression, which are often a good point due to the interpretability of and the efficiency. You can evaluate on the different model. What you can do is you can create 3 to 4 models and then, then compare all of them, which one is giving you the best accuracy. And whichever is giving you the best accuracy, take it further for the, uh, testing of the model. You can consider a trade-off between the complexity and the interpretability. While complex model might achieve higher accuracy, and simpler model can easily understand and explain you what you have done it. So I hope you like this video. Don't forget to hit the like button and subscribe to the channel so that you can stay tuned with the projects and other updated things on artificial intelligence and machine learning.










