
Stock Market Charts with mplfinance Library python 2024 | TCS stock #mlwithakansha #stockmarket
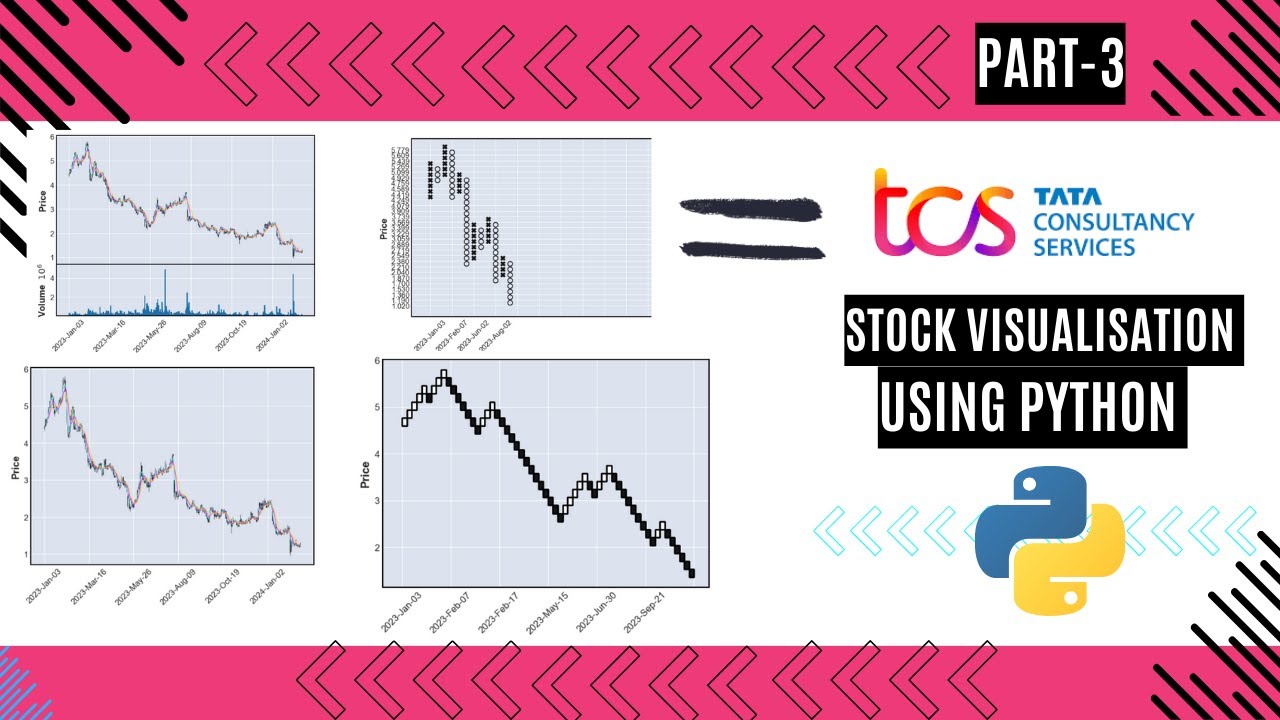
In this tutorial, the presenter demonstrates how to create advanced financial visualizations for the Indian IT company TCS using the Python mplfinance library. After briefly introducing the need for mplfinance beyond Matplotlib and yfinance, they guide viewers through installing the library (pip install mpf) and loading pre‑retrieved stock data into a variable called stock_data. The video walks through generating a variety of chart types—standard candlestick, line, Renko, Point‑and‑Figure, OHLC, and volume‑overlay candlesticks—by calling mpf.plot with appropriate type arguments and parameters (e.g., different candle widths, combined price‑volume plots). The presenter emphasizes that this is the third part of a series, encouraging viewers to watch the earlier videos for background on yfinance and Matplotlib integration. The overall aim is to showcase mplfinance’s extensive capabilities for financial plotting in a concise, step‑by‑step manner.










