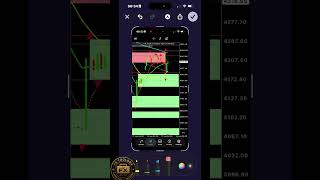
In this market commentary, the speaker—based in the UK—examines the current gold price chart, highlighting a key support level marked by a purple line and a confirming green candle. He discusses the need for a decisive breakout, either to the downside (bearish) or to the upside (bullish), and anticipates a possible fractal formation in the near term. The analysis notes that recent geopolitical events (e.g., US‑Iran tensions, Hezbollah‑Israel clashes) are exerting less influence on gold’s volatility, suggesting an imminent breakout. He references Commitment of Traders (COT) data showing institutions long on gold and short on yields, interpreting this as a bullish signal, while also noting the Federal Reserve’s dot‑plot indicating no rate changes until next year, which could support a bearish move toward the $3,500 level. The speaker cautions traders to stay conservative with lot sizes, avoid overconfidence, and follow the actions of larger market participants, concluding with an invitation to discuss further in the community.
Chapters
Morning everybody from the UK. So I'm staying in a little place called Bushy and we're leaving to go to today to go to the exhibition at Expo. So regarding the charts, I'm seeing something very interesting here. So where this purple line is, you can actually see some sort of support level here, and this green candle here is definitely indicative of what I'm talking about. So there's definitely something happening within this area over here, whether it's demand or supply, we don't know yet. We'll have to wait for a proper breakout to understand the direction. So a proper breakout, I would say, below this level over there on the bearish side, and a proper breakout north. I'm thinking we're probably going to get another fractal like somewhere around here. To get a fractal here somewhere, maybe on the next couple of candles. It may be over there, but I'd really want to see a breakout past this point to know that we're actually going north. But then we've got this supply zone over here to worry about. What I am noticing is that the effect of the war on the chart is getting less and less, so there's less of major movements when there's an announcement that the US has bombed Iran, or that Hezbollah has attacked Israel, or Israel has retaliated back in defense. But I'm definitely seeing less and less of the larger moves than we were seeing previously, which shows me that there could be a breakout that is imminent really soon. Okay, in a direction, I'm not sure, I'm hoping north. Because COT is long on gold, the yields are short. So, you know, the institutions are saying that the interest rate is going to be dropping, which means that— that's why it's short, which means that gold could pump. But conversely, the dot plot, which is the governors that vote for interest rate change, nothing is happening until next year. So possibly we're gonna see another bearish move down to that 3,500 level, which is what we've been talking about. There we go. It's about— yeah, it's about this area over here where everything started. This is where the major move basically started, within this area here. Yeah, there to probably there, and there's where it really started to happen. So we could possibly see further south move. It's another $400, $500 to go, but we can't be certain of what is happening until it happens. We just need to be conservative and not be rambunctious with our lot sizes and cocky that we know exactly what's happening, because we don't. There's bigger players out there that understand what's going on, and we just have to follow the trend. So that's what's happening, that's what I'm seeing, and I'll chat to you on the groups. Cheers.