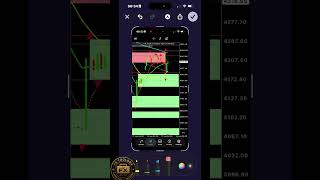
June 19 2026 XAUUSD Live Trading Analysis

In this live trading segment, the presenter analyses the XAUUSD (gold) chart, noting that price candles remain below the 8‑period EMA after a $180 drop. He explains that a previously identified demand zone is now mitigated, reducing its reliability, though residual buy orders may still exist. A fair‑value gap is highlighted as needing to be filled, suggesting further downside pressure. The price is currently around $4,075, with the speaker projecting a move into a support area between $4,031 and $3,992, potentially even near $4,000. A dragonfly doji with a long wick that penetrated the $4,000 demand zone reinforces the bearish bias. The overall market stance is described as “risk‑off” and highly conservative, with a recommendation to await further discussion in private group channels.