Alpesh B Patel OBE uses AI to back-test investment strategies across 46 years of NASDAQ data. The NASDAQ has returned 11.79% annually since 1980. Buy-and-hold beats sell-in-May, best-six-months, and January-effect strategies, helping investors stay calm during market swings.
Chapters
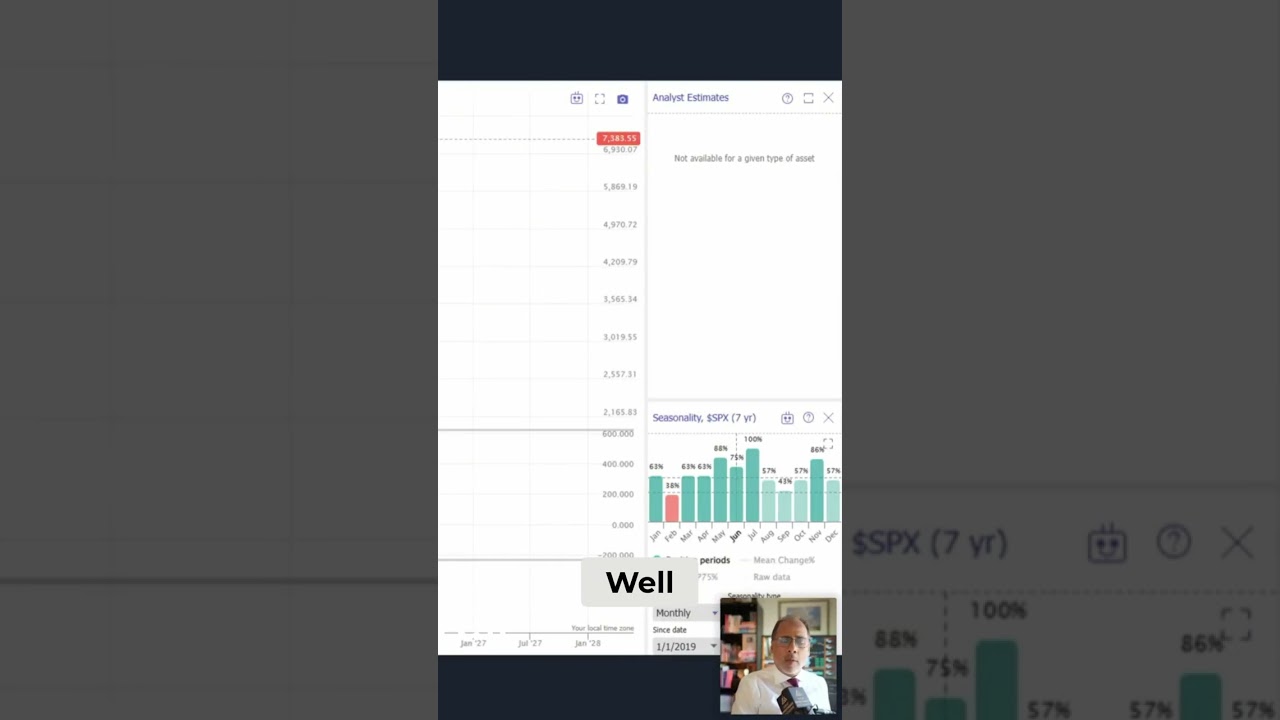
Week 23, week 24, week 24, really good next week. Okay. Historically doesn't mean it'll happen. 68% number, 229 observations. Can you see why we're doing it that way? We've got the data so we can. The great thing is AI can pull all this together for us and create it into a, into an app. Can people see that clearly? Hopefully it all depends on your screen resolutions. Overall, the annualized return over 46 years has been 11.79%, which isn't bad. Okay. But actually over the last few years, it's been significantly higher because 46 years hasn't been the greatest. We've got a grid where we can look at it year by year, so you can go back and back and back. I'm going to look at all 47 years if you wish. There you go. Uh, since 1980. And that's how it's done. And the reason we show clients this is just again, so that they remain relatively calm that this is what tends to happen. Okay. On a year by year basis generally, so that they again, limit the panic. We can also backtest various things such as should you buy and hold? Again, we're going to the NASDAQ. You'd get that return. What if you sell in May and go away? You're only holding November to April. Well, that's not good. Summer only, do the opposite. Not good. Best 6 months only, long only the 6 historically strongest calendar months. And can any of you are thinking, why don't I just invest for 6 months a year, the 6 historically best calendar months? That doesn't work either. January effect, long every January, cash the rest, not so good either. Okay. So the buy and hold, funnily enough, worked the best on that.