Week 23 and early June typically drop about 1% half the time. Backtesting shows buy-and-hold beats seasonal strategies, returning roughly 11%. A dashboard helps clients avoid panic selling during expected dips.
Chapters
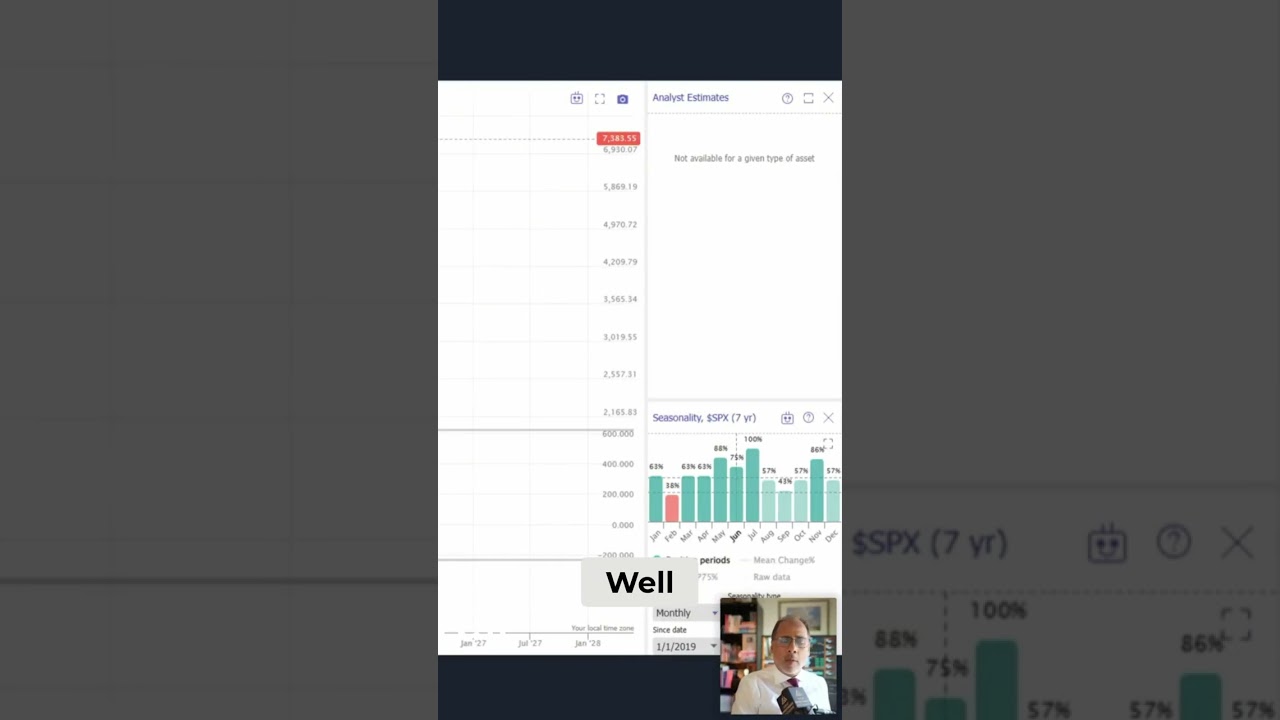
Other people will be thinking, oh my God, is this the beginning of the end? Which it could be. And the reason we show clients this is just again so that they remain relatively calm, that this is what tends to happen, okay, on a year-by-year basis generally, so that they again limit the panic. We can also backtest various things such as should you buy and hold? What if you sell in May and go away? You're only holding November to April, best 6 months only, long only the 6 historically strongest calendar months, okay? So the buy and hold, funnily enough, worked the best on that. If You want 11 points. Now we want more than that because as a professional fund, you'd— our clients would expect us to target more than just the index. Okay. Otherwise they just get the index. You can later on come back to some of the themes like semiconductors, which has been a— well, other than the next— well, generally the 23rd week of the year, 50% of the time it's down and it's down by 1%. The next few weeks tend to be good. This tends to be a fairly bearish week. If you wanted to know why is it down at the moment? Well, the week tends to be a bad one. And my clients know this, so they know not to panic, but other people will be thinking, oh my 'God, is this the beginning of the end?' It could be, but it tends to be that these two weeks, week 23, first week in June, tends not to be pretty good. We were already ready for that. And by having this dashboard for clients, it's not to get them to trade. As I said, it is actually to do the opposite. It's get them not to trade.