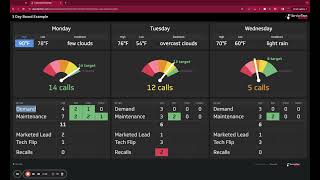
A walkthrough of a three-day call board for HVAC companies. The board displays weather, capacity, scheduled calls, and targets: 90% capacity for the next business day, 80% for the second, 70% for the third. It's designed to fit on an office screen at a glance.
Questions this video answers
90% of capacity.
80% of capacity.
70% of capacity.
I'd like to go over the three day call board example using some sample data. The board is designed to be displayed on a large screen in your office. It's 100% customizable. This layout is very simple and easy to read. At a quick glance, I have found the dashboards that you can understand while walking by them are best. First, we bring in the weather in the area for the next three days. This is for a heating and air conditioning company, so capacity depends upon the weather. This is our capacity graph. This is how many calls we have scheduled right now. This is our target that we set. Target can be changed as needed. By default, I have the target for the next business day at 90% of capacity. This is our capacity. I've split mine up into business units, demand and maintenance, total quantity of calls in those units. And this is how many of those calls are replacement opportunities. So for example, we have two demand calls where both indoor and outdoor are of the age where replacement may be needed. And then indoor only and outdoor only. I have our marketed leads and tech flips, which in service titan are referred to as lead turnovers. And then I have recalls here at the bottom. This is for the next business day target by default is 80% of capacity. And you'll see that we have a few recalls here or two recalls on the board. And then the third business day target is 70% of capacity. Very simple, very easy. There you go.