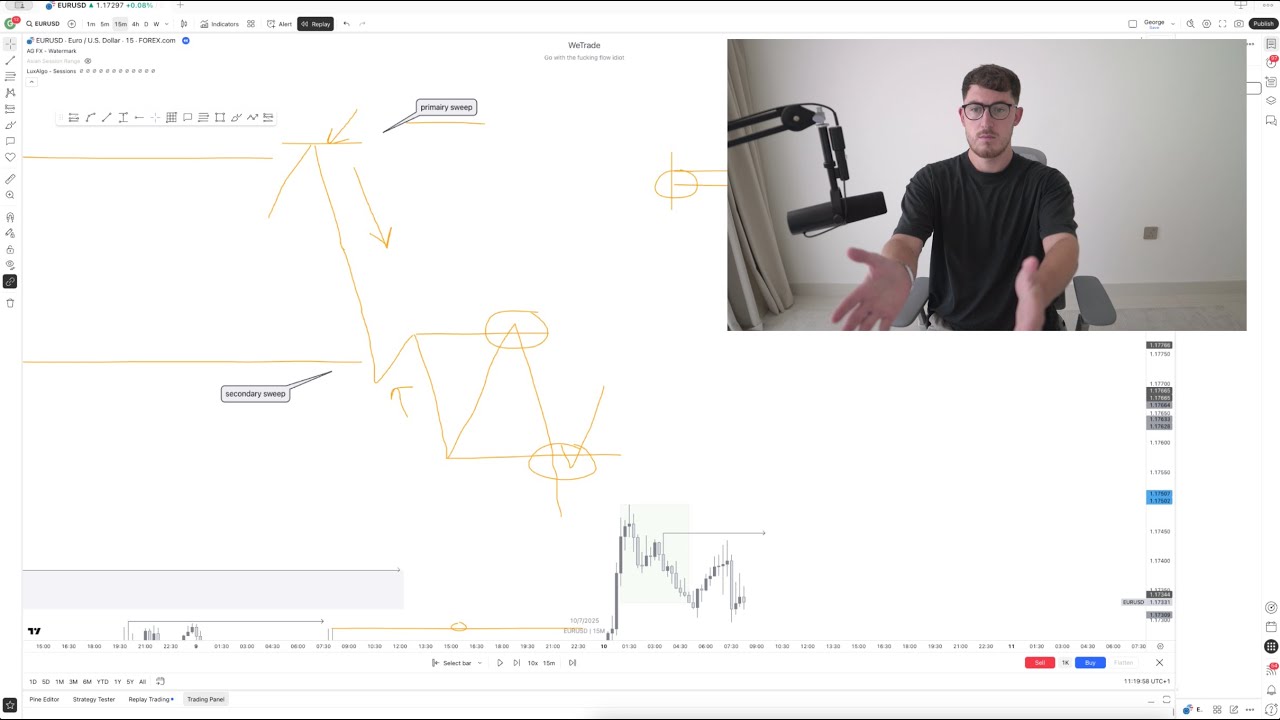
A live market review walking through recent trades like a GBP/JPY long up 2.4%, current positions in EUR/NZD and NZDCAD, and a gold bullish setup. The presenter shows how he uses higher timeframes to find support and resistance, then zooms into 4-hour and 1-hour charts to spot patterns and confluence points like falling wedges and double tops.
Questions this video answers
There is a calculator; I’ll share it in the community later.
The webinar will be uploaded to YouTube later in the week.
I’m not qualified to give tax advice; we’re working with an accountant to provide proper guidance.
Chapters
Okay, so for those of you that are here already, um, we'll start by going through the charts. Okay, so I'll be having a little look through my watch list. I'll have a little look firstly at some of the trades that I've been in this week and some of the trades I've shared with my team. Um, we'll have a little review and see how those have got on. Then we'll have a look at some of the positions that I'm potentially looking to get into for the rest of the week. And at the end of the webinar, we'll do a little Q&A session, and then I've got a fantastic offer for those of you that aren't members. I've got an offer there for you as well. So I'm going to change my mic over real quick. I'm just going to stick these headphones in. Still got that problem. Right, okay, that should, that should sound a little better for those of you that are experiencing the crackling. Really not sure what's, what's going on with my mic, but I spend all this money on a fancy mic and I've just got to put headphones in. Rather annoying. So yeah, for those of you that I've just joined, because a lot of you have just joined. Um, we'll start by going through the charts a little bit, have a look at some of the positions that I've been in this week and some of those that have closed this week. Um, and then we'll have a look at some new positions, some fresh positions that we're potentially looking to get into the rest of the week. Then we'll do a Q&A session at the end. And then for, um, and then for those of you that aren't already members of the team, I've got a fantastic offer for you if you do want to continue learning with me. Um, so what is the time? We'll give it another 30 seconds and then we'll get straight into it. But for those of you that aren't part of my team, for those of you that aren't members, um, whereabouts are you from? I know we've probably got a lot of people in the UK, but let me know, are you from abroad? Whereabouts are you from in the UK? What's your trading experience like? Also guys, just to point out, for the start of the session, um, for the start of the session, um, whilst I'm going through the charts and stuff, use the chat box, um, use the chat box as your primary place, and then when we get to the end, um, I'll open up the Q&A section and we can just fire questions through there and make it a lot easier, um, so I don't miss any questions. Ireland, Ireland, Essex, Essex, living in Canada, from Newcastle, Manchester, Isle of Wight, South Wales, Southampton, Brazil, Lincoln, West Midlands, all over the place then, all over the place. All right, cool. So it looks like we slowed down a little bit now, so let's get straight into it. So let's have a little look through some of the positions that we've been in this week then. So firstly, starting on GBP/JPY, I know this position that myself and some of my team members have actually just hit take profit on, so let's have a little look what we've got here then. So first and foremost, using the higher time frames here, um, weekly, daily, we can clearly see here that we have found and created a clear floor within the market. Okay, so we've, we've created a clear level of support that we've tested a number of times and we've failed to break out. Okay, so we've got 1 test, 2 tests, 3 tests, 4 tests, 5 tests, 6 tests, and each time we've had a nice rejection away. Okay, now this is significant because what we've done is we've we've had a really, really strong bullish run. We've sat ourselves back on top of this level here, forming this level of support. So combining that bullish momentum to start with, with that strong level of support being, um, being created there, we can expect the market to continue its move to the upside. Okay, we can, we can expect that the buyers are still somewhat in control of this pair. Okay, so now we go down to the lower time frames again, daily time frame pretty much telling us the same thing. This shows us in a little bit more detail this level of support. Going down again to the 4-hour time frame. Now this is where we can begin to sort of see the construction of, of the pair or the position that we're looking to trade. Okay, so what we can see here first and foremost is clear levels of lower time frame resistance/support. Okay, clear key levels here. Uh, this level here is a nice demand zone. We'll see that on the 1-hour time frame. This level is just a standard level of resistance there. And what we can also see is we can see this falling wedge pattern forming as well. Okay, now this is bullish continuation patterns. Okay, so what's significant here is we've got this nice strong move to the upside. We were then forming this falling wedge pattern, which is a bullish continuation pattern, which essentially means that when we see it happening, once we see it play out, we should see that, that bullish trend continue. Okay, we saw another nice rejection away from this level of support again. A nice strong push to the upside. So really what we're waiting for in this sort of scenario here was we're waiting for a clear break above this key level of support/resistance. We're then looking for the retest before going long until, into that next level of resistance. Okay, so we called this position as we saw this nice breakout here, okay, showing clear conviction that we were going to see that continuation to the upside. All we then did was we waited for that rejection or that pullback back into that key level here that we've just broken. Okay, so we can see where it started forming here. We can see a level of support, a level of resistance, a level of resistance. We broke back up. We've now tested it as a level of support once again before seeing that bullish continuation. Okay, so a position that a lot of my team and myself took this week, um, was The buy position out of this zone here, again, it wasn't a super crazy trade, but we've got a nice sort of 1:2, 1:3 sort of position in here depending on, uh, where you manage to get your, um, entry and stuff like that here. But we can see the market pushed quite nicely up into our take profit there. Okay, so all we were doing here was trading from one zone to the next zone, um, in and out without getting too greedy. And we can see that trade has very, very nicely paid off now., for around a 2.4% gain on our money. I know a lot of my members have just posted that in our community. Actually, I think we'd be able to flick over here and be able to see. I think, I think we've actually got— there we go, Matt just took that trade there. Uh, so yeah, a few of my members have managed to jump on that. So that was a really, really nice position. Um, starting the week off quite nicely. Now we also have a position that we're currently in at the moment, or I'm currently at the moment, which is EUR/NZD. Okay, now what we can do is again, we can sort of work our way from the top down to really try and understand ultimately what's going on here. So what I'm sort of paying attention to first and foremost is the structure of the market. Okay, I'm just trying to sort of get a general understanding as to really what's going on here. So First thing I can see is a nice strong push to the upside. We've then formed this nice high here, so we've got one high. We then had a really, really strong push to the upside, and then we came back down. We've now begun to form what I'd call a right shoulder. Okay, now what this indicates to me is that we're going to potentially be seeing a reversal. Okay, so higher time frames, um, essentially what we're doing here is we're trying to understand where that next sort of logical move is going to be. So we're really based off of this sort of, uh, price action here, I'm overall, I'm probably expecting this level of support here to be tested one too many times. Overall, I think long term we're going to see a break to the downside, retest, and then we're going to see that move continuing on to the downside. Okay, but of course that's just sort of speaking in, in overall future terms, but it's good to understand where, uh, the sort of general direction is heading because that's typically where the weight of the market is going to be pushing, uh, pushing the price action to. Okay, so Taking that sort of bearish price action into consideration, we can go down to the lower time frames. We can try and find some potential short positions. Okay, so, um, we had to go quite far down to sort of begin to see something here. So the position really came from this 4-hour counter-trendline break that we saw. Okay, so we can see that there is clear bearish momentum here. Okay, we can see that the market is clearly moving in a downtrend here, um, or I mean longer term it's more, more so sideways, but we can see that we're moving down, um, we're moving down in this most recent price action. Okay, so what we did was we marked out this trend line here and we really had two scenarios. Okay, so, um, based off of what we're seeing here, we've got a bullish trend line. When we get to this point here, we've got two scenarios. Okay, so number one, we're either gonna test this region here, and we're going to go for another push to the upside. Okay, scenario 2 is we're going to see a break to the downside. Okay, so one of them indicates a trend continuation, one of them indicates a trend reversal. Okay, so again, not really worrying too much about what happens, we can just be reactive to the market. Okay, so what I was looking for here was that reaction. Okay, we saw initially, we saw a push to the upside A lot of people would have gotten long here, but again, that position really didn't sort of come to fruition. We ended up coming to sort of test these— test this previous high here, and we couldn't, we couldn't break above it, okay? We couldn't break above. If we were to break above, we'd have probably been opened up for a nice move to the upside, but we ended up rejecting away. We had a big engulfing candle away from that level, and we ended up coming down and breaking this counter-trend line and this level of support, okay? Now, when we see this this is our first visual indication that we can then look for trend reversals, okay? We can look for short positions now. So initially what I was waiting for was going to be a breakout below this level and then looking for a retest into this, uh, this key level of support/resistance there. And at this point here, I then looked for that short position down into that weekly level of support we've got there. Now it didn't come off exactly as expected, but we still managed to get set up. So as opposed, as opposed to actually hitting that level of, um, resistance, we ended up sort of slowly creeping to the downside. And then by the time we'd actually managed to pick up some steam to start moving to the upside, we ended up using our level of our EMA there as a level of resistance. Okay, so we couldn't actually break above this level to come and retest this point here. But again, we don't have to come and test this level. We can use that moving average there as that dynamic level of resistance, um, for our retest, um, as opposed to coming all the way up to, uh, to retest this level. Um, so that's exactly what we did. We came into that moving average, um, we clearly struggled to break above it with a number of rejections away from this level, um, a number of different entry signals. You had that inside bar there. Um, you had this, um, this sort of shooting star slash doji candle, um, confirmed by this bearish, uh, by this bearish candle here. So there was a number of different positions that you could have potentially got in here. I ended up getting off of this inside bar. So we had a nice inside bar there. Um, I put my stops just above these previous highs here. Again, we didn't really need to be going too far up because we also had that moving average there as, uh, the as a potential barrier from our stop loss. So if we were going to be breaking above that moving average, then, um, then we were very, very likely going to end up coming up into, into this area and potentially going long. So didn't really need to have a too, too big of a stop loss there, so just tucked it above this, this previous level here, taking out entries just as that candle closed. And my targets are at these previous, uh, weekly— at this previous weekly level of support there. Okay, so trading back into where these lows are. And we can see that the market at the moment is beginning to, to move quite nicely on its way there now. So currently running about 1.9 or so percent up, um, between 1.5 and 1.9% up. Um, market's looking good at the moment. So as long as we can sustain ourselves below this level here, I think we should see that next leg, which will hopefully, hopefully move us down towards our take profit. So guys, if at any point you have any questions, um, just, just let me know. Um, I'm gonna keep an eye on the chat box. If there's anything that you would like me to go over and explain, then, then please, um, please let me know. So that's a really nice position we're currently in. Um, markets are a little bit slow. They've started the week a little bit slow. We've of course got NFP at the end of the week, which is of course at the very heights um, fundamental event. So a lot of people will be sort of waiting to sort of see what happens with that, really. People are going to be fairly cautious for the week because it's a huge, huge NFP event. So, um, I suspect the markets are going to be a little bit slow, um, but again, we're in a position now, we've taken our entry, we've just got to be patient and see, ultimately see where the market goes from here. I'm moving on to the final position. This is a longer-term position that I'm personally holding which is a NZDCAD sell position. Okay, so let's break down really what we're seeing here then. So weekly time frame is, is fairly choppy, um, but really what we're looking at here is ultimately our key levels. Okay, so, um, we've got this nice level of support here, this weekly level of support. We've also got in and around this sort of region here. Again, I'm not going to be using, uh, exact levels, but we've got a previous high there, previous low there, a nice swing point there. So I like to sort of zone out my charts, okay? So, so to find the sort of levels that you're trading in between makes things so, so easy, okay? So you find those weekly levels and the market will just bounce and bounce between these levels, okay? If we break one, we're going to move to the next and so on and so forth. So it's really, really good to understand your weekly levels of, um, support and resistance because it gives you that sort of gated area to trade in between, okay? So That's the first thing that we were looking at here. Now, trading, just looking at this price action, um, we could see that the market was coming up quite nicely into this weekly level here. Now, I'd usually actually, just to make it a little bit clearer, but I'd usually be using zones like this, okay? Because very, very rarely is it just a line in the sand level, okay? Um, some levels of support and resistance, they're not specific prices, okay? They're areas of liquidity within the market, okay? So it's never, um, one particular price. Of course you have your psychological levels like the, the, um, 100s and the 000s and stuff like that, but if you're looking at this in sort of practical terms, it's never one specific line, okay? It's always zones of liquidity, okay? So we've got this area of liquidity that we can clearly see here with the one touch there. We've got the rejections away here, the rejections away here. You can see clear sensitivity in and around this region here. Again, another key swing point there. And what we could see was the market was coming into this region here, okay? So once we come into this level of resistance, what we're looking for ultimately is, uh, some form of reversal price action, okay? So we're coming to this level, what we're looking for was some form of reversal pattern, some form of reversal candle, something that we can trade that's gonna give us the indication that we're going to see the market reverse away from this level. Okay, so what we ended up seeing was— let me get rid of some of this stuff— what we ended up seeing— I'll actually get rid of that just to make it a little bit easier to see— was what we call a double top. Okay, now double top is one of the most common reversal patterns, and again, essentially is what it says on the tin. It's where we see two equal-sized tops. Very, very common, very, very useful reversal pattern. Okay, so once I saw this pattern, um, sort of beginning to form, I knew that what we can do is we can just wait for the, the neckline or the key level of support that's holding this double top up. I can wait for that level to break, I can then look for that retest, and then I can look to take my trade, uh, to the downside. Okay, I can get that confirmation that there is in fact a reversal happening, and then I can look to enter my trade. Okay, so Okay, now I'm actually just going to remove that for the time being. So we can see here that this really is for me the key level of support that's really holding the market up here. We can see clear rejection there. We did end up breaking through a little bit here, but again, I'm not really too worried about that. We can then see a clear rejection here as well. So that level in there for me was, was ultimately the neckline that we were looking at here. Now we ended up seeing the market breaking down below this level, coming back up to retest um, and then in this, in the sort of period of which it was doing so, we ended up breaking below this moving average once again, coming back up to retest this level as a level of resistance. So we had as confluence here, we had the neckline, of course, we had that moving average acting as a level of dynamic resistance, and then we also got triggered in by our shooting star candle there. Okay, pretty textbook shooting star. So we saw a really, really nice push to the upside Sellers were nice and attracted to those higher prices, drove the price down, which is what gave us that trigger. Once we saw the market rejecting away from that level, that was of course, um, my confirmation to get into the market. Had a slightly higher stop loss here, okay? So I just put it just above these levels here. Um, again, these sorts of things, we don't want to— we don't get tricked out by these, these candles, okay? Because what can happen a lot of the time is Um, we can see these candles forming, for example, like this. You'll then see— well, I said, okay, I'll talk you through it in a little bit more detail. Okay, so we see these candles forming, and what happens is you see the big institutions, they know that what happens when these candles are formed, a ton of retail traders will get into the market and they'll put their stop losses just above. They'll enter a sell position there, and what that does is it creates a ton of liquidity up in this region. Okay, so what could happen is a lot of the time you'll see these sorts of candles forming. It will begin to move down, but what will happen is we'll spike back up above this level, gather all of that liquidity, and then we'll spike down and continue on that move to the downside. Okay, so what I wanted to avoid in this scenario— okay, what I wanted to avoid was essentially getting stopped out. Okay, so as opposed to me putting my stop loss really, really tight, I stuck it just above these— this previous level of resistance we've got there, because that should theoretically give me enough breathing room. I knew that this was a much longer-term position. I knew that there was a more potential in this one, so I can afford to have a slightly larger stop loss. And then I've set my take profit down in these previous lows. In fact, I actually set it just above, um, the previous lows. So I set it— again, I can't remember the exact figure, but it's in and around these sorts of prices here. Okay, I didn't want to move all the way to the downside because, um, we have got that sort of more minor level there as well. But again, I'm almost certain that's going to cause us some problems. So in this position at the moment. As we can see, we saw that rejection candle away. We've seen a huge dump to the downside. At the moment we're forming a little bit of consolidation. So at the moment I'm just really keeping an eye on this area here. Um, hopefully we're going to see a break, retest, and then a move towards our take profit. Um, but again, we can just have a trailing stop. We can get our stop losses nice and tight here. Um, so if the market was to go like this and end up having a deeper reversal, um, we're not losing too much of our profit on that retest there. Um, so at the moment we're running really, really nicely, um, hoping to see that next leg to the downside, which ultimately should end up hitting our take profit there. Um, right, so that's all the positions that we're in in or have been in, um, this week. So I'm just checking through the chat box now. We've got any questions? With the momentum behind the 4-hour bullish engulfing, put you off despite the shooting star? Um, the momentum— this one here, I assume you're meaning. Um, for me, no, because I mean, we've got that weekly level of resistance, we've got this clear structural level here. Um, Okay, it's, it's something that you need to sort of— you weigh up the probabilities here. Um, we've tucked ourselves below that 4-hour EMA. So again, with any trade, you're, you're listing your, your negatives and your, your positives. I mean, if you're net positive and you've got enough confluence for that trade to be short, then again, sometimes you have to, uh, you have to sort of jump in and, um, and take that trade. I mean, there's always going to be some form of negative behind any trade, so Um, again, it's just weighing up the probabilities there, and it wasn't too much of a concern to me, um, to be honest. Um, pretty textbook setup. I'm not doing this time, but this, this time it paid off. If you want to know the settings for the EMAs, you have to buy the course, my friend. All of the information about what settings I use is built nicely into that program. So Let's jump through then onto some potential positions that we are looking at for the week. So number 1, starting on gold there. So what we're doing here, starting on the weekly time frame. What do I like to do on the weekly time frame? I like to try and understand the general market structure, and I like to understand, um, I like to understand the sort of zones that I'm trading in between. Okay, so I like to find my levels. Okay, so we can clearly see here that the that gold is moving sideways for the most part. Um, on the weekly time frame, it's much more clearer than the lower time frames. But again, that's what we use the high time frames for, to try and understand that general market structure. Okay, so we can see clear level of support there, clear level of resistance, um, and we've got that mid-level in there as well. These levels here will make a little bit more sense when we go down to the lower time frames. But what, what can we see here? Uh, last week's candle we went down to test these lower prices, um, but buyers got super into it, um, they like these lower prices, and we ended up seeing the market driving up to the upside. And that weekly candle closed very, very bullish, indicating to me that we are going to see potential continuation from this bullish candle. Okay, so expecting a move to the upside. Going down to the lower time frames then, what can we see? We can see that we've got this consolidation. We can start to see where this sort of mid zone is, is sort of being created. Okay, again, it'll make a little bit more sense on the 4-hour time frame. Um, but we can also see that we've got this counter trend line here. Okay, again, this makes a little bit more sense on the lower time frames, but we can begin to speak about it. So we can see the move to the downside. We then saw that big rejection here. Um, well, this is how that weekly candle was formed. So all these candles in here ended up forming that weekly, weekly candle, that big bullish hammer candle, big engulfing candle there as well, propping us just back above this weekly level of support. Now what we've actually seen is we've seen this downtrend now essentially invalidated, okay? So we've got that visual indication that we're now going from what was a bearish trend to a bullish trend, okay? So what we can do is again we can begin to go down to the lower time frames and try and understand really ultimately what we're looking at and how we can look to get into the trade. Okay, so bearish trend line, and we're forming lower lows and lower highs. We've now broken back above this trend line, okay, which is our first visual indication that we're potentially going to see a reversal. We've also broken quite nicely above that moving average once again, and we're sitting on it quite nicely there as well. Okay, so we're beginning to really, really line up, um, a potential— well, a nice long position here. Now the last 4-hour candle was actually quite enticing there. Um, so a lot of people— I assume that some of my team would have probably jumped in on this— that 4-hour engulfing, engulfing, that 4-hour hammer candle there could have been a nice entry signal. Um, so that could be a nice trigger, um, rejecting away from that weekly level of support there as well. And we've got that breakout retest move essentially. So this here could be a nice trigger for that potential long position. But ultimately what I'm expecting to see happen here is um, a push into that sort of mid-level there. Okay, we've really got two levels. Okay, so we've got this level here where the market was fairly sensitive to this region here. We've then got the sort of more recent price action where price was ever so slightly more sensitive to the slightly lower prices there. Okay, so I'm going to be treating this as a sort of general area of liquidity that we have to pay attention to here, as opposed to the sort of, um, line in the sand levels we've got here. This is more of a sort of general zone of liquidity. Um, it's certainly more, um, more clear anyway. So I'm really expecting the market to push into that level, and then I'm expecting to see some form of rejection. Okay, we're not, we're not gonna just blast above that level unless we've got some fundamentals behind us to really drive through, um, to drive through this price. Okay, because this is such a strong, um, such a strong area of sensitivity there. Okay, so I'm expecting the price to drive into this level, we then pull back potentially into these previous highs here before forming a higher low, before then hopefully having enough buying momentum there to drive back and break those prices. Okay, once you've broken those prices, again depending on the momentum in the market, once you've broken above that level we could potentially see a strong surge in price there. However, um, what's sort of more sensible to forecast would be um, sort of a break into, for example, this mid-level there, potentially then that pullback into this region before going on to hit the top of that weekly, um, to hit the top of that weekly level there. Okay, but essentially we're predicting a bounce from the, from the base of this consolidation zone, and then we should theoretically see a move to the upside of that consolidation zone. Um, dollar is looking pretty weak at the moment, which is of course playing in, in the favor of seeing gold, um, gold sort of turning slightly bullish. How do you get your bias on currency pairs? Um, well, I mean, usually my bias comes from, um, the dollar for the most part. Okay, so the dollar is the largest currency, um, it holds the most weight in the market. So if you know where the dollar's going, or roughly where the dollar's going on a sort of technical perspective and, um, from a fundamental side as well, you can begin to sort of put a fairly good bias together. But again, in trading, having a bias doesn't really mean anything because with one fundamental event, things could switch— things could switch on its head pretty quickly. So you have to be able to switch in and out of biases fairly quick. But that's gold anyway. Um, should be a really, really nice position. Again, depending on how aggressive you want to be, you could take the entry here for again slightly more rewarding position. You could also wait for this retest here, you could wait for this retest here. Again, completely depends on how you want to get into the market. So moving on then, again fairly similar sort of positions here really. Um, we can see that sort of dollar weakness sort of shining through the markets a little bit. Um, a lot of setups are sort of lining up for a potential, uh, dollar weakness, but of course that can just be a trick. So we have to be sort of on our toes when we're looking to trade, okay, and understand both scenarios, okay.. We want to be able to understand how we get long and how we get short. Okay, so this is, this is the first example of that really. So NZD/USD, not going to go to the higher time frames because again it doesn't really matter too much on this position. But, um, we can see over the last couple of weeks or so we've been in this bearish trend, um, obviously off the back of seeing that dollar strength over the last couple of weeks. We've begun to see these sorts of pairs moving to the downside. Um, however, this week we're seeing dollar weakness. So again, can things pivot? Can things change? We don't know, but we have to be prepared for it. So what I've done is I've marked off my key levels here. So I've got my next sort of key level of resistance, um, key level of support doesn't really matter because we just play it by, um, this current trend here. But what have we got to look at then? So we've got this very, very minor sort of trend line here, okay? And we've had a break to the upside, given us some form of visual indication that we may potentially be seeing a temporary change in trend at least. Okay, so we had a strong surge in price, um, to the upside, and we've ended up going to test that previous level of support. Okay, now this is really where we have to be on our toes and we have to be sort of dynamic with our trading. So we've got two scenarios here. Number one, again, if we follow that dollar weakness sort of theme, we're gonna see— well, what we need to see is we need to see a break above these previous lows here. We can then look for that retest and we can trade a buy position into that next key level of resistance. Okay, so just trading zone design, very, very simple stuff. Now if we see the fundamentals switching up, um, on the next sort of fundamental event, which again we, we absolutely could do, um, again technicals would still potentially be looking, um, I mean they could be short if needs be. We could potentially see this level acting as a level of resistance once again. Okay, it would be a breakout retest move, these previous lows. If we can't break above that region, what we could have is we could have a nice move to the upside, we could have a double top, and then we could potentially see that move to the downside continuing. Okay, so this is where we need to be dynamic. Okay, I don't like to hold biases too sort of firm. Okay, I don't want to stick to a bias too much because things can change so quickly. Okay, so what I like to do is I like to give myself scenarios. Okay, so We've got a scenario to go long, we've got a scenario to go short, okay? We need to know where the market, um, where the market would dictate going long or short, okay? So really, very, very simply, we've got this level of support here. If we break above, we would have broken that bearish market structure. We can then look for those long positions. If we can— if we stay below this level, then for me, I think this— we're, we're really on, on for another sort of short position. A short move there. Um, again, we can begin to sort of build on that analysis a little bit more, um, to potentially build on the scenario and plan ahead a little bit. So again, we could end up seeing sort of a break and break retest move to the downside. That could be a potential move, but again, we just have to wait and see what happens. Okay, really we're just— what we're looking for, a break of this zone, okay? A break to the downside, short. Break to the upside, long, okay? And it's very, very similar, a lot of other positions on this sort of theme as well, okay? So EUR/USD is one that's looking, um, slightly more bearish for me at the moment. Um, so again, what we can see here is we can see that of course we're in this bearish move over the last few weeks, um, where we've seen dollar strength in the market. We've seen the market just tumbling, um, literally continually falling, huge candles to the downside, um, most recently breaking that previous low, which is of course a very, very bearish sign. However, after a strong push to the downside, you're gonna have to have that exhaustion, that correction before that next move to the downside. Okay, so really this is another position that's sort of in limbo. It depends on where we see the dollar go for the rest of the week. But we've got a few different scenarios. Now ideally, I would like to be taking price up to this region here and then looking for shorts, okay? That's, that's the sort of ideal scenario, okay? But again, we're not at that price yet. Where do we think it could potentially go? So I'm going to go down to the 1-hour time frame. Now again, like I said, it depends where we see— ultimately depends where we see the, the dollar going, okay? Is this sort of where that momentum is going? So Of course, we've got very, very strong seller momentum at the moment. There's of course lots of sellers in the market still. Could we potentially be seeing a move to the downside? So first scenario would be if we sustain ourselves below this level here, could be potentially short into, into the, into those previous lows. Now, would I take the position? Probably not, purely because of the fact that the risk to reward here, if you've got any sort of, um if you're going to have any sort of good confirmation here, is just not going to be fantastic really. Um, again, looking at best here, sort of 1 to 1.62. So again, not really, um, not really amazing there. Um, however, we could see the market over the next sort of couple of days move to the downside here and then potentially see a move to the upside. Okay, but I think the more appealing position for me personally would be if we saw that dollar weakness kicking in once again. I'd like to see a break above this level of sensitivity here, a retest back into it, and then I'll potentially be looking for my buys from this level here to go back and test that previous low there. Okay, so a move to go and test these previous lows here. Okay, we've clearly printed some nice lows there, we're sustaining ourselves below this level. So a break above this clear sort of lower time frame area of sensitivity a break above, a retest would then give me that, that potential opportunity to go long back into this sort of, uh, 1.667 sort of region there. And then when we do get up to that level, that's really where I'll be looking for those short positions, um, because that'll be a really, really nice continuation to the downside. Okay, what we'd have done is we'd have broken that floor, formed a new low, sustained ourselves below that level Okay, nice bit of consolidation, moving up, um, a nice bit of distribution there, and then theoretically we should end up seeing that move to the downside. Okay, but again, we've just got to come up with these scenarios, we've got to forecast our potential ideas, and we've just got to react to the levels that are breaking in the market. So jumping over then, GBP/USD. Again, this is one that is sort of scenario-based. We're either going long or short. Of course, but we're at a very, very pivotal zone now. Um, I can see somebody saying that they went short on GBP/USD last night at 1.36. Again, I think you're probably jumping the gun a little bit here based off of where the dollar's heading. However, you, you're not sort of— you're not lost yet. Okay, so higher time frames, what can we see? We can see that Well, we can clearly see that, that move to the downside, that strong dollar kicking into the market there. We did end up breaking this very, very strong sort of area of sensitivity there as well. Now typically, I mean, I was looking for it myself, we'd be looking for a breakout, retest, and continuation. Um, however, the dollar hasn't continued its bullish move this week, so, um, it's thrown a sort of a curveball at us. So really, ultimately, the sort of main thing that we're looking for here is, is our reaction to this level. Um, again, like a few of you have said, you've taken short positions here, but ultimately I think that, well, a lot of people would have taken action off of this shooting star candle here, um, if you can call it that. This is just a, this is just a trick candle, um, in my opinion. I think we've printed this candle here to again trick retail traders to get in short A lot of people will be doing this— stops just above, targets probably down there. Um, but again, it's just way too fucking obvious. Um, the institutions know exactly what's going to happen here. What that does is everyone puts their stop loss just above that level, creates a ton of liquidity. Um, so all these, all these institutions have to do is go and gather that liquidity, and then they can execute whichever order that they would like. So for me, um, staying out of it at the moment. But really the sort of key thing we need to be looking at here is ultimately whether we're going to break above this, this sort of area of liquidity or we're going to break below it. Okay, so for me, I either want to see a clear and obvious move of conviction to the downside and then a retest and then that move to the downside, and where I'd look for an entry on this bit here and then that push or I want to see a clear move with conviction to the upside, look for that retest, and then we can look to trade that long position, uh, into the top of this market structure here, okay? And also into that key psychological level of 1.38, okay? So again, we, we're building scenarios here. Um, not really too keen on taking any sort of position here. I think it's It's way too risky, um, way too obvious, this sort of thing happening. Huge momentum to the upside there and then a pretty weak reversal candle. It's just a typical trap, um, typical trap. Super easy to go and stop people out there. So for me, again, looking for that move of conviction, okay, we want to see where the dollar's going before we make— we take action, okay? We don't have to be super predictive with, with the trades, okay? We can be reactive. We can wait for the move to happen. We can wait for that waiting for that first sort of bout of exhaustion to kick into the market, and then we can look to trade. Okay, we don't have to be trying to predict these first phase moves every single time. Okay, we can wait for the markets to do its thing, we can wait for that first phase exhaustion, and then we can get on that phase 2. So again, yeah, very simple, looking for either that break to the upside or that break to the downside. Moving on then, again, you can see how the correlation is, is heavily through the market and how all of these dollar pairs, um, are really sort of looking basically the same, okay, across the board. They're looking basically the same. Um, Aussie dollar, high time frames aren't doing too much, but we've got Australian dollar against US dollar here, and again, we can see how similar it looks. But first things first, what I've done is I've found my key levels, I've marked out my zones across the market so I know where I'm trading in between. I know if we break one level, we're going to the next, and so on and so forth. Okay, so I've clearly zoned out my trades here. So what am I looking at? So using that sort of general theme that we're expecting that dollar weakness to kick into the market, um, we're going to use that theme in this position as well. So we've got this counter trend line here, um, counter trend line because bullish trend here, bearish trend here, so So the overall trend to me here is sort of, um, is bearish. Doing— then broke that counter trend line, giving us that first visual indication that we're potentially going to change the trend or we're going to see a trend continuation. A lot of people are going to be jumping in very, very early, but if you're buying here, you're buying straight into a level of resistance. So haven't done so yet. What do I want to do? I want to see the market make its move first. Okay, so I want to see that first— that first push phase. I then want to look for that retest into this level of what, 0.732. Okay, so a clear area there, clear key level. On this retest, that is going to give me enough confidence and enough confluence to take a long position into that next level of resistance. Okay, so we don't need to be super predictive here. We don't need to try and buy here because if we bought here, for example, we buy here We've got a level of resistance there. All that happens is the market hits that level and it comes down like that, okay? Then you've been done when you don't need to be done, okay? Your risk to reward is not going to be any better trading here than it is if we trade here, okay? So be a little bit more patient, wait for that key level to break, look for that retest, and then we can look for that continuation to the upside and try and catch that move, okay? We're not getting greedy, we're just trading zone to zone, very, very simple stuff, um, but we have to wait for the right triggers to do so. Okay, very, very important. So then we can see that heavily the market is focused on the dollar at the moment. It's the, it's the main star of the show. Um, so really there's, there's no need to sort of be anywhere else in, in my opinion. Okay, that's the sort of the main pickings that I have. All of the setups for me, or my primary setups, are really on the dollar at the moment. Um, you don't need to have a huge watch list. However, I have got a few other setups, um, across some of the equities. Um, we've obviously got oil there, commodity, and GBP/AUD, which is another position that I'm looking at. So what have we got here then? Starting on the daily time frame, understanding the sort of general context of the market, trying to understand where the next logical move is going to be. So bullish channel, strong breakout to the downside of that bullish channel, invalidating that bullish trend. Creating a new lower low, coming up to retest that level to create a new lower high, and then we saw that move to the downside being initiated. Okay, so for me, this price action is telling me that longer term, or overall, we're expecting this to come and form a new, um, lower low, then that bearish trend to essentially continue. So looking for sell positions then. We're expecting the market to move down, so we're looking for sell positions, okay? So we want to sell high, buy low, okay? Simple stuff. Let's take that into consideration. So 4-hour time frame, then we can see this clear level of support here that was holding up the market. We ended up seeing a nice break to the downside, opening up the floodgates essentially for us to come and, um, for us to come and take them short positions and for the move to the downside to continue. Now when we see a break of a very, very key level of support, we look for the market to solidify itself below, we look for the market to come back up to retest that level before that continuation to the upside. Um, so patience was really, uh, really very important here. Um, I know a lot of people got caught out trying to short this position here, but again, I held out waiting for that retest there. Um, and we did end up seeing a super nice break to the upside here, super strong shooting star candle. We came up to test those higher prices, the sellers went yes please, they executed their orders, and we can see the market reacted very nicely. We've driven the price down quite nicely there, rejecting away from that moving average as well, which is another key confluence there. So now really what I'm doing is I'm just looking for, for ways in which I can try and jump into the position. I've got enough sort of confirmation really for me to, for me to warrant taking these lower time frame sell positions. I just have to find a setup that's going to give me a good enough risk to reward. Okay, so selling, for example, selling here because you execute your order there, you'd want to really have your stop loss above that region there. So again, unless, unless you're trying to take some huge target trade, it's really not worth taking the risk of that position. So what I'm going to do instead is I'm going to use the 1-hour time frame to find some, some potential structure that I can look to trade, um, that I can look to trade from instead. Okay, so what we can do is we can see there's a clear minor level of support/resistance across this sort of general area here. Again, number of retests. Again, it's not, it's not super clean because we've just got a level of consolidation here, but it's enough for me to potentially look to get into this position. Okay, so zoom in a little bit more, we can see that we're currently sat on that moving average once again as well. So for me to warrant getting into, into this position, I'm going to look for a nice strong move to the downside with good conviction. Okay, that's what, that's what's important— good move with conviction, okay, to really tell us that we are moving to the downside. Once that happens, we then want to see a bit of consolidation to sustain below that level, look again for that retest into this region, and then that would be the point at which I'm looking to take my short position. Okay, once we're in there, theoretically we should be able to, um, we should be able to get in a nice, um, fairly good risk to reward. So depending on whether we want to trade to the base of that consolidation zone, okay, where we want to trade there, whether we want to trade to the previous lows, whether we want to trade to those previous lows, okay, or we want to look for that next key level of support to trade into where we're going to form that new lower low. We're going to have a good risk to reward there. Okay, so just because we, we can see a move happening doesn't mean we have to execute a trade. We want to get into a position that's going to give us enough, enough, um, reward for the risk we want to put on the table. Okay, so even just trading to the previous lows there, we've got 1.1 to 7.78 risk to reward with very, very good probabilities. Okay, so being a little bit more patient can actually end up making you a lot more money. So then, moving on, final two positions. We've got one equity position and one commodities position. I'll quickly glance over these before we start that Q&A session. So, um, for my members, you'll know we were looking for that move into $77. Um, we did end up seeing that move into $77, and we've now nicely surpassed it. So, um, $77 was a very, very key level for US Oil. We had a very, very strong daily close above this position, which is getting— which has given us that indication that we're potentially going to see a continued move to the upside. So what I'm looking for now again is that breakout retest move on the lower time frame. So again, not too complex here, um, we're just trading from price to price, looking for that lower time frame exhaustion to come and test this region before looking for buys, um, to that next key level of resistance. Okay, so again, not super complex stuff. I'll just be monitoring that 1-hour timeframe, that 4-hour timeframe, that move into here before taking them buy positions up to the next level, which is, which is 86. We've got 86.93 there. Um, however, I'll probably end up trading We've got 86.7. There we go then. So we've got from 77 to 87, again nicely zoned, key psychological levels. Um, we can see that it's clearly an area of sensitivity across the 87 region as well. So all we've got to do is we've got to wait for that push phase to end, that pullback, and then we can look for that continuation to the upside. Okay, so again, a super, super simple setup. Um, the Germany 30, what have we got on here? I'm pretty sure I spotted a nice little intraday position here that we could potentially be looking at. So again, um, with these equity positions, they're a little bit all over the place. You can't really trade them higher time frame— well, you can take higher time frame, but to me, I don't really like to do so. I like to sort of get in and out on these equity positions. So Germany 30, what we can see is 4-hour time frame Uh, we've created a clear floor in the market here, strong push to the upside. We've now come down to test that level once again with a nice strong position— or a nice strong position— a nice strong push away from that level as well. Okay, giving us a good indication that we are potentially going to see another rally to the upside. Okay, now with, with dollar weakness kicking in, that usually means that we end up seeing some strength coming into stocks. So again, it plays nicely into, uh, plays nicely into each other's hands here, really. So again, I'm not going to go on for too long on this position because it's really quite simple. Um, again, counter-trend line. Go down to 1-hour timeframe. Actually, we can see a bit of projection here, but again, I'm not too convinced. This is probably just to try and entice retail traders to get in short, to put liquidity up there. But what I'm looking for is We've got a clear level of resistance there, looking for a nice strong move of conviction to the upside, looking for that retest, looking for that move to that next level of resistance. Okay, so super, super simple stuff there. Really, really simple stuff. Um, very, very simple logic. You don't need to overcomplicate trading. You find your levels, you trade between those levels. Okay, you use different tools and different techniques to give you that visual indication as to where the market's going to go. Okay, to give you the idea, are we going to bounce, are we going to break, Um, but ultimately you're looking for those key levels. You break one, you move to the next. Okay, so again, super, super simple stuff. So that is it for the watchlist then. Um, I hope you've all taken some good ideas away. Um, I hope I've opened some of your eyes that are not trading at the moment to quite how simple trading can be with the right techniques. But I'm now going to move on to doing a little Q&A session. So if you guys have any questions at all for me, now is your time to enter— to enter? It's not a competition. Now is your time to ask. So head over to the Q&A box now. You should see it somewhere on your screen. You should be able to click Q&A, stick your questions in, and I'm going to fire my way through you. Um, for those of you that stick around, I've got a massive offer for those people that would like to come and join Forex Kickstarter, for those of you that would like to come and do this every single week, those of you that would like to get access to all of my training and all of the good bits that we have inside of our community. So if you hang around for just 5 or 10 minutes longer, um, you'll gain access to that as well. So What questions have you got then? So I'm going to start away from the top to the bottom. If any of them are sort of boring questions or they're just about random shit, then I probably won't answer them, I'll just skip them. But for those of— for those questions that are good, then I will be— I will be answering them. So Had issues joining the webinar. I feel that one that everyone has registered for isn't working. Um, we had a good sum of people in here tonight, so I'm pretty sure it's been all right. But if you've missed the beginning, I'm going to get uploaded to YouTube later on in the week, so don't worry about that. What do you use to calculate lot sizes on US oil? Um, there is a calculator. Um, I'll have to find it, but I'll share that in the community later on. You're a CHF, not going to answer that. I'm not going to go over some charts because that's boring, which is an hour of that. We've been releasing information about tax when trading live funded accounts. I feel like this is quite important and hasn't been mentioned yet in the course as of yet. So difficult thing about me commenting on tax is you have to be, uh, qualified to do so. Ultimately, um, it's different things I'm allowed to trade than it is giving people advice on their tax. So it's something that I'm in talks with my accountant about. Of course, there's obviously logistical problems trying to get that sorted, but it's definitely something that we're going to be looking to implement— ways in which you can structure your tax from somebody that is actually, actually qualified to, to give you advice.