Jake Xia - Portfolio Management

Jake Xia explains modern portfolio theory, risk parity, and diversification strategies. He covers the efficient frontier and walks through how to build a portfolio that balances risk across different assets rather than just spreading money equally.
The following content is provided under a Creative Commons license. Your support will help MIT OpenCourseWare continue to offer high quality educational resources for free. To make a donation or view additional materials from hundreds of MIT courses, visit MIT OpenCourseWare@ocw mit.edu. all right, let's start. So first of all, I hope you'll be enjoying the class so far and thank you for filling out the survey. So we got some very useful and interesting feedbacks. One of the feedbacks is my impression I haven't got a chance to talk to my co lecturers or colleagues yet, but I read some comments you were saying that some of the problem sets are quite hard. The math part may be more difficult than the lecture. So I'm thinking, so this is really the application lecture. And from now on, after three more lectures by Chumbung that will be essentially the remainders of all applications. The the original point of having this class is really to show you how math is applied, to show you those cases in different markets, different strategies and in the real industry. So I'm trying to think, how do I give today's lecture with the right balance? This is after all, the math class. Should I give you more math or should I? You had enough math. It sounded like from the survey you probably had enough math. So I probably want to focus a bit more on the application side. And from the survey also seems like most of you enjoyed or wanted to listen to more on the application side. So anyway, as you've already learned from Peter's lecture, the so called modern portfolio theory and it's actually not that modern anymore, but we still call it modern portfolio theory. So you probably wonder in the real world how actually we use it, do we follow those steps, do we do those calculations? And so today I'd like to share with you my experience on that. Both in the past a different area and today probably more focused on the buy side. Come on in. Yeah, actually these are my colleagues from Harvard Management, so they will be able to ask me really tough questions. So anyway, so how am I going to start this class? You wonder why I handed out each of you a page. So does everyone have a blank page by now? Yeah, actually. Yep. Yeah. Could you also pass through? Yeah. So I want every one of you use that blank page to construct a portfolio. Okay. So you say, wow, I haven't done this before. That's fine. Do it totally from your intuition, from your knowledge base as of now. So what I want you to do is to write down, to break down the 100% of what? What do you want to have in your portfolio? You said give me choices. No, I'm not going to give you choices. You think about whatever you like to put on wide open and don't even ask me the goal or the criteria based on what you want to do. Totally free thinking. But I want you to do it in five minutes, so don't overthink it and hand it back to me. So that's really the first part. I want you to show intuitively how you can construct a portfolio. Okay, so what does a portfolio mean that I have to explain to you, let's say for undergraduates here, so your parents give you some allowance, you managed to save $1,000 on the side. You decided to put into investments, buying stocks or whatever, or gambling, or buy lottery tickets, whatever you can do, just break down your percentage. That could be $1,000. Or you could be a portfolio manager, have 100 billions of dollars or whatever. Or Dan and Saif, they raise some money, start a hedge fund. They may have $10,000 to start with. How do you want to use those money on day one? Just think about. So while you're filling out those pages. So please hand it back to me. It's your choice to put your name down or not. And then I will start to assemble those ideas and put it on the blackboard. And sometimes I may come back to ask you a question. Why do you want to put this. So that's ok, don't feel embarrassed. I'm not going to put you on the spot. But the idea is I want to use those examples to show you how we actually connect theory with practice. I remember when I was a college student, I learned a lot of different stuff. But I remember one lecture so well. One teacher told me one thing I still remember vividly well, so I want to pass it on to you. So how do we learn something useful? You always start with observation. So that's kind of the physics side. You collect the data, you ask a lot of questions, try to find out patterns. Then what you do, you build models, you have a theory, you try to explain what is working, what's repeatable, what's not repeatable. So that's where the mass comes in. You solve equations sometimes, but in economics, a lot of times, unlike physics, the repeatable patterns are not so obvious. So what you do after this, so you come back to observations again. You confirm your theory, verify your predictions and find your error. Then this feeds back to this rule. And a lot of times the verification process is really about Understanding special cases. That's why today I really want to illustrate the portfolio theory. Use a lot of special cases. Can you start to hand back your portfolio construction right now? Okay, so just hand back whatever you have. You have one thing on the paper that's fine or many things on the paper. Or you think as a portfolio manager, or you think as a trader, or you think simply as a student, as yourself. All right, so I'm getting things back. I will start to write on the blackboard and you can finish what you started it. By the way, that's the only slide I'm going to use today because I realize if I show you a lot of slides, you probably can't keep up with me. So I'm going to write down everything. Just take my time. And so hopefully you get a chance to think about questions as well. Okay, I think. Is anyone finished anymore? Okay. All right. Okay, great. You guys are awesome. Okay, let me just have a quick look to see if I missed any. Okay. Wow. Very interesting. So I have to say, so some people have high conviction, 100% in one of those, I think. I'm not going to read your name, so don't worry. Okay. Okay. I'm just going to read the assets people put on. Okay. So small cap equities, bonds, real estate, commodities. Those who are there, quantitative strategies, selection strategies, deep value models, food, drug sector models, energy, consumer S and P index, ETF fund, government bonds, top hedge funds. So natural resources, timberland, farmland, checking account stocks, cash, corporate bonds, rare coins, lotteries, collectibles. That's very unique. And Apple stock gold, Google stock gold, Long term saving, annuities. So Yahoo, Morgan Stanley stocks. I like that. Okay. Family trust. Okay, I think that's. That pretty much covered it. Okay, so I would say that list is more or less here. So after you've done this, when you were doing this, what kind of questions came to your mind? Anyone wants to. Yeah, please.
To draw in my portfolio, like whether it be using cash, bills, bonds.
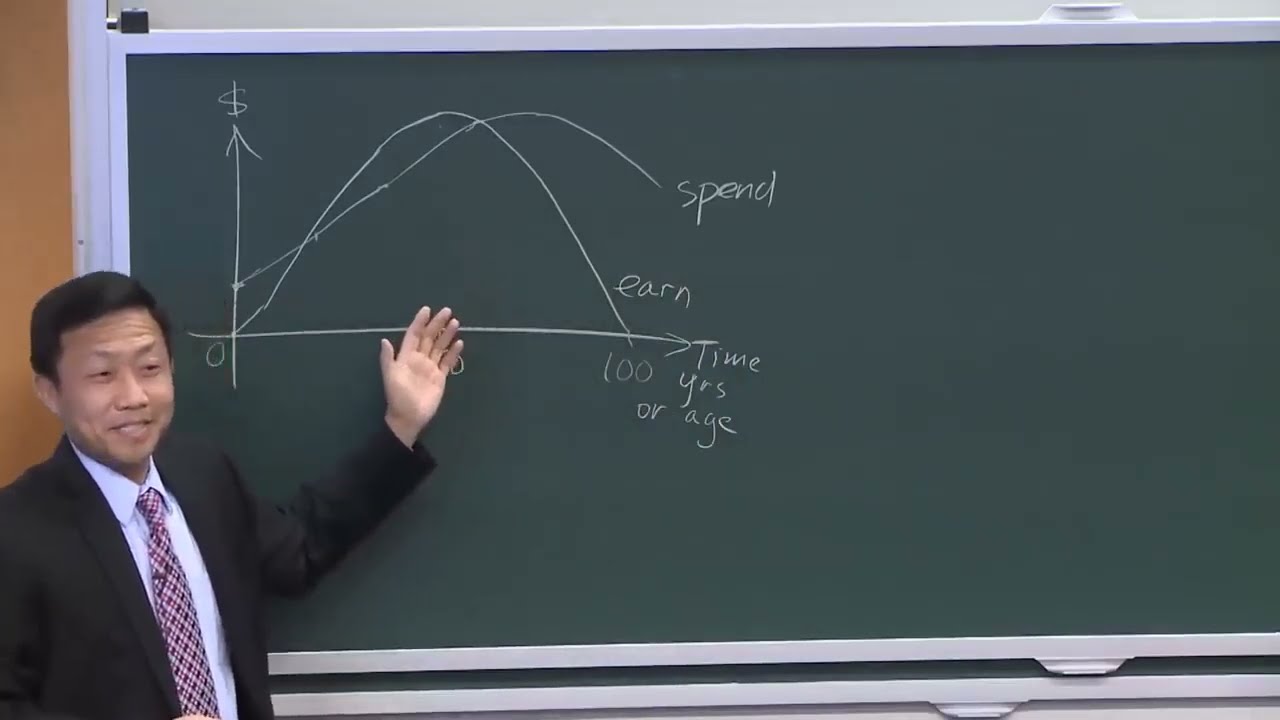
Yeah. How do you do it? Really? What's the criteria? So before we answer that question, how you do it? How do you group assets or exposures or strategies or even people by traders together? I mean before we answer all those questions, we have to ask ourselves another question. What is the goal? What is the objective? So we understand what portfolio management is. So here in this class, we are not talking about how to come up with a specific winning strategy in trading or investments, but we are talking about how to put them together. So this is what a portfolio management is about. So before we answer how, let's see why, why we do it. Why do we want to have a portfolio? Right, that's a very good point. So let's understand the goals of portfolio management. So before we understand goals of portfolio management, let's understand your situations, everyone's situation. So let's, so let's look at this chart. So I'm going to plot your spending as a function of your age. So when you are age 0 to age of 100, so everyone's spending pattern is different. So I'm not going to tell you, this is the spending pattern. So obviously when kids are young, they probably don't have a lot of hobbies or tuition, but they have some basic needs. So they spend. Then the spending really goes up. Now your parents have to pay your tuition or you'll have to borrow loans, scholarships, and then you have, that's college. Then you're married, you have kids, you need to buy a house, buy a car, pay back student loans. You have a lot more spending. Then you go on vacation, you buy investments, you just have more spending coming up, but it goes to a certain point it will taper down. So you're not going to keep going forever. So that's your spending curve. And the other curve you think about is what's your income, what's your earnings curve? You don't earn anything when you were just born. So this is spending. So let's call this 50. You're earning probably typically peaks around age of 50, but really depends, then you probably go down, back up. So that's your earning. And do they always match? Well, they don't. So how do you make up the difference? You hope to have a fund, have an investment on the side which can generate those cash flows to balance your earning versus your spending. So that's only one simple way to put it. So you got to ask about your situation. What's your cash flow look like? So you say, my objective is I'm going to retire at age of 50. Then after age of 50, I will live free. I travel around the world. Now I calculate how much money I need. So that's one situation. The other situation is I want to graduate and I pay back all the student loan in one year. So that's probably another. And typically people have to plan this out. And if I'm managing a university endowment, so I have to think about what the university's operating budget is like how much money they need every year drawing from this fund. And then by maintaining, protecting the total fund for basically a perpetual Purpose ongoing and keep growing it. You ask for more contributions, but at the same time generate more return. So if you're a pension fund, you have to think about what time frame a lot of the people, the workers will retire, they will actually draw from the pension. And so every situation is very different. I mean, let me even expand it. So you think, oh, this is all about the investment. No, no, no, this is not, not just about investment. So I was a trader for a long time at Morgan Stanley and later on the trading manager. So when I had many traders working for me, the question I was facing is how much money I need to allocate to each trader, let them trade how much risk they take. So they all said, I have this winning strategy, I can make lots of money. Why don't you give me more limits? No, you're not going to have all the limits. You're not going to have all the capital we can give to you. So I'm going to explain, you have to diversify at the same time, you have to compare the strategies with different parameters. Liquidity, volatility and many other parameters and even are not managing people, let's say. So Dan, Saif, Martin and Andrew, so they start a hedge fund together. So each of them had a great strategy. Dan has five, Andrew has four. So they all together have 30 strategies. So they raised certain amount of money or they just pulled together the savings. But how do you decide which strategy to put more money? Right, so on day one, so those questions are very practical. So that's all. So you understand your goals, then you're really a lot clear on how much risk you can take. So let's come back to that. So what is risk? As Peter explained in his lecture, so risk is actually not very well defined. So in the modern portfolio theory, we typically talk about variance or standard deviation of return. So today I'm going to start with that concept, but then try to expand it beyond that. So stay with that concept for now. Risk, we use standard deviation for now. So what are we trying to do? So this, you're familiar with this chart, right? So return versus standard deviation. Standard deviation is not going to go negative. So we stop at zero, but return can go below zero. And I'm going to review one formula before I go into it. I think it's useful to review what previously you learned. So let's say you have. I'm going to also clarify the notation as well so you don't get confused. So let's say. So Peter mentioned Harry Markowitz, modern portfolio theory, which Won him the Nobel Prize in 1990 along with shop and a few others. So it's a very elegant piece of work. But today I will try to give you some special cases to help you understand that. So let's review one of the formulas here which is really the definition. So let's say you have a portfolio. Let's call the expected return of the portfolio is R of P equal to the sum weighted sum of all the expected returns of each asset. You basically linearly allocate them. Then the variance. Yeah, let's just look at the variance. Sigma P squared. So these are vectors. This is a matrix. The one in the sigma in the middle is a covariance matrix. Okay. That's all you need to know about the mass at this point. So I want us to go through the exercise on that piece of paper I just collected back to put you choice of investment on this chart. So let's start with one. So what is cash is cash has no standard deviation. You hold cash. So it's going to be on this axis. It's positive return. So that's here. So let's call this cash. Let me just think about another example. Where's the lottery? So you buy your Powerball. So what's the lottery for? You put, let's assume you put everything in lottery. So you're going to lose. So your expected value is very close to lose 100% and your standard deviation is probably very close to zero. So you'll be here. So you're somewhere. Oh no, no, no. It's not exactly zero. So OK fine, so maybe it's somewhere here. So not 100% but you still have a pretty small deviation from losing all the money. What is coin flipping? So let's say you decide to put all your money to gamble on the fair coin flip. Fair coin zero. So expected return is zero. What is the standard deviation of that? Good. So 100%. So we kind of got the three extreme cases covered. Okay, so where's US government bond? So let's just call it five year note or ten year bond. So should return better than cash with some volatility. Let's call it here. What is investing in startup venture capital fund like pretty up there, right? So you probably get few very high return. But you can lose all your money. So probably somewhere here. Let me see. Buying stocks. Let's call it somewhere here. Last application lecture you heard about investing in commodities trading gold, oil. So that has higher volatility, sometimes higher returns. So let's call this commodity and the ETF is 10 typically lower than single stock volatility because it's just like index funds. So here, are there any other choices you'd like to put on this map? Okay, so let me just look at what you came up with. Real estate, okay, Real estate I would say probably somewhere around here. Private equity, probably somewhere here or investing in hedge funds somewhere. So I think that's enough example to cover. So now let me turn the table around, say ask you a question. Given this map, how would you like to pick your investments? So you learn about the portfolio theory. As a so called rational investor, you try to maximize your return at the same time minimize your standard deviation. I hesitate to use the term risk, okay, because as I said, we need to better define it. But, but let's just say you try to minimize this, but maximize this, the vertical axis. So let's just say you're trying to find the highest possible return for that portfolio with the lowest possible standard deviation. So will you pick this one? Will you pick this one? Ok, so then eliminate those two. But for this that's actually all possible. So then that's where we learned about the efficient frontier. So what is efficient frontier? It's really the possible combination of those investments you can push out to the boundary that you can no longer find another combination. Given the same standard deviation you can find a higher return. So you reach the boundary and same is true that for the same return you can no longer minimize your standard deviation by finding another combination. So that's called efficient frontier. How do you find an efficient frontier? That's what essentially those work were done and got them Nobel Prize. Obviously it's more than that, but you get the flavor from the previous lectures. So what I'm going to do today is really reduce all these to the special case of two assets. Then we can really derive a lot of intuition from that. So we have sigma R. We're going to ignore what's below this. Now we don't want to be there and we want to stay on the upright. So let's consider one special case. So again for that let's write out for the two assets. So what is R of P? It's W1 R1 plus Y minus W1 R2. Right? Very simple math. And what is sigma P? So the standard deviation of the portfolio or the variance of that which is a square. We know that's, that's for the two asset class special case. So let me give you further restriction which let's consider if R1 equal to R2 again here, meaning expected return I'm simplifying some of the notations. And sigma 1 equal to 0 and sigma 2 not equal to 0. What is Rho? What is the correlation? Zero? Right, because you have no volatility on. OK, so what is. What's that?
It's really undefined.
It's really undefined. Yes.
Yeah.
There'S no. Yeah, that's right. Okay, so let's look at this. So you have Sigma 2 here, Sigma 1 is 0 and you have R1 equal to R2. What is R of P? It's R because the weighting doesn't matter. So you know it's going to fall along this line. So here is when weight one equal to zero. So you weigh everything on the second asset. Here you weigh the first asset 100%. So you have a possible combination along this flat line. So very simple. Right? So I like to start with really a simple case. So what if. What if sigma 1 also is not 0 but sigma 1 equal to sigma 2 and further I impose the correlation to be 0. What does this line look at? So I have sigma 2 equal to sigma 1 and R1 still equal to R2. So RP still equal to R1 or R2. What does this line look like? So volatility is the same. Return is also the same of each of the asset class. You have two strategies or two instruments. They are zeroly correlated. How would you combine them? So you take the derivative of this variance with regarding to the weight and then you minimize that. So what you find is at this point is R1 equal to 0 or I'm sorry, W1 or W1 equal to 1. You are at this point, right, agree. So you choose either you will be ending up the portfolio exposure in terms of return and variance will be right here. But what if you choose. So when you try to find the minimum variance, you actually end up. I'm not going to do the math. You can do it afterwards. You check by yourself. You will find at this point that's when they are equally weighted half and half. So you get square root of that. So you actually have a significant reduction of the variance of the portfolio by choosing half and half zeroly correlated portfolio. So what's that called? What's that? Benefit diversification. When you have less than perfectly correlated positively correlated assets, you can actually achieve the same return but having a lower standard deviation. I say ok, that's fairly straightforward. So. So let's look at a few more special cases. I want really to have you establish this intuition. So let's think about what if in the same example, what if rho equals to one perfectly correlated? Then you can't, right? So you end up just at this one point, agree. Ok, what if it's totally negatively correlated? Perfectly negatively correlated. What does this line look like? Right? So if you weight everything to one side, you're going to still get this point. But if you weight half and half, you're going to achieve basically zero variance. I think we. You showed that last time, you learned that last time. And so let's look beyond those cases. So now let's look at. So R1 does not equal to R2 anymore. Sigma 1 equal to 0. There's no volatility of the first asset. So that's cash. So that's riskless asset in the first one. So let's even call it R1 is less than R2. So that's the right, you have the cash asset, then you have a non cash asset, rho equal to zero, zero correlation. So let's look at what this line looks like. So R1, R2, Sigma 2 here. When you weigh asset 2, 100%.
You'Re.
Going to get this point right. When you weigh asset one, 100%, you're going to get this point right. So what's in the middle of your return as a function of variance? Can someone guess? Try again. Yeah, I know, I know. Thank you. Are there any other answers? Okay, this actually let me just derive very quickly for you, right? Sigma 1 equals 0, Rho equal to 0. What's Sigma P? Right. And sigma P is essentially proportional to sigma 2 with the weighting. OK, and what's R? R is a linear combination of R1 and R2. So it's linear. Okay, so because in these cases you essentially return is a linear function and the slope, what is the slope of this? Let's wait on the slope so we can come back to this. Because this actually relates back to the so called capital market line or capital allocation line, because last time we talked about the efficient frontier, that's when we have no riskless assets in the portfolio. When you add on cash, then you actually combine the cash into the portfolio by having a higher boundary, higher efficient frontier and essentially higher return with the same exposure. So let's look at a couple more cases that I will tell you. So I think let's look at. So R1 is less than R squared and volatilities are not zero. Also Sigma 1 is less than Sigma 2, but it has a negative correlation of 1. So you have I set 1, I set 2. And as we know when you pick half and half, this goes to zero. So this is a quadratic function, you can verify and approve it later. And what if when rho equal to zero and actually Sigma 1 should be here. Okay, so when rho equal to zero, this no longer goes to the variance can no longer be minimized to zero. So this is your efficient frontier. This part I think that's enough examples of two assets for the efficient frontier. So you get the idea. So then what if we have three assets, right? So let me just touch upon that very quickly. If you have one more asset here, essentially you can solve the same equations and when the stream special case, you can verify afterwards all the volatilities are equal and zero correlation among the assets, you're going to be able to minimize sigma P equal to one over the square root of three of sigma one. Okay, so it seems pretty neat, right? The math is not hard and straightforward, but it gives you the idea how answer your question, how to select them when you start with two. So why two assets are so important? What's the implication? In practice it's a very popular combination. The asset managers, they simply benchmark to bonds versus equity. And one famous combination is really 60, 40, they call it 6040 combination, 60% in equity, 40 in bonds. And even nowadays any fund manager you have that, people still ask you to compare your performance with that combination. So the two asset examples seem to be quite easy and simple, but actually it's a very important one to compare and that will lead me to getting into the risk parity discussion. But before I get to risk parity discussion, I want to reveal the concept of beta and Sharpe ratio.
It.
So that's so you your portfolio return, this is your benchmark return, RFM expected return RF is the risk free return. So essentially your cash return and alpha is what you can generate additionally. So let's even not to worry about this small other terms, not necessarily small, but for the simplicity, let me just reveal that. So that's your beta. What is your Sharpe ratio? Okay, and you can, so sometimes Sharpe ratio is also called risk weighted return or risk adjusted return. Okay, and how many of you have heard Kelly's formula? So Kelly's formula basically gives you that when you have, let's say in the gambling example, you know your winning probability is P. So this basically tells you how much to size up, how much you want to bet on. So it's very simple formula. So if you have a winning probability of 50, 50, how much you bet on nothing. So if you have p equal to 100%. You bet 100% of your position. If you have a winning probability of negative 100%. So what does it mean? That means you're 100% probability of losing it. What do you do? You bet the other way around. You bet the other side. So when P equal to negative. I'm sorry, actually I said when p equal to zero, your losing probability becomes 100%. So you bet 100% the other way. So that I leave to you to think about. That's when you have discrete outcome case and. And. But when you construct a portfolio, this leads to the next question is in addition to the efficient frontier discussion, is that really all about asset allocation? Is that how we calculate our weights of each asset or strategy to choose from? The answer is no. Right? So let's look at a 6040 portfolio example. So again two assets stock has let's say 60%, 40% bonds. So on this, so typically stock volatility is higher than the bonds and the expected return is also higher. So your 6040 combinations likely fall on the higher return and the higher standard deviation part of the efficient frontier. So the question was. So that's typically people do before 2000, a real asset manager, the easiest way or the passive way is just to allocate 60 40. But after 2000 what happened was after the equity market peaked and the bond had a huge rally as first Greenspan cut interest rate and before the Y2K in the year 2000, you think it's kind of funny at that time everybody worried about the year 2000 coming up, all the computers going to stop working because all the software were not prepared for crossing this millennium event. So. So they had to cut the interest rate for this event. But actually nothing happened. So everything was okay, but then left the market with plenty of cash. And also after the tech bubble bursted. So that was a good portfolio. But then obviously in 2008 when the equity market crashed, the bond market, the government bond high grade market had a huge rally. And so that made people question that is this 6040 allocation of asset simply by the market value the optimal way of doing it? Even though you are falling on the efficient frontier. But how do you compare different points? Is that simple choice of your objectives, your situation or there's actually other ways to optimize it? So that's where the risk parity concept was really. The concept has been around, but the term was really coined in 2005. So quite recently by a guy named Edward Chen. He basically said okay, instead of allocating 6040 based on market value. Why shouldn't we consider allocating risk instead of targeting return, targeting asset amount? Let's think about a case where we can have equal weighting of risk between the two assets. So risk parity really means equal risk weighting rather than equal market exposure. And then the further step he took was he said, ok, so this actually is equal risk. So you have low risk, lower return, and the lower risk a lower standard deviation. But sometimes people really want a higher return. How do you satisfy both higher return and lower risk? Is there a free lunch? So he was thinking there is actually not quite free. But the closest thing, you've probably heard this phrase many times, the closest thing in investment of free lunch is diversification. He's using leverage here as well. But let me talk a bit more about diversification, give you a couple of more examples. That phrase about the free lunch and the diversification was actually from. Is that from Markowitz? People gave him that term. Okay, but anyway, so let me give you another simple example. So let's consider two assets, A and B. In year one, A goes up, basically doubles, and year two goes down 50%. So where does it end up? So start with 100%, it goes up to 200%. Then you, you go down 50% on the new base. So it returns nothing, it comes back. So asset B in year one loses 50%, then doubles up 100% in the year two. So asset B, it basically goes down to 50% and it goes back up to 100%. So that's when you look at them independently. But what if you had a 5050 weight of the two assets? So someone is quick on mass, can tell me what does it change? So A goes up like that, B goes down like that. Now you have a 50, 50 A and B. So let's look at magic. So in year one A, you have only 50%, so it goes up 100%. So that's up 50% on the total basis. B, you also weight 50%, but it goes down 50%. So you have lost 25%. So at the end of the year one, you actually. So this is a combined 5050 portfolio year one and year two. So you start with 1 100, you're up to 1.25 at this point. Okay, so at the end of year one, you rebalance. So you have to come back to 50 50. So what do you do? So this becomes 75, right? So you no longer have the 5050 weight equal. So you have to sell A to come back to 50 and use the money to Buy B. So you have new 50, 50% weight asset. Again, you can figure out the mass. But what happens in the following year when you have this move, this comes back 50%, this goes up 100%, you return another 25% positively without the volatility. So you have a straight line you can keep so this two year. So that's so called diversification benefit. And in the 60, 40 bond market, that's really the idea people think about how to combine them. So let me talk a little bit about risk parity and how you actually achieve them. I try to leave plenty of time for questions. So that's the return. Let's forget about these. So let's leave cash here. So the previous example I gave you, when you have two assets, one is cash R1, the other is not, the other has a volatility sigma 2. You have this point and I said what's in between? It's a straight line, that's your asset allocation, different combination. Did it occur to you, why can't we go beyond this point? So this point is when we weigh W2 equal to 1, W1 equal to 0, right? That's when you weight everything into this asset 2. But what if you go beyond that? What does that mean? So, okay, so let's say can we have W1 equal to minus 1, W2 equal to plus 2. So they still add up to 100%. But what's negative one mean? Borrow. Borrow. So you went short cash 100%, you borrow money, you borrowed 100% of cash, then put into to buy equity or whatever risky assets here. So you have plus two, minus one. What does the return look like when you do this? So RP equal to W1 R1 plus W2 R2. So minus R1 plus to R2, that's your return. It's this point here. What's your variance look like or standard deviation look like as we did before, Right? So sigma P Simply equal to W2 Sigma 2. So in this case it's 2 Sigma 2. So you're 2 times more risky, 2 times as risky as the asset 2. So this introduces the concept of leverage. Whenever you go short, you introduce leverage on your balance sheet. You have two times of asset two. You also short one of the other instruments. So that's your liability. So, so your net is still one. So what this risk parity says is ok. So we can target on the equal risk weighting which will give you somewhere around, let's call it 25% bonds, 25% equity, 75% of fixed income or in other words, 25% of stocks, 75% of bonds. So you have lower return but if you leverage it up, you actually have higher expected return. Given the same amount of standard deviation you achieve by leveraging up, obviously you leverage up. There's other implications of that. We haven't talked about the liquidity risk, but that's a different topic. So what's your Sharpe ratio look like for risk parity portfolio?
It.
So you essentially maximize the Sharpe ratio or risk adjusted return by achieving the risk parity portfolio. So 60:40 is here, you actually maximize that. And does leverage matter when you leverage up the Sharpe ratio change or not? So let's look at that straight line, this example. Okay, so we said Sharpe ratio equal to right? So all P, what is Sigma P2 Sigma 2 right. When you leverage up. So this equals to R2 minus R1 divided by Sigma 2. So that's the same as at this point. So that's essentially the slope of the whole line, it doesn't change. So now you can see the connection between the slope of this curve and the Sharpe ratio and how that links back to beta. So let me ask you another question. When a portfolio is when the portfolio has higher standard deviation of sigma P, will beta to specific asset increase or decrease? So what's the relationship intuitively between beta? So let's say look at the 6040 example, your portfolio, you have stocks, you have bonds in it. So I'm asking you what is really the beta of this 60:40 portfolio to the equity market? When the portfolio becomes more volatile, is your beta increasing or decreasing? So you can derive that. I'm going to tell you the result but I'm not going to do the math here. So beta equals to in this special case is Sigma P over Sigma 2. OK. All right. So so much for all these. I mean it sounds like everything is nicely solved. So coming back to the real world, let me bring you back. Ok, so are we all set for portfolio management? We can program make a robot to do this. Why do we need all these guys work on the portfolio management? Why do we need anybody to manage a hedge fund? You can just give money, so why do you need anybody to put together? So before I answer this question, let me show you a video.
It's.
Okay. Anyone heard about the London Millennium Bridge? So it was bridge built around that time and thought had the latest technology and it would really perfectly absorb. You heard about soldiers marching across bridge and crush the bridge. When everybody's walking in sync, your force gets synchronized. Then the Bridge was not designed to take that, synchronize the force. So the bridge collapsed in the past. So when they designed this, they took all that into account. But what they haven't taken to, what they hadn't taken into account was the support of that is actually. So they allow the horizontal move to take that tension away. But the problem is when everybody sees more people walking in sync, then the whole bridge start to swell. Then the only way to keep a balance for you standing on the bridge is to walk in sync with other people. So that's a survival instinct. And so I got this, actually, my friend, the fidelity, Ren Chen, Dr. Ren Chen, brought this up to me. He said, oh, you're doing. How do you think about the portfolio risk? This is what happened in the financial market in 2008. When you think you got everything figured out, you have the optimal strategy. When everybody start to implement the same optimal strategy for your own as individual, the whole system is actually not optimized. It's actually endangered. Let me show you another one. Okay. These are metronomes. You start anywhere you like. Are they in sync? Not yet. What is he doing? You just have to listen. You only have to listen to it, you don't have to see it. So what's going on here? This is not that metronomes don't have brains, right? They don't really follow the herd. Why, why are they synchronizing? Okay, if you're expecting they are getting out of sync, it's not going to happen. Okay, so I'm going to stop right here. Okay, you can try as many. How do I get out of this? Okay, so you can try, you can look at, I mean, this, I mean, there's actually a book written on this as well. So. But the phenomena here is not nothing new. But what. When he did this, what's that mean? When he actually raised that thing on the plate and put on a Coke cans, what happened? Why, why that is so significant? They are connected. So they are interconnected. Before they are individuals, now they are connected. And why did I show you the London Bridge and this at the same time? What's this to do with portfolio management? What's this to do with portfolio management?
People who are trading like if they have the same strategy, they're going to affect each other. They become connected in that way. If as an individual, you're doing a different strategy, if everybody else is doing something different, you can maximize in the space that you're doing.
Very well said. So if you're looking for this stationary best way of optimizing your portfolio, Chances are everybody else is going to figure out the same thing and eventually you end up in this situation that you actually get killed. So that's the thing, the last thing what you learn today, what you walk away with this today, is not what I want you to know, that all the problems are solved. So you say, oh, the problem solved, Nobel prize were given, so let's just program them. No, you actually, it's a dynamic situation. You have to. So that makes the problem interesting. As a younger generation, you're coming to the field, the excitement is there are still a lot of interesting problems out there unsolved. You can beat the others already in the field. And, and so that's one takeaway. And what other takeaways you think by listening to all these?
Diversification is the free lunch.
Diversification is a free lunch. So not so free, right? In the end it's free to a certain extent, but it's something. It's better than not diversified. It depends on how you do it. But there is a way you can optimize. I want to leave with you. I actually want to finish a few minutes earlier so that you can ask me questions. You can ask. Probably better to have this open discussion. I want you to walk away. To really keep in mind is in the field of finance and particularly in the quantitative finance, it's not mechanical, it's not like solving physics problems. It's not like you get everything figured out, it becomes predictable. So the level of predictability is actually very much linked to a lot of other things. Physics, you solve Newton's equations, you have a controlled environment and you know what you're getting in the outcome. But here, when you participate in the market, you are changing the market, you're adding on other factors into it. So think more from a broader scope point of view rather than just solve the mathematics. That's why I come back to the original. If you walk away from this lecture, you remember what I said at the very beginning, Solving problems is about observe, collecting data, building models, then verify and observe again. Okay, so then with that I end right here. So questions?
Yeah, just a question. So does this have anything to do with like, it kind of sounds like game theory. I'm not exactly too sure because you have like a huge population and you have no stable, really like no stable equilibrium. Does it have anything to do with game theory by any chance?
It has a lot to do with game theory, but not only to game theory. So game theory, you have pretty well defined set of rules, then Two people play chess against each other. That's where computer actually can become smarter. So in this market situation, you have so many people participating without clearly defined rules. There are some rules, but not always clearly defined. And so it's much more complex game theory, but it's part of it. Dan? Yeah.
Can you talk maybe about why some of the risk parity portfolios did so poorly in May and June when rates started to rise and what their portfolio.
Good question. Right. So as you can see here, what the risk parity approach does is essentially to weight more on the lower volatility asset. In this case the question is how do you know which asset has low volatility? So you look at historical data which you conclude bonds have the lower volatility. So you overweight bonds. That's the essence of them. So then when bonds start to sell off after Bernanke, Fed Chairman Bernanke said he's going to taper quantitative easing. So bond from a very low, high yield, a very low yield level, the yield went much higher, interest rate went higher, bonds got sold out. So this portfolio did poorly. So now the question is so does that prove risk parity approach wrong or does it prove right? Does the financial crisis of 2008 prove the risk parity approach a superior approach or does the June may experience prove this as less favored approach? What does it tell us? Think about it, right? So it's, it really is inconclusive. So you observe, you extrapolate from your historical data, but what you are really doing is you try to forecast volatility, forecast return, forecast correlation, all based on historical data. It's like a lot of people use that example. It's like driving by looking at the rear view mirror. That's the only thing you look at. You don't know what's going to happen in front of you. You have another question.
Given all this new information, do you find that people are still playing similar game with portfolio management?
Very much true. Why? So you say people should be smarter than that. It's very difficult to discover new asset classes. It's also very difficult to discover, to invent new strategies and which you have a better winning probability. The other risk, the other very interesting phenomena is most of the traders and the portfolio managers, the investors, they are career investors. Meaning just like if I'm the baseball coach, I'm hired to coach a baseball team, my performance is really measured against the other teams when I win or lose. A portfolio manager or investor is also measured against the peers. So the safest way for them to do is to benchmark to an index to the herd. So there's very little incentive for them to get out of the crowd because if they are wrong, they get killed first, they lose their jobs. So the tendency is to stay with the crowd. It's for survival instinct is again not the other example. It's actually the optimal strategy for individual portfolio manager is really to do the same thing as other people are doing because you're staying with the force.
And so you said even though we have all these tools, in the end it's not just that we could leave it to the computers.
We need managers.
So what different are the managers doing?
Can you try to answer that question yourself? What's the difference between human and the computer? That's really right. What can human add value to what computer can do?
The market factors and news and what's going on.
So taking more information, processing information make a judgment on more holistic approach. So it's an interesting question. I have to say that computers are beating humans in many different ways. Can computer ever get to the to the point actually beating human investment? I can't confidently tell you that it's not going to happen. It may happen. So I don't know. Yeah. Any other questions? Yeah.
Just to add to that, I think there is more to management than just investing. I think managers are also have like key roles in human in their hr. Key roles in just like managing people and ensuring that they're maximizing their talents. Not just like, not just oh, how much money did you make? But I mean are you moving forward in your career while you're there? So I think management has a role to play in that as well, not just investment.
Yep, I think that's, that's a good point. Yeah. All right. So sure. Jesse, what is your portfolio breakdown? It's my personal portfolio. Well, I'm actually very conservative at this point because if you look at my curve of those spending and the earning curve, I'm basically I'm trying to protect principles rather than try to maximize return at this point. So I would be sliding down more towards this part rather than try to go to this corner. So I haven't really talked much about risk. What is risk? So I talk about volatility or standard deviation. But as we all know that as Peter mentioned last time as well, there are many other ways to look at risk. Value at risk or half distribution or truncated distribution or simply maximum loss you can afford to take. But looking at a standard deviation or volatility is an elegant way. You can see I can really show you very simple math about how the concept actually plays out. But in the end actually volatility is really not the best measure in my view of risk. Why? Let me give you another simple example before we leave. Let's say you have this is over time. This is your accumulatively return or your dollar amount. So you start from here. If you go flat then does anyone like to have this kind of a performance? Of course, this is very nice. You keep going up, you never go down. But what's the volatility of that? The volatility is probably not low. On the other hand you could have what I'm trying to say when you look at it expected, the return, matching expected return and the volatility, you can still really not selecting the best combination because what you really should care about is not just your volatility. And again, bear in mind all the discussion about the modern portfolio theory is based on one key assumption. Here is about Gaussian distribution, normal distribution. The two parameters, mean and standard deviation categorize the distribution. But in reality you have many other sets of distributions. It's a concept still for a lot of discussion and debate. But. But I want to leave that with you as well.
Just going back to the same question about these guys were asking about management and how do that they add value. I think the people who added value in there were some people who added a tremendous amount of value in the financial crisis and they were doing the same mathematics. But the difference was that their expected return of various assets was different from the entire the broad market. So if you can just know what expected return is that probably that is the only answer to the whole portfolio management theory.
Yes. If you can forecast expected return, then you know the game. You solved the big part of the puzzle. Yeah.
What management does is how good it can do. E expected return, full stop, a thin.
Wash. Yeah, I disagree on that. That's the only thing because given two managers they have the same expected return. But you can still further differentiate them. And that's where all this discussion is about. But yes, expected return will drive a lot of these decisions. If you know one manager is good, you expect a return three years later he's going to make 150%. You don't really care what's in between, you're just going to write it through. But the problem is you don't know for sure. You will never be sure.
I'd like to comment on that.
Sure.
The last problem looked at in simplified settings, estimating returns and volatilities and the.
Problem.
The conclusion from the problem was you basically cannot estimate returns very well even with more data over an historical period. But you can estimate volatility much better with more data. So there's really an issue of perhaps luck in getting the return estimates right with different managers, which are hard to prove, that there was really expertise behind that. Although with volatility you really can have improved estimates. And I think possibly with the risk parity portfolio, those portfolios are focusing not on return expectations, but saying we're going to consider different choices based just on how much risk they have and equalize that risk. The expected return should be comparable across those brands.
Yeah. So that highlights the difficulty of forecasting return, forecasting volatility, forecasting correlation. So risk parity appears to be another elegant way of proposing optimal strategy, but it has the same problems. Yep.
Actually, I also wanted to highlight, you mentioned the Kelly Criterion, which we haven't covered the theory for that previously, but I encourage people to look into that. It deals with issues of sort of multi period investments as opposed to single period investments. And most all this classical theory we've been discussing or that I discussed covers just a single period analysis, which is an oversimplification of investment. And when you are investing over multiple periods, the Kelly Criterion tells you how to optimally basically bet with your bankroll. And actually there's an excellent book, at least I like it, called Fortune's Formula that talks about the origins of options theory and finance, but it does get into the Kelly Criterion. And there was a rather major discussion between Shannon, a mathematician at MIT, who advocated applying the Kelly criterion, and Paul Samuelson, one of the major economists also from mit. Also from mit. There was great dispute about how you should do portfolio optimization.
That's a great book. And a lot of characters in that book actually are from MIT and Ed Thorpe, for example. And it's really about people tried to. To find the Holy Grail magic formula, but not really to that extent, but finding something other people haven't figured out. But it's very interesting history. Big names like Shannon, very successful in other fields in his later part of his career and life, really devoted most of his time studying this problem. You know Shannon. Right. So Claude Shannon, he's the father of information theory. Yeah. And has a lot to do with the later, you know, information age invention of computers and very successful. Yep. So anyway, so we'll end the class right here. No homework for today. Okay. So you just need to. Yeah. Okay. All right, thank you.
More from Jake


Lecture 1, Part II: Introduction of Financial Markets, Financial Terms and Concepts