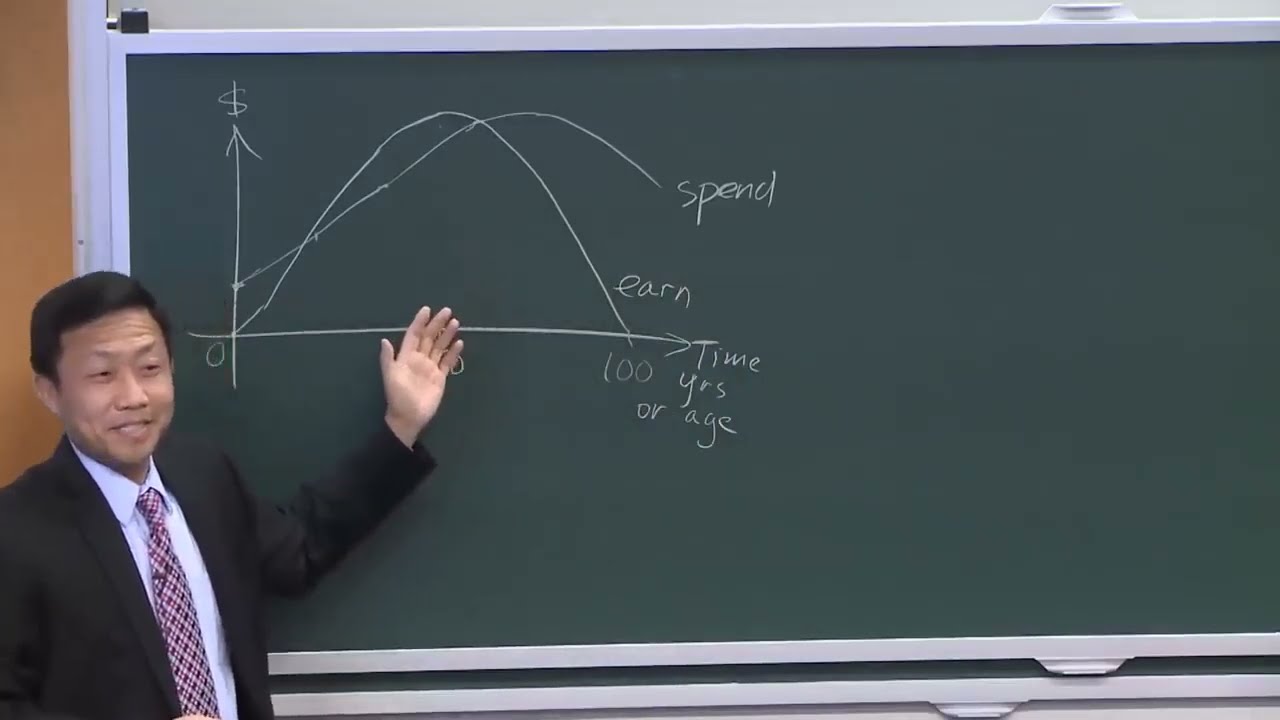
Jake Xia maps spending and earnings across a lifetime, showing how they rarely align. Expenses peak during family-building years while income peaks around age 50. Investing builds a fund to bridge the gaps and keep you stable when one outpaces the other.
Chapters
So let's look at this chart. So I'm going to plot your spending as a function of your age. So when you are age 0 to age of 100, so everyone's spending pattern is different. So I'm not going to tell you this is the spending pattern. So obviously, when— So when you're 0, you're not spending anything. Kids are young. They probably don't have a lot of hobbies or tuition. But they have some basic needs. So they spend. Then the spending really goes up. Now your parents have to pay your tuition. Or you have to borrow loans, scholarships. And then you have— that's college. Then you're married. You have kids. You need to buy a house, buy a car, pay back student loans. You have a lot more spending. Then? You go on vacation, you buy investments, you just have more spending coming up. But it goes to a certain point, it will taper down, right? So you're not going to keep going forever. So that's your spending curve. And the other curve you think about is what's your income? What's your earnings curve? You don't earn anything when you're just born. But your earning— so this is spending. So let's call this 50. Your earning probably, typically peaks around the age of 50, but it really depends. Then you probably go down, back up, right? So that's your earning. OK. And do they always match well? They don't. So how do you make up the difference? You hope to have a fund, have an investment on the side which can generate those cash flows to balance your earning versus your spending. OK. So that's only one simple way to