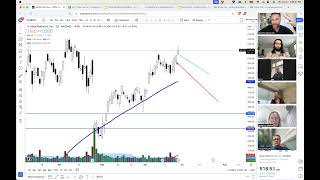
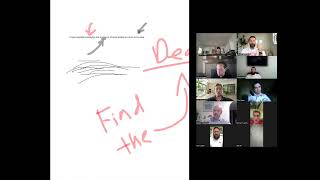
A Deep Dive into Candlesticks - Intermediate Trading Series Class #1

Jeremy Newsome teaches candlestick patterns and price action across stocks, options, forex, and crypto. Learn how to read wicks and shadows, spot patterns like doji and hammer candles, and set stops and position sizes using R-unit risk management.
Chapters
Live from Music City, Nashville, Tennessee, this is your motivational, sensational, inspirational, educational, aspirational, international, keenly awaited, highly anticipated edition of the Intermediate Trading series, module number one, presented by Real Life Trading. Ladies and gentlemen, boys and girls, folks and friends from around the world, I, I am your humble host. My name is Jeremy Alexander Newsom and I am straight up fired up about this particular program. There are already so many people here and my goal and objective of this is very similar to most. Our mission, ladies and gentlemen, is to enrich lives. We do that by educating the world on how to profitably, safely and consistently trade the markets. The module goal. This is module 1, and the goal of this module is to ensure you get an incredible foundation and understanding of candlesticks. Because from here we're gonna be doing all kinds of candlestick and technical analysis. What's really great about this program and module is really, it's extremely comprehensive. What I mean by comprehensive is simply we're gonna be going over forex charts, cryptocurrency charts, futures charts, Indian markets, Australian markets, US markets. So this is gonna be a very globally inclusive program. And I'm straight up fired up. Jose says 27 miles and a class. That's right, my man. Today is the 27th of April, and I'm doing the Calendar Club shout outs to all my other crazy, wild, insane people out there. I have officially three days left and they will be the hardest days of the entire program. A little bit about me and my friends. Most of you know this, but I love candlestick trading. If you're ever to focus on one aspect of technical analysis, it would inevitably be candlesticks. I have been at this particular point in time trading stocks and options for over 10 years. We launched real life trading back in 2014, and I hold the unofficial world record for buying SLV at its highest price ever back in 2011. So those are just four small tidbits about me. By the way, if you are in the US and I think also Canada, if you want these slides, a lot of people want these slides. Trevor says, can I share the live YouTube link to my Facebook? Of course. It's literally free. This is 100% free to the world, man. If you guys know anyone that wants to be a part of this program, either live or recorded, send it to them. Doesn't cost you any money at all, only time. So send away, my friend. Thank you for asking, I appreciate it. So if you want slides, go ahead and try this out. Text the word Newsom, which is my last name, to the number 55444. Get slides automatically from each day's class. Get your free real life trading dashboard. Load up your custom dashboard with loads of free courses, tools and premium high end training fired up about it. All right, so that's how you can get these slides. Module 1 here is where we are. Module 2 is where we're going. Module 3 is where we will be. Module 4 is an eventuality of where we will. And then module five is what's going to be happening after all of those four modules. It's going to be straight up fire. And here we go. First, I want to define two key terms I will use relatively often. Sentiment is the emotions and plans or thought processes that led up to the buying or selling of a security and then the term price action. Price action is the literal and numerical movement of a stock. The price of any object is what matters to humans. The larger the number, the more weight, the more impact it has on us as humans. When money is directly tied to price actions, humans usually care very much about the outcome of a move in price, either up or down. And that is pretty much two terms I'll be using very frequently in this particular program. Stephen says hi Daniel. Hey. Stephen might be talking to one of his buddies potentially. So those are just two really specific pieces of info as far as definitions or terminologies. Candlesticks themselves, ladies and gentlemen, are simply visual representation of price, action and sentiment. Candlesticks are the language of the charts. To learn them will be learning a new language. Therefore give it some time. It's not something you're going to learn overnight, but it will be extremely useful. Just like if you want to travel to Italy, you should probably learn some Italian. Remember that movie Inglourious Basterds when Brad Reed was like. Or Brad, not Brad Reed. Brad Pitt was like, I speak a little Italian. Oh man, what a great. What a great movie. Robert says, hey Jeremy, a little late, but I'm stoked. Thanks for being here. Now personally, I use white and black candlesticks for a couple of reasons. Number one, it saves on printer ink. A lot of people like to print out things, charts and or slides, so it saves on printer ink. Also, there aren't any subliminal triggers with black and white candles. For example, if you have red and green, some people get afraid when it's red candles or get really happy when it's green candles. I will sprinkle in some red and green charts into my analysis just to show you guys flex my skills. I can do a little bit of both right I can do a little bit of both, but there's not really any subliminal triggers. It's just simply black and white. Daniel says, aren't you replacing the subliminal feelings with black and white? Exactly. Yep. So just kind of replacing it. Black is no longer anything. White's no longer anything. Theoretically, folks, though, you can have any colors you want. It doesn't really matter as long as you know what color represents up and what color represents down. Many traders use red and green. There's nothing wrong with red and green at all as long as you know which colors represent what. So that's pretty much it. Pretty basic. I think you guys get that, get that aspect. So diving in and kind of going forward, this is what I will call the bullish candle. And the bullish candle gets formed by an opening price. The opening price, at least here in the United States, if it's a daily candle, is 9:30am on the day if it is a daily candle. But any candle, you get the open, you get the close, you get the high, and you get the low. At some point during whatever time frame you're trading, once the candle closes, you don't know what the candle color or the actual shape is going to be until the close. You can have an idea, you can have a perception, you can have a goal, you can have a thought, but it won't be fully finalized until the actual close. True or false, ladies and gentlemen, if you are working on a five minute chart, you have to wait five minutes for each candle to close. All right, that's also true. You guys know that. Very, very nice. So below is a list of facts about white candles. A white candle is always a buying candle. Simple as that. It is created because the price action closed higher than it opened on that time frame. The bigger the candle, the more buying that took place during that time frame. The bottom of the candle is the open. The top of the candle is the close. These candles mean the most when found at strong support prices. Russ says this guy Jeremy is the candle whisperer. I appreciate that, man. One of my random nicknames, Sir Isaac Newsome. All right, so that's got the bullish candle. This is the bearish candle. The bearish candle is the exact opposite you have the open is dictated and you only know the exact price once it closes. Then you have the low of where the stock went at one point or where the instrument went at one point. You have the high of where it went at one point. And the open is always above the close. On a bearish candle doesn't matter what color it is. So a black candle is always a selling candle. This is created because the price action closed lower than it opened on that time frame. The bigger the candle, the more selling the bottom of the candles. The close the top is the open. That's the candle body. So true or false, my friends? I will square this. This blue square contains the candle body. Is that true or false? That is true, as Nick says. And thanks for being here, Nick. I appreciate that. That is the candle body. Beautiful. So the bullish candle on a daily time frame. Okay, you have. What I did is I took the words open and closed. I just kind of moved them to the left. I pretty frequently will use the term wick. I also use the term shadow every so often, and every now and then I'll say the word tail. But other people will use pretty synonymous terms with the wick and the tail. So what's key to understand is on an bullish candle, the high will always happen at some point during the time frame. If this is a daily candle. Right. Daily timeframe, whatever. The high prices has to occur sometime between 9:30 and 4. The close is 4pm Eastern in the U.S. the opens 930. The low happens sometime between there and there. And the high and the low price of the day are shown by what's known as a candle wick. Just like the candle that you actually burn, you know, the wick of that candle, it's the same terminology. These candlesticks were created by the Japanese very long time ago. Now, the bearish candle, pretty much the exact same thing, just again, the big difference, the only difference actually is the candle color and the fact that when you get a bearish candle, the close is down here and the open is up here. This will show you what the stock did during that time period, which is very crucial and majestically magnificently important. All right, so let's go ahead and talk candle wicks again. Wicks are commonly referred to as shadows or tails. This is something you probably don't want to take a note of. Lower wicks always represent buying pressure. The longer the lower wick, the more excited and aggressive the buying. Okay? The upper wick always represents selling pressure. The longer the the longer the wick, the more excited, aggressive the selling. So here's a trivia question for you, my friends. Does a candle always have to have a wick? Yes or no, does it always have to have a wick? And the answer is no. No, it does not. Beautiful. You all got that correct. Very well done. So here's some individual candlesticks. Let's kind of go through and talk some about about some of these candlesticks and we'll kind of start repping it out a little bit. So some individual candlesticks. Doji High Wave Hammer Shooting Star Shave Bottom Shave Top Bullish and Bearish. Marz Bozu Long Day Bullish and Bearish. Spinning Top Candle. So those are some individual candlestick names. Let's talk about the doji. Generally doji's have no real body. So very pretty much straight line across. Now the interesting thing is doji's happen all the time. I don't want you guys to think that they're cool and they're massively special or unique. They really pop up all the time and they represent indecision. So you have a pretty solid balance of buying and selling. And depending on the location they can offer great risk reward setup. So I'm a circle that one because that's kind of an interesting takeaway. Depending on the location they can offer really good risk reward plays. So finding a nice doji at a really good spot can be a fun, fun place to take a trade every so often. Now what's nice is we've talked about this charting software. In the beginner's program you have the ability to pop up to trendspider and you can click on the word patterns and when you do patterns you can actually select which type of candles you want to scan for. So what you'll notice here is a scan that I did on bitcoin for dojis. If you do ever plan on using trendspider and I will continue to use them for a very long time, you can use code RLT25 and it'll save you 25% off. But check out how cool and how many doji's again I can find automatically, very, very quickly. So obviously the question is that's great and all you can find the candles, but how do you play them? We're going to be getting to that just a moment. But what I do love is for example, and this is a candlestick we'll talk about later. But you have this really nice tweezer bottom candle pattern right there. Tweezer bottom showing really strong reversal candles. And look at that really, really tiny candle that comes in after that tweezer bottom. So again for me a lot of times it's about asking the question, what does the trend look like it's happening now. What does the trend look like it's doing? What has it done? And if I can get Some really, really good, nice, tight range doji's. I love taking some breakouts of those, especially if they occur on the daily chart. And this is a daily chart on bitcoin. All right, beautiful. So some more types of dojis. And this is a really interesting thing that I want to make sure we break down because I get a lot of questions about this very frequently. There are really three types of quote unquote doji's. You have a doji, you have a spinning top, and you have a highway. They all have very similar characteristics. The difference is a doji has no real candle body at all. So you guys see over here. This is a doji. There's no real body. A spinning top generally has a small candle body and a small upper and lower shadow, aka this one. So type in A4 if you can kind of clearly see that there is a distinct difference between the candle body of both of those. Right? You have the thick body and the other one. And then the candle that I get the most questions about, because I mentioned all the time, is probably one of my favorite individual candles is the high wave candle. The high wave candle has a generally has a candle body, but has really large upper and lower shadows. These candles simply represent a great deal of indecision. And I like these candles more because they show even more indecision, in my opinion, than these little guys. So when you get a really big upper and lower shadow like that, it shows some wild price action. As Alan's mentioning the chat pane, right. Stock or the instrument will open or go down or go up. It'll go down and go up and they'll kind of close relatively unchanged. I love looking for and scanning for high wave candles. Really one of my favorite candle patterns is looking for high waves. And I find them personally easier to spot. And in the right location, they can be a brilliant setup. Let's go ahead and kind of pop over to a high wave candle. That was a great play on bitcoin, talking about bitcoin. And look at the distinction on this high wave. So what we're gonna do is just talk about the difference between this high wave, this high wave and the one that happened previously right here and right here. And the answer is there's no real massive distinction. If you tried to take the bearish breakout of this highway right here, would you have gotten triggered in bearish, yes or no. Now it might be a little hard to see, but if you're squinting, you'll notice that it actually did not break down. The next two or Three days, we never went below that candle. So you would not have gotten triggered in. Right. That's your high wave candle right there. We never took out the low, that candle. We got close, but we didn't. But when this candle came in right here, this little. This little guy, you, this really, really pretty, big, gorgeous, bearish, almost marbozo candle right here, which we'll talk about, Marbos is a little bit nice. Marbozu candle. At that point in time, you had some lower highs and then you got a high wave candle. What was interesting about the very next candle? Who wants to tell me that? That little piece, the next candle. What was interesting about that next one? The next one is referred to as an inside candle. Inside candle. So do you notice how the upper and lower shadows are fully within the previous high and the previous low? You guys all able to see that? Yeah. Now, what does that mean realistically? It simply means that what was once indecision in one day is even more indecision the next day. And the pressure is building. There's a lot of indecision. No one knows what the heck's gonna happen. But there's gonna be a breakout soon. There's gonna be some type of move. There's gonna be some type of wild, wild movement up or down. We don't really know. But what was interesting on this particular trade is bitcoin at that. Once this candle came in, type in A4. If you would agree that that candle pretty much simultaneously closed below all major levels of support. Right. So the can on point to the orange arrow close below pretty much all of them. Now, again, does this. Here's what's really, really cool about candlesticks, my friends. Type in a 7. If you realize it doesn't matter what chart this is, that's what's beautiful about candlesticks. Once you really start mastering these things, it doesn't mean you're going to win on every trade. One of my most recent examples is simply, you can read candlesticks like you can read a book. You can read candlesticks like you can read a script from a movie. But just because you're reading a book or a movie doesn't mean that you know exactly what's going to happen at the end. Sometimes there are surprises, And this is one of those situations where you can read the sentiment, but you don't know always what's going to happen. But you can have an idea. So that candle that came in right there on bitcoin, it did close below all levels of support. We were Making lower highs at that point. So it made the most sense to short. And it was a very good short trade. It was a nice, quick, bearish drop. Now, we've talked about this before in the beginner class, but we're going to talk about it again just in case, because some of you might be here for the very first time and did not go to the beginner's program. Another favorite candle of mine is the hammer. The hammer, by its nature is a very bullish candle. To be called a hammer candle to lower the wick should be about two times the size of the candle body. But it doesn't have to be an exact science. I love my hammers to have a little bit of an upper shadow. Now, who can tell me why should I or why do I want my hammers to have a small upper shadow? Why does that make sense? What's valuable about an upper shadow? And you'll notice the little drawing I have here has a little miniature upper shadow Nate smashed. It says represents some selling pressure. Exactly. So when you have a little bit of an upper shadow, you do have some sellers who are coming in. You have a little bit of people who are selling. So even though you have obvious buying pressure, you don't have tons of selling pressure, but you do have some. The reason I like to have some selling pressure is it gives me a really good price and a really good place to put an entry. And if the stock starts going higher, will you have some sellers who are trapped? And the answer is yes. Right. Because we all know at this point by now if you are bearish on a position, the way you get out is you buy. So when you have those little upper shadows, it means that there are some people trying to force that stock down and short. It's up in a one. If that was a little bit of an aha moment for you, and if it's okay if it's not. But I think it's useful for me because I love finding those just tiny little upper shadows there. I can go, okay, cool. And then I can play the break above those. Now, if you like big breakthrough moments, here's another one I love. When the lower wick of my hammer has gone below recent lows, also trapping. People give you some examples of that in just a moment. So bear with me. Hammers can be black or white. Although if it's a black hammer, normally I'll call them hammer ish candles. But I really do like them. I like black hammers, I like white hammers. It doesn't really bother Me, either way just kind of depends on the location sometimes, but I'm kind of game with either one. So let's go look at a few because again, if we really start massively understanding these things, your trading can improve. Incredible. Maloney says, can it also not be people profitable and taking profit? It can. So what Maloney is referring to is the upper shadow doesn't have to be short sellers, right? So this little candle right here, does that have to be short sellers? And the answer is no. So my question to you, Maloney, would be, have you ever gotten into a trade, gotten out to only see it go higher? And the answer is, of course, everyone here has done that. So when you get that, do you ever get back into the trade? And that would be kind of my thought process is if you do get the lover shadow and you're like, oh no, it's going higher. So you get back in. And that buying, right, even though you bought and sold locked in your profit, that buying is going to help also drive the stock up a little bit. That's a great question. Yep, great question. All right, so on the screen, ladies and gentlemen, is that a hammer that I'm pointing to with a black arrow, yes or no? All right, we got someone said no with an exclamation mark. Nice. The answer is no. That is correct. And great job for all those who are answering. There's a lot of you here right now, and I love it. Also for those out there on YouTube land, thank you for watching on YouTube. I appreciate it. Alan says, is that more of a doji? It is a doji. Yep. What also candle. Could you call that? It is a doji and it's a high wave candle. Yep, it's a high wave candle because has that massive upper and lower shadow. So it's a doji and it can be called a high wave. Phenomenal clarification. Questions, team. Beautiful job. Next slide. Is that a hammer candle? Why, yes. Yes, it is. Now, what's very cool about this hammer is it does have a lot of really good characteristics. And I'm not saying you may or may not have taken that trade on this particular time frame, which is a five minute chart, a little bit of a hammer ish candle. As John says, you do have a lot of good characteristics. First question, did the lower shadow go below some recent lows? And the answer is yes. So you can see right here, this is a previous low. That wick got a previous low there. And then this candle comes in just by a few pennies and throws in another Lower, low. So, number one, some people are trapped. Number two, it is a black candle. Number three, that's about it. Because it's not really at an exceptionally amazing location. That doesn't mean that you can't take those candles, and it doesn't mean that you can't play a candle. This a hammer if it's at a little bit of a higher spot. But what I like to do is I like to wait if I see that my hammer is at a little bit of a higher level, like for it to make a higher high, and then I look to just simply buy the dip off that hammer. I generally like to play my hammers at some type of pullback, as some type of support at a lower price, something of that nature. Now, would you call that a hammer? It's close. It's close enough. I wouldn't say it's specifically not a hammer, but it's a hammer. Ish, for sure. By the way, for those who speak a different language, is there another. Is there a term like that in your language, like English? We have this ish word, which I don't even know what it means. Hammer. Muy bueno. Ish. Like, I don't think they have that in Spanish anyway. Ish equals close enough. Yeah, it's like it's on the border. Oh, man. So anyway, that is. It is a good candle. But what's really nice about that is the lower shadow. Let's talk about that lower shadow for a second. What does the lower shadow do? Right, so the lower shadow, you had people who got in bearish right here. So the bears were getting in, expecting the stock to go lower. So they were hoping this would happen, number one. Number two, if people did get in up here, where do you think their stops would have been? Their stops probably would have been right here in this gap. So it served a lot of. A lot of points. It trapped people who had their stops too tight. It got some people who were in short. And it gave us some buying opportunities. People who were buying off of this support. Right. The same people who bought there, bought there. And that's what I like about these lower shadows is when the stock does not close below support, but it throws in those lower shadows and those wicks. It scares people, terrifies people, and it's a good opportunity to play trade in that direction. All right, what about this one? Is this a hammer candle? Have a trader saying, so are you buying the pullback on both bearish and bullish hammers? Good question. So if it has an upper shadow and it's out of support. I do not buy the breakout. I don't buy the pullback. I buy the breakout. So on both of these positions, my entry would be above the high of this candle and or above the high of this candle. So both of those is where I'm getting in. Bullish. And the answer is yes. That is a picture perfect hammer. Print it out. Use it forever. That is your free gift for the night. You find candles like that at a good support level. You play them. That's the way that works. Are they gonna work? Yeah. Are they not gonna work? Yeah. Can you make money with them? Sure. Can you lose money with them? Sure. You simply got to lose less than you win. That's just called trading. That's called math. What about this camera candle? Is this a hammer? I would say no. I'd say that's a high wave. Maybe spinning top one of those two. Now, it is a cool candle pattern. So if we start blending and we look at these three candles, what pattern does that three candlestick pattern pattern make? That is called your morning star reversal. Now, true or false, you would not have known it is a morning star reversal pattern until this candle came in. The answer is true or yes or accurate. That is correct. So you would have had an idea. You would have had an implication like a maybe, but you would not have known for sure until that third candle comes in. When that third candle comes in is a very pretty bullish candle. Lottie says, is that a one white soldier? No, one white soldier has to be a bearish candle into a bullish candle. That's a bullish candle into another bullish candle. But it is a good morning star reversal pattern. Nicely done, team. I thought I could stump you, but I couldn't. Are there any other hammers that you See? Type in a 7 if you see any other hammers on this chart. How about that one? Hope that's the one that you saw. Now, again, what's the main difference? I would have to ask between this hammer and this hammer. What's really the main difference? If we had to kind of find one. Trevor says you have some selling pressure on the second one. That is true. One's a bullish candle. One's a bullish hammer. That's very accurate. Very accurate ones. Pulled back some more. And also another answer would be the amount of time that's passed. Right. When this candle came in, you had two candles before it and then boom, a hammer. So if you're looking at getting a nice controlled pullback, you normally want more Than two candles. Right. This one you had, I don't know, three or four or five, six candles before it really came into play. And it was later in the day as well. There's also later in the day. Why does that matter? Because since this is a 5 minute chart, this is like an intraday time frame. If you're playing something later in the day, you'll have the ability to kind of see what the moving averages are doing and seeing how any kind of average you're looking at is propping up the stock around this point right here. Whatever move, whatever main moving average you're looking at was probably something like this is my guess. So it wasn't really resting on it. But by the time that the stock comes into later in the day, it's looking at something like this and it was probably bouncing off of that moving average.7 to 6, if that makes sense. We're gonna be talking a lot about that in future classes. But a lot of traders get into trades way, way, way, way too early without them letting an actual nice, cool, calm, collected pullback happen. Pullbacks are going to happen. They're just a natural part of trading. Got to be cool, calm and collected. Christopher says could you say that the hammer wick pulled down into the mid line of the double bottom. Christopher drop a newsome nuggets and knowledge bombs on the world. So I would say that is accurate. Yes. So this could have been relative double bottom area. And we will be talking about double bottoms very soon. But there was the double bottom right there. And what Chris is saying is since the stock had so much time to pull back, this could have been some sort of retest of that neckline. And I would 100% agree with that statement. Yep. Great, Great point. All right, good stuff, team. Now, this is a stock on the asx, the Australian exchange. Is this a hammer, yes or no? Yes, it is. Now, let's talk about what's interesting about this hammer. There's two or three really, really, really interesting aspects on this hammer. What's number one? Who wants to read my mind? What do you guys got for me? Alan says you got some buyers. That's true. What else? It's a bearish candle. That's correct. There is definitely some selling pressure on that candle because it's a bearish selling pressure. Robin nailed it. It's consolidating a bit. So the stock is consolidating a little bit. Oh, there's somebody says it went to the previous bottoms. What the heck does that mean? So the previous bottoms. Check this out. Notice how this lower shadow is probably. I'm not saying for sure. I mean, it is. But do you think this lower shadow is lower than this little guy right here? Now, remember, when you say textbook example, this is an example of a textbook. I'm giving you a layup here. This it is. The red arrow is two or three pennies lower than the blue arrow, which means the candle that I'm pointing to, the blue arrow, people have their stops there, and they got trapped. It was also occurring, as you all mentioned, at the end of a consolidation. So the stock was consolidating, consolidating, consolidating, consolidating, consolidating, consolidating. And you got a nice little hammer. So the question is, could you have played it above there and here? So I want to give you guys the textbook, but here's the numbers I could have given to you ahead of time, but the low of that candle is 29, 28, and the low of that one was 22, 22. There's a typo. There should be 22, 29, 22. Let me fix that really quick. 29, 22. Okay. Easy fix. So 29, 22. That's one thing I really, really like about that hammer. Also, you'll notice it is making higher lows relative to some of the recent data type in a sticks. If you would agree with that statement, I'll kind of draw the line for you. But here's the line. So you're making some higher lows from some of the recent lows. Trevor says that's paying for weddings right there. Oh, yeah, yeah. This is definitely paying for somebody's wedding somewhere. Now, with that particular candle coming in, here's how you could have played it. Entry above the high of the bearish candle. And. And since it's so close, you could have easily included the previous candle as well. This little guy right there. Now, with this stop loss, could you, my friends, have placed the stop loss down here at 28 and some change? Yes or no? The answer is yes. Of course you could, right? Why not? Why not? You could have played it either way. This would be a little bit more of an aggressive entry with a stop loss right below that candle. Either one played out, but we can see that it worked extremely well. Now, as we're talking about candles, what's interesting about this candle right here other than the obvious? Tell me something that's not super obvious about that candle. What do you guys think? Steve is the first one to get that correct. He says it goes over previous resistance. Yes, that's right. Arafat says, shouldn't it be a bearish trade since it's a bearish hammer? No, sir, I think you missed the point of hammers. Hammers are bullish candles, especially when they are at a support. It's a whole point. Yep, they are bullish candlesticks, especially when they occur at a support level. So, yeah, what you guys are mentioning and noticing, you see how it closes above this gnarly upper shadow? Remember, what do upper shadows represent? Selling pressure. So when we close above that gnarly McNarly town upper shadow, how do all the traders who are, in short, how do they feel? They feel trapped, scared, frustrated, worried, upset, and they're having to buy to cover. And then the next day, the stock gaps, and then it continues higher, and then it just absolutely crushes into new highs. Now, here's a good trivia question for you all. I know you can see what happens, but would you have sold here? Be honest. Or would you have sold somewhere over here? Orange line or green line? Be honest with me. Tell me your answer, and I'll help you hold the trade longer. So most of you are saying orange, which is fair. It's a very, very fair statement. Type in a 4 if you want me to help you hold this trade a little bit longer. All right. Because here's where money comes in. Notice this candle right here. Do you see how we get really close to a target? A bunch of white candles in a row, and then it gaps down overnight. So from here comes all the way. Let me just erase all the drawings for a second. So it gaps down overnight, all the way down into here, and then immediately gets a strong bullish candle. So it was a gap and go that did not go. It was a bearish gap down that immediately got bought up. So since that was a supposed to be a bearish candle, it was supposed to be a bearish gap, but the trend held it up extremely, extremely well. As William says, that represents the last of the sellers. That was their one shot of glory there, One shot of hope. When that thing gaps down, look at how bullish this candle looks. And look how nice. You have four really, really nice bullish candles in a row. This one has an upper shadow. At that point, you would have easily been able to increase your stop into here. So there's no way you're gonna lose. And if there's no way you're gonna lose, why not hold for a little bit more? Because remember, stocks are supposed to make new highs. That's what A bullish trend does. Bullish trends go higher. So if you see a previous resistance and you stop just short of that resistance, pennies away from the resistance, and then you start getting more and more buying pressure building, and you can already increase your stop to guarantee that you win. Hold for more. Simple as that. More to come on that. Next on the list, let's talk about how many shares just to make sure you guys are still comfortable with this. How many shares with a $500 risk unit? Here's your setup. Go. Just to make sure that you're all still with me from either the beginner's program or if you're brand new to rlt, you're gonna learn something. I'm not gonna go into the R unit today. Just wanna make sure you guys know what's going on. I have a trader saying I'm looking at the charts the night before. Am I looking at hourly or daily? You're looking at daily and maybe a little bit of hourly as well. You can look at both. Why not look at both? But preferably, I look at daily charts. All right, you guys are saying 337. 338. Somewhere right around there. That is the correct answer. $500 risk unit. Very easy. 3056 minus 2908. Take that number divided by 500 and you have the correct answer. 337 or 338. Kind of up to you. All right, so it looks like you guys all got that point. If you don't know what that means, if you don't know what R or risk unit means, please pop back over to the beginners program. So here's a GIF on Hammers. This is a little bit of a gif. And remember, if you want these slides, text the word Newsom 255444. This GIF will come with it. Who wants this gif? All right. Jason's gonna get promoted. So again, you can watch this kind of play over and over and over again, but this is an example of a perfect hammer. Boom. Nice lower shadow. Breaking the low. A little bit of an upper shadow. Entry below, stop. Sorry. Entry above, stop. Below. Austin says text. What? What's the number, man? I'm sorry, guys. I thought. I apologize for going so fast. Newsom. And it's 55444. That's it. Graham says I will email you for the slides since I live in Brisbane. Don't email me. Email Ricky. He is your point of contact. Rickyelifetrain.com. he's in Brisbane. As you know, Graham don't email me. Email your boy who lives right down the road from you. Christopher says, I'm assuming hammers on larger time frames carry more weight. That is correct. Yes, yes and yes. All right. Beautiful stuff. So again, as an example, this was a trade that we set up actually in the beginners module. And I want to kind of follow back up on it, right? This is a daily chart. Beautiful hammer, upper shadow, bearish candle, following gorgeous entry. Type in a 7 if that's one clean, beautiful entry. Clean, clean, clean, clean, clean. I mean, that's like fresh sheets and a warm, nice bed. You got to get in right above stop, right below. This type of order would be. And this type of order would be a stop limit and a stop market, as you guys all know. So the stop limit is how you're gonna be getting into the trade. The stock markets are how you're gonna be getting out of these trades. And obviously would plan for a break above that resistance. Remember, just because you have a line on your screen, my friends, doesn't mean that it's the all important line. So like I mentioned just a moment ago, my friends, I talked about holding for more. Just because you have a line there doesn't mean that it's the line that everyone in the world is going to sell at that price. What you do is you can create a rule for yourself that says, okay, if we don't break out of this price in a certain amount of time, then I will do xyz. And that's really the objective, that's really the goal is to kind of come up with that quantitative figure and value for what you do and why. So here's what this order would have looked like, right? So you're buying your shares. This is what your stop limit will look like in the vast majority of brokers. So the vast majority of brokers, you're putting in your stop limit, you're gonna have an activision, a price and a regular price. And of course you're going to do good until canceled. That was a beautiful, beautiful trade on Kimberly Young. So this is what a stop limit order looks like in a broker when you're selling the position to get out of it. You're going to do a stop market, right? That is your stop loss. That's how you protect yourself. And. Let's talk about this particular candle right here. Michael says, can I see the stop limit? You want me to go back? Okay, give me one second. Michael needs me to go back to the stop limit. There you go, sir. Amy says, can you Set the stop at the same time you can? Absolutely. Yep. In TD Ameritrade on their online platform, you can do what's called A one triggers OCA order and you can set your entry, you can set your stop loss, you can set your target all in one go. Michael says our stop limits always the same. Yes, sir. For the vast majority of time. Paul says, is that called a bracket order? Yep, it definitely can be called a bracket order. Absolutely. So if you're in TD Ameritrade, you could do A one triggers OCA order and it will be your entry, then a stop loss and then a target all automatically created for you. So it builds it where it's pretty systematized. Yeah. Amy says, nice. It is pretty nice. John says in Interactive brokers too, of course, IB can also do that. Yep. Brad says, is the stop limit the same as stop limit on quote? Yes, sir, it is. Good. Questions? Any other questions while we're here? Trevor says the IB Chart Trader is a super tool. It is very, very nifty. Agreed. Steve says, what if you raise your target, you simply go in and modify your limit cell. Steve is all you have to do, just go in and modify your order. Yep. Do not get charged commissions when you modify an order. Only when the trade goes through. Lottie says I cannot find the one trigger order on a trade. For what broker? Lottie says E trade. This is not a. This is not a chart of E trade. I'm not a. I don't personally use E trade. If you join our community of traders and you subscribe to one of our trading rooms, I can easily connect you with like nine people that use E trade. But I can guarantee you that they have them. Yep, I know for sure they do. That's called conditional orders. But it definitely, certainly can be done. Try finding conditional orders. And again, guys, I know it sounds crazy, but this is where I gotta pause. Because a lot of traders don't know this. A lot of people don't get taught this information. A lot of people do not know that it exists. Robin says you might also need to call your broker to activate it. That is also true. That can occur sometimes. All right, nicely done. I think we're getting it. We're making money moves. Ladies and gentlemen, let's talk about the shooting star. Steve says, what are you drinking? I'm drinking water. Shooting star. So you can think of this as an upside down hammer to be called a shooting star. Right. The upper wick should be about 2 times size of the candle body. All right, let me upgrade Jason, so he can become a moderator. Give me seven seconds, team. Let me take care of that really quick. Okay, There you go, sir. All right, so I love shooting stars to have small lower shadows and be occurring at resistance. Arifat says this is the bearish trade. That is correct. This is the bearish trade, especially when it occurs at resistance. Indeed, indeed. So it's just an upside down hammer. It's kind of the way I thought about it. Those are pretty nice reversal candles. So this is a stock on the nse, which is the Indian exchange, and this is what a shooting star looks like. So, ladies and gentlemen, two things to talk about. Number one, did this stock make a new high or a bunch of new traders are gonna be getting in bullish? Yes or no? Yeah, a bunch of beginners, bunch of noobs, greenhorns buying up here like I'm gonna buy the breakout. Bunch of. A bunch of Trevor's getting in bullish up there. Oh man. So this, this shooting star occurs at resistance. It has an upper shadow. And here's the other thing that's really interesting. It occurs after making many bullish candles in a row. Who wants to count how many bullish candles occurred in a row on this one? 1, 2, 3, 4, 5. That's five buying candles in a row. Christopher says, is this the beginning of the evening star reversal? Yes, it is. Lydia says, do they work in lower time frames? Yes, they do. So we have that shooting star. But again, these are all factors that kind of boil down into this trade doing its thing, right? New high, bunch of white candles in a row, upper shadow, lower shadow. So you got some people are getting trapped. So based on that particular candle, here's how you could take the trade. Your bearish entry would be below the low of that candle and your stop loss would be above it. Now here's an obvious question. If you took this trade, let me rephrase. Here's an obvious question. Could you create this alert or drawing on your trade and just simply not take it? The answer is duh, of course. Because remember, sometimes not taking a trade can be just as valuable as taking it. You can learn a lot, you can understand a lot, you can grow a lot. You don't have to take every single trade just because there's a signal. Sometimes you can wait. Sometimes you can do the analysis and then you start burning the pattern into your brain. You start really, really getting an exact idea in science for what you like and what you want to see and what you are drawn to. And then you can start taking some Trades. Now, when this candle comes in, do you still like the setup? Do we still like the setup? A lot of you are thinking, oh yeah, I like this setup a lot. Now what's interesting is you have a shaved top bearish candle. We're gonna talk about shave tops in just a moment. You have immediate selling pressure. You also have anything else, any other type of candle that's interesting. Mr. Philip Williams apparently has been to the back trading marathon. It's an inside day candle. Yeah. So remember, this is a daily chart. So if it's a daily chart, I will say inside day candle. If it's not a daily chart, I try to say inside candle or inside 5 minute candle or whatever. But this is an inside day candle, which means the pressure is building. Alright, so everyone said they still like the trade. Did you get triggered into the trade, my friends, yes or no? The answer is yes, you did. Did you get stopped out? The answer is not yet. We're in though. You got triggered and you barely miss getting stopped out. But you didn't. We didn't get stopped out yet. So here's kind of how this trade ended up playing out. So the very next day you got a nice drop. Here's what's interesting about this trade. How would you have known to exit your bearish trade? Because you can see it didn't really go down that far. It barely dropped. So how would you have known to get out? And the answer is, well, there's a few different things, but one thing is this double bottom neckline could have been one indication. Second indication, you get a massive, massive one white soldier candle. And then the very next day you get your get out signal because again, you get this massive one white soldier counter. You had to be afraid when that candle came in. So now you have a higher low. Also you got a morning star reversal. You got a lot of things that are kind of going against you. Here's the challenge. When you play counter trend trades, you have to exit quickly. Simple as that. Was this a counter trend trade? And the answer is yes, it was. So if you're playing a counter trend, there's nothing wrong with playing counter trend trades. You're just gonna have to get out a lot faster than you would normally. If you really want to play something counter trend, you're like, man, Jeremy, I just want to play. Come on man, let me play a bearish trend. I want to get myself in a bearish trade quick as, as quick as I can. Well, if you're gonna, if you're gonna do that, it's bearish counter trend. Get in, get out, make your money, move on. Any, any sign of a reversal at all? Pretty much. Or if it's a target or if it's a 1R or 2R or any kind of level. If it's, if it's a counter trend trade, you're gonna have to get out aggressively and exit quickly. Now we mentioned some shave tops in just a moment or before. If you do, go to YouTube and type in real life training shaves bottom I have a really popular video. In fact it actually has zero down likes. I like to keep it that way. 88 up likes, zero down likes. It's a really good video. So make sure to click the subscribe button. But if you want to get my outlook and thoughts on shaved bottom candles, we're gonna talk about them in just a second. But feel free to pop over and watch that video and smash that subscribe button if you haven't already. Every one of you here already has, but just throw that out there. It is a good video. It is very useful. And if you like more information on candlesticks, I have more videos than you could possibly want to watch. But let's talk about shave bottoms and shave tops. One thing that you must understand with shave bottoms and shave top candles is number one, they can occur on any time frame. Number two, you generally very frequently will get a retest after a shaved bottom or shaved top candle. It's just going to happen. So when I say shave bottom, notice how this candle has no lower shadow at all. Now did it retest some. Some right there, a little upper shadow. You would have gotten some pullback. But really if you missed that initial move, this right here is the retest. That's the pullback. That's the one you could have caught and played a little bit more of a gorgeous, beautiful retracement. A good sell and a nice little drop. Shave bottoms and shave tops can be any color candle, but the daily shave candles are more rare on 24 hour markets like forex, futures and crypto since they're always moving. If you do trade cryptos, forex or futures shave bottoms and shave tops are just more rare. But they do offer incredible insights as to supports and resistances. Because when I get a shaved bottom candle, it has been my experience on both shaved bottom and shaved top candles that eventually the stock price will come back to those areas as a support or resistance. Seems crazy, but it works extremely well. They can be very good places for scalping. They can be very good targets for counter trend Trades. So notice this shave bottom candle. Like so. If I kind of draw this over here, I'll kind of draw a red line and look at the shave top candle, kind of draw it over here. I'm gonna take some arrows. Notice number one, a hammer candle. And you'll notice how we start breaking above once we start this really beautiful, very obvious double bottom pattern here on the US Canadian dollar. I'm gonna take out the Canadian double bottom. You would start trading to what? And the answer is simply you can have a target of this shaved bottom candle as a target because it's a really strong level of selling that very frequently does get filled. Same thing with a shave top shave top candles. Right. You'll notice. Look at that. How it just, even if it's just for a day, stock came up to that shaved top, threw in a little bit of an upper shadow and then kind of rolled over a little bit. So if you were scalping on the daily chart and kind of zooming into smaller time frames, you could have played that really, really well. But once this closed above that shave top candle, I think a lot of you Canadians know already what happened. But does anybody want to take a guess what happens when the US Canadian dollar pair closed above that shaved top bearish candle? Zoom, zoom, zoom. It went so high, man. That thing took off and then it really rampaged Jackson's. It was just like bang. Because when those shave bottom and shave top candles get taken out, it's a lot of people that are trapped. It's a lot of selling that gets rejected and a lot of people who have to exit their positions type of two, if that makes sense. If that's like a new aha moment for you when it comes to shave top shave bottom candles again, it works on a lot of different time frames and it's very, very fun to trade. And it works on any market. Does it work all the time? But it can work. Nothing works all the time. All right, here we go. We're gonna do some back trading. Here's the US Canadian dollar on a five minute chart. Now we have a super strong bullish shave bottom candle. Once this candle is in, it should be the short term bottom of this trend again. That's going to be a support level. It can be a very strong support level. And until this level breaks, it's going to be the support. Right? Because remember, shave bottom and shave tops are very strong candles. We did eventually come back down to that price and retest it at some point. But remember, when you get these shape bottom candles are really, really powerful indications of what's going to happen. So on this 5 minute US dollar, Canadian dollar, check out how nice this candle is and how it closes. Above all upper shadows. Type in A2. If you guys can clearly see that all those upper shadows or shorters or sellers or people trying to get out, get in, whatever, and you get the close above all of those, you really get nice trapped little trappy McTrapperton, little Trapzilla. So at this point, this is something that a lot of traders struggle with. We need to draw a pivot price because from here we need to find out where we're going to take the trade. Remember, all of this stuff is really cool in conjecture, but we gotta start putting it into practice so that we can make some money. If you don't make money, none of this is even. None of this is relevant. All right, if you're sitting around just looking at candlesticks all day, that's great now, but let's be honest, we all want to make a lot of money, so we need to draw a pivot. This is why I. This is the pivot that I was drawing when I was doing this back trademark. So why did I draw it there? And it's really, really simple because when I was doing this back trade, this is what I saw. Now I'm repeat that when I was in the moment, that was the resistance. Okay. And you had a support there, right here. You had a little bit of lower shadow over there, but that was a resistance. That was where the currency stopped moving. So I said, okay, let's draw a resistance there. Got it. Now, my friends, type in a six. If you now have a little bit of a perspective on what needs to break out if this is going to go higher. Yeah. So you have a price in point. Okay. Based on the candlestick, do you also have a level of support of where you should be looking at buying? Yes, you do. All right, wonderful. And here we go. So let's discuss the sentiment that happens right here. So the sentiment that begins to occur, you have sellers, you have buyers, and you have indecision. You have a lot of indecision. And this particular candle that came in right here, in my opinion, a lot of people started buying it up, buying it up, buying it up, getting really, really excited. And then it got close to that resistance line. Getting very close to that resistance line. Some selling came in and it gave you another pivot. It gave us another price. Because up until recently, that's the most bearish candle that we have. That candle has the longest lower. Sorry, the longest upper shadow relative to this one. So we know there's some selling in here. What's really cool about this particular pattern is this is what I refer to as the S curve. You had a breakout, a pullback, and a healthy little bit of a consolidation. So what we're now doing is we're waiting to see what's gonna happen, and then check this candle out. What type of candle is this? Yeah, now you get the doji. So in my opinion, you have a pretty good risk reward here. You have a little bit of an idea, like, if you're scalping this currency pair, I mean, your entry could be above there, because, again, you already know. Remember, folks, we already know that we've gone up to that price once and we've gone up to that price twice. We already get that there is an explosion coming. There is some type of move approaching, and bang, there you go. This is a. Yes. Curve. That S curve pattern is that pattern that gives you the ability to go, okay, as I'm drawing this, I see this particular level that really shouldn't break down. It doesn't mean that it can't break down. But as you see, when you start finding these patterns, you can draw a nice move. You can draw a nice, healthy retracement. We trade sideways for, like, an hour, and we don't take out that level. That could be a really strong signal to go. Okay, this is obviously a clear pivot. So type in a six. If you could start seeing that pressure build up. Right? That happens. That was a really, really good building pressure. And again, if you trade forex, you know, that's a pretty good move. Okay, that's cool, Newsom, but what now? Well, again, now, did we close above that pivot, ladies and gentlemen? Yes or no? And the answer is yes, we did. So do you think it would be normal for us to say if we retest this again, go long? Absolutely. Daniel says, I'm confused because you called the morningstar a strong, bearish candle within. The price went up. I apologize if I said that. The morning star is a strong, bearish candle pattern. Sorry if I misspoke. I apologize. And morning star is a strong, bullish candlestick pattern. I do not see any evening star reversal patterns or morning star reversal patterns on this chart. So sorry if I misspoke. I apologize. So we got a good close above resistance. Trevor says maybe means shooting star. Correct. So that's. That's 100% accurate. This candle is a shooting star candle. Absolutely. So remember, I'll Go back one more slide. One second. So on this particular slide right here, you are all a thousand percent accurate. This is a very nice, bearish candle right there. So what happens if it does not go lower? That's the point. It should go lower here. It's supposed to go lower. Based on that candle, there's a strong chance it's gonna go lower. So if it doesn't play it bullish, it could go lower. But it has to start taking out this level right here. But the problem is, if it takes out that low. The gentleman who asked that question, is the risk reward phenomenal right there? And the answer is not really. Not really? No. Because you have all of this support, resistance, and pivots to be worried about, right? You have all these levels. You have all this level plus, remember, volume and shaved bottom candle and strong, close above resistance. So what should the prevailing sentiment eventually be? And the prevailing sentiment should be bullish. Yep. Great question, team. Great question. So in this candle, when this pattern comes in, that is an S curve. That's a new high. Again, this is where a lot of newbie traders will buy right here. That doesn't mean it's a terrible, terrible thing. But how many bullish candles have already come in at that point? And I could make an argument that this is a bull candle. This is a bull candle. Let's call those bull candles. There's one. There's one. So you know a lot. Jeremy, what if it just does this? Yeah, well, you'll probably miss the move, because I promise that will happen. Guarantee you it's gonna happen all the time, like, every day. You know what? You know what also happens? This. This also happens where you get the retracement, we get the pullback. Now, here's what's really cool. This is something that's really, really key to understand. Super, super important. You're starting to stack the odds in your favor of what might begin to happen. Notice where I'm still focusing 98% of my attention on this candle. Has that candle and all of this volume still held up for the bulls? Yes or no answer is yes. What is. What is held up by the bulls mean? That means that we have not gone lower than that candle. Okay, Number two, Are we making higher highs and higher lows? Right. The answer is yes. Here's a high. Here's a high. Here's a high. Because remember, all of this candlestick stuff is garbage if you're not putting it into action. This is us putting it into action right now. This is it. Also, we have higher lows. So here's the higher low. So you have. This is a low. This is a low. This is a low. This is a low. This is a low. Those are all higher lows. So you have higher lows. You have higher highs. The. We have proper S curves. The dips are getting bought. And since we're talking about shave top and shave bottom candles, ladies and gentlemen, the point of this whole presentation, at least right now, is this a shaved top, bearish candle. And the answer is yes. Is it occurring at a resistance? Yes. Do we have a predominantly bullish trend on this particular chart is beginning to build. The answer is yes. Where should your entry now be? Over that candle. If we take out. If we go above, if we close above, if we break above and we get above that candle, all those shorts are going to be trapped, Right? And next slide. Boom. So when that candle comes in, are you in? Okay. And the answer is. You better be, because remember, here's what's really beautiful again, a lot of you guys got to think about this. When a bearish candle comes in and you want to go bullish, those are great signals, because a bearish candle should stipulate. Hey, I'm gonna go lower. That's what that candle wanted it to do. But when it did not go lower, what happened? All the bears got trapped, and therefore we went higher. I love it when I want to go bullish and then a bearish candle comes in, because now I have a level of where I want to take a. Take it higher. So this candle right here, call it whatever you want, but this is a bullish marbo zoo candle. Type in a 7. If you did not notice that, and it's okay if you did not. Not a big deal. Some marbo zucana. Which means what? Shaved bottom, shaved top. You probably were wondering when I was gonna talk about these things. This candle is about as bullish as you can get in. Sybil says pile on. Yeah. By the way, does anyone have a. Does he want to have a boat? Does he have a boat for me? Where's the boat? We're going fishing, and we need to pile this boat full of people, load it. I mean, that's a very bullish signal. Like, it's great. You get a cloth. That is a bar. You got to be bullish it. Now can you lose on the trade? Well done. Of course, everyone knows that we can lose on this trade, but it closed above beautiful resistance. Like, you're in. You got to be in at that point. The answer is, when Anywhere in Here, Anywhere. Anywhere in this red circle. You gotta be getting in the shaved candles. Have one. Now this is the Marbosu. No wicks on these candles. These candles are great if you're already in a trade. They're very strong, super aggressive selling candles. They're quite rare, actually buying and selling candles. There's also a term called long day candles. Now I say day. Hope you guys all realize that can be anything. It can be a long, weak candle. Like this week. This week's gonna be a long week candle for me. Long. You can have a long day. Can you have a long five minute candle? I generally would just say long, long day. Even if it's like a five minute chart or something. I have a trader saying Marbo Zoo as it has shaved top and shave bottom. That is correct. Indeed, indeed. Will it retest? Yes, you often will get retest of Marbozu candles at some point, but not immediately generally. Now here's what's cool. A long day candle gives strong indication of what the move wants to do. And they can occur on any time frame. Rob Thomas says, did you intend to plan the longest stretch of your running during the intermediate classes? The funny part about that, Rob, is no. I told Matt, who is here right now. I told Matt when he asked me am I going to do the Calendar Club, I was like, dude, there's literally no humanistically way I could ever do that. Because the last week I'd have to run five marathons back to back to back to back to back. And I'd have to teach class at night. It's like, there's just no way I'm ever gonna be able to get that done. And you know what Matt said, do it anyway. I was like, all right, fine. Sure. Okay, sounds good. So that's what's happening. Yeah, it's gonna be intense. Maloney says the candle in Tesla today is a Marubozu. No, it's not. I'll go look at it, but I don't believe so, but I will look at. Just a moment. All right, boys and girls, so quick question. Can you find the bullish Marbozu candle? Type in a 7 if you see it immediately. Oh, we got a bunch of sevens. Are you sure every one of you guys saw that already? Man, so proud of you. By the way, it was this one right here. So there's your Marbo Zoo. It's a massive candle, huge candle. There's also this one right here. But whichever one you saw works. This is also this one right here. The cool part about that is did every one of those eventually go higher? And the answer is yes. Now you did get some retest, you got some pullbacks, you got some rests. That's gonna happen. But when you find one of these candles, they're really strong. I do love them. They're just rare. One trader says, what if a marbos happens after many bullish candles? Ooh, great question, great question. I then will wait for a pullback. If I'm in, If I am in a trade and Amara Bozu comes in, I will sell. If I'm already in and there's a bunch of bullish candles in a row, and then boom, massive marbozo, I'll sell a lock in profit. It's a really good question. So speaking of Tesla, how about we pop over here? What do you guys think? Could this call. Could this be called a long day candle? Now again, this is a 5 minute chart, but this could be called a long day candle. Absolutely. Jason says, I love me some Tesla. Steve says, what about the lower wick? So remember, Steve, I'm not asking is this a marbosu candle? Was not the question. Because you're right, it's not a marabozu camp candle. It does have a nice lower shadow. But it is a long day candle. How do I know if it's a long day candle? Just look at all the previous ones. All these pre market. I mean, this is. This is like the biggest candle on the screen. It's huge. I have one trader saying I will wait for the retest. Oh, nice. Okay, one trader saying huge volume is coming in. All those things are accurate. So if you have a long day candle with huge volume, notice one other very particularly interesting candle pre market. You guys see the particularly interesting candle pre market on Tesla? Any, any idea? Maybe this hammer candle right here. A little bit of a hammer right there and then you got this hammer. Matt says, can it be a long day on a five minute chart? Yes, that's why I put it in parentheses. Long day. See, I will say long. I don't say long five minute candle. I just say long day candle. This is a long, big bullish candle. Huge volume. So how should we be playing this one, my friends? Any guesses? Do we take a breakout? We're definitely playing it. We already know we're playing a bullish. Are we getting above this candle? Scott says he wants to play the retest of the hammer. You want to play the retest of the hammer. What do you guys think? Scott McKay wants to get in down here. All right, if you say so. Scott. So let's go through all the pieces of the puzzle that makes this nice. Even though it's a five minute candle, we can clearly see its size in relation to the other candles. Notice the trends. We have is a pre market chart and this five minute candle. What is the trend, folks? All we have is the small little bits and pieces that we have in front of us. What is the trend? Bullish. Whoo my. Oh boy. We doing so good. So you notice the trend, you notice the volume. Look at the close. Look how it's taking out all the previous resistance. And then that candle, that hammer candle. Pre market. Mmm. So let me fix this typo. The way this five minute candle could be played is exactly the same way I would approach it if it was a daily candle. That's the interesting piece of this. Remember, candles can work on any time frame. They work on any setup. The sentiment is the same. Sometimes they work and sometimes they do not. Alan says, was there news? I have no idea. I don't read the news. Not sure, man. I'll just trade the chart. Sometimes there's news, sometimes there's nothing. Just takes a lot of time to read stuff I read all the time, just not news. It's a good question though. Well, that's what's important. I would play this candle even though it's a five minute chart. The takeaway, my friends, is I would play this on a 5 minute. The same way I'm gonna play it on the daily. I'm going to look to by the dip, AKA buy the salsa, AKA buy the pullback, AKA buy the retracement, AKA buy lower, sell higher. However, you know, call it whatever you want to determine it. That's what I'm looking at doing on this trade. Here's a question that I get probably top 10. Lottie says, AKA dunk the chip in the avocado. That's right. AKA get some seven layers on this chips. Trevor says wouldn't a possible gap from yesterday's close depend on your entry price? Wouldn't a possible gap from yesterday's close depend on your entry price? Yeah. So if it's a gap and go, you can be more aggressive. If it's a retracement gap, you can be a little bit more conservative. If it was a gap and go, Trevor, I probably would have had an entry to get in above the highs of the pre market before the market opened. Would you agree? If it's a very strong gap, if it's a retest gap, well then I'm going to Wait for what? The retest. Now, this is honestly top 10 questions. I get the most. How do you know a stock is going to bounce if we get in on a pullback? How do we know it's going to go higher? What's the answer to that question? Can you guys help me out with this one? In fact, can you answer all the emails that I get with that question? Oh, man. All we know, my friends, is the trend. That's it. We know the trend and we know our risk. Right, Maloney? And you keep your risk the same. Right, Maloney? So you keep your risk the same. You know where you're going to get into the trade. You take your play, you find the trend, you take your risk, you take the trade, you find the trend, you take your risk. It's the same thing over and over. No one knows if it's going to work. I don't know. I mean, I have some ideas sometimes where I'm like, I think this is gonna work, but I don't know. I can guess. I'm a real good guesser. Me and Scott McKay guess every day. We guess all day, every day. Now, let's talk about your order limit. Order. 705. Stop loss if you're conservative. 685 if you're a little bit more aggressive. 693. Now, you'll notice that my green line is a little bit higher than that hammer. Why is it a little bit higher than the hammer? Who can tell me that? There is a reason. There's a very specific reason. Mike. Nailed it. Wow, Mike. Good job. Mike says it's a 50% retracement. Exactly. Alan says, would you do a call option trade? It's up to you, man, how you want to play this. It's bullish. So up to you. If you want to buy calls, great. I've made hundreds of thousands of dollars on call options on Tesla. If you want to play shares. Awesome. I made hundreds of thousands of dollars on shares. What if you want to sell puts? Cool. I made a lot of money on. I mean, whatever you want to play, it's up to you. Alan says they're cheaper. They are. They are. They are cheaper. They are cheaper, but they come with added risk. So the reason that I'm not putting my entry right on top of the hammer is because that would be like a 63% retracement of that candle. I just feel like that's a lot usually. And here's the big takeaway. Usually, long day candles retrace about 50%. Usually long day candles retrace about 50%. So the 705 would be a limit. Order in your broker to get on the pullback. Go ahead and type in. What number of stop would you have on your setup? 693 or 685. Are you more conservative or more aggressive? Which one's right? They're both correct. I would do the 685 because I'm a chicken and that's pretty much it. I'm just a giant chicken. Matt would buy at 7:05 and have a stop at 7:04.83. Matt loves the tightest stops possible. Just kidding. He would definitely take this trade though because he, he is amazing. So 7, let's say 707 or 675. Whatever would you gotten filled on the pullback? The answer is yes. By the way, this was a trade that we did take in the morning day trading room. This one right here, this was an exact trade about two and a half three weeks ago. Exact same setup. 707 by 685. Maloney says, I remember. Yeah, this was a beauty, beautiful trade. Now remember the way I, the way I trade. I'm very boring. I don't do anything exciting when I'm setting up these trades. It's like oh cool, it broke above the high. I'm buying retracement, set myself below. Look, it's really basic. If you ever do at any point in time, think it'll be valuable for you to be around a bunch of people who are doing this for a living. You know, pop into the room. But yeah, that would be the entry. Do you know it's gonna bounce? No, you don't. Did it ended up bouncing. Hooray bouncing. So again, this is a five minute chart. So on this five minute chart you could exit some or all of your position. It's up to your rules, up to your plans, kind of deciding up to you. For me, I love making one Rs in 15 minutes because I always want to sell and lock in gains and do something epic. It does not bother me at all. Now could you have held for more? Absolutely. Could you have exited a small piece of your position? Absolutely. Could you have done this exact trade with a swing trade, had a little bit more of a conservative stop? Maybe at 670. The answer is yes. You can really do any and all of that. I mean you could still be in. We have traders who are still in. Alan says could you do a runner? Of course. Could you exit half and move up the stop? Sure. The point is, you want to do something that is part of your plan. Albert says, jeremy, I thought if it works, I thought, Jeremy, you let it run if it works immediately. I do, I do. I'm just saying this is an example. This is an example. This particular trade, just trade sideways all day, didn't really do much, but I did end up exiting this particular trade around here because it did work immediately and I did hold it and I ended up making a lot of money. It was a good trade. It's a very good trade. Chris says, what about for smaller accounts? Smaller counts, man, honestly, is they're very, very easy to grow them. It's called being patient. There's no magic to growing a small account, man. Just takes a lot of time, a lot of patience. Like I was saying today in the afternoon swing trading room, you could buy three shares of Tesla. Doesn't have to be 10, 20, 100. You can buy three of them, be patient, hold them for a little bit, sell them at a hundred dollars. It's just. It just takes a lot of time. Alan says, is it okay to do odd lots? Yep. For those who are wondering, an odd lot is something other than 100 shares. If it's not in 100 share increments, it's called an odd lot. And it's great because now there's zero fees on pretty much all these things. That's really, really cool. As Mark Hinton is saying, Rob Thomas says, I started with a small account three weeks ago with real life cheating. Just following Jeremy, I've made 10 Rs. What? Nicely done, man. Nicely done. And here's a cool thing. Chris Stanley, just reach out to Rob Thomas and ask him how he did it. You guys are both in slack. Become good friends, start chatting about it. Yeah, ma'. Am. Or call me. I'm supposed. You. You mentioned last week that you're gonna text me when I could call you and you never did. And I hope you know when I'm running tonight, I'm gonna cry. I hope you know that. I'm just gonna cry all night. All right. I love it. Oh, man. Don't worry, Chris. I. I don't show emotions. Well, I'm definitely not gonna cry. I'm not gonna take it personal. Dude, it's fine. Here are some of my secrets of candlesticks, my friends. Large candles often retrace about 50% of their move. If I feel I missed the move, I set up a limit halfway into a long day. Candle, type in a one. If you got that. That's a Great secret number two, the open of long day bullish candles are often a very incredibly strong support. And the open of long day bearish resistance candles are often a strong resistance resistance level. So again, if you break below or above either one of those strong resistance levels, look to play them in those directions. Oftentimes what we're going to do is we're going to walk through the sentiment of this particular chart. We're just going to talk through it a little bit. We're going to do a little bit of trading, a little bit of back trading, a little bit of practice and discuss what would have happened or what could have happened and where. So right here, this candle, is that a long day candle, yes or no? Okay, you got a sure. You sure it's a long day candle. Okay, the answer is yes, you guys are right. It's a long day candle for sure. All right. So did that candle close below support? Yeah, definitely. Now, on that day, if you get a long day bearish candle, talking about what we just discussed, with a close low support, would you have a decent price of where you could get in? Based on what we just talked about, the answer is about halfway in that candle. Right. Somewhere right around here is where you could have shorted it. Where did you place your stop? Probably above the high of that candle. Right above there. Now, are you telling me, Jeremy, that you're showing me a losing trade? That is correct. I could show you millions. How long do you have? What's interesting on this particular candle is when I am wrong, there are two times I like to be wrong immediately and smallly. All right. When I'm wrong, I like to be wrong immediately and smallly. That's not. That's my goal. In this particular trade, it was neither of the two. Other than smally. Smally was not small. It was not small. It was definitely a full R loss. So I'm kind of pulling this particular chart up because it was a really good learning experience. What is very cool, though, is when I am wrong immediately, Mark says that's an Aussie word, right? Smally. Yeah, it definitely is. Yeah. Falco says, and right bigly. Exactly. Now we're getting the point. When I am. What. What am I even spelling when I am wrong immediately. What does that mean? Well, it means that obviously I'm doing something totally wrong. So prepare to flip. If I'm wrong immediately, I mean, within minutes, if I'm in a day trade or a day or something on it, I mean, I get in and I'm just hosed from the get go. That's when I have to start going, wait a minute, what did I do wrong? And sometimes the answer is didn't do anything wrong. This is the trend is changing. The reason I'm bringing this up, when this candle came in, It's a long day candle. What did I just say about the open of long day bearish candles? What I just say just the previous slide. They are a good resistance. All right, so what happens when you get a close above a good resistance, AKA the thing that happens with this candle? Well, that means that all the bears are trapped, people are losing money, people are scared. Don't be in if you get stopped out, rearrange your position. Okay. Long day bearish candle closes above. It's a good bullish signal if anything. It's definitely not a bearish signal. People are trapped, people are scared, people are losing money. So what should you do next? Well, since the bullish candle also happens to be a long day candle. Good old, good old ldg. Yeah, you know me. Sorry, not even LDG is ldc. Oh boy, it's getting late when that LDC comes in. Yeah, you know me. Alright, what should you do now? What should the plan be? We close above the resistance. We trap the bears. We have a LDC long day candle plan to get in on a pullback of 50% which have been there. And your stop loss would have been either below the low of that candle or below the low of the morning star reversal. Either one. And could you have made the smally loss back with a bigly win? And the answer is yes? Absolutely. Now, would you consider this to be a long day bullish candle? Yes. And did it retrace 50% of that candle? Yes, it did a little bit more, but it definitely pulled back to at least halfway. Halfway would have been right about there. So you'd have gotten filled somewhere over here. That would have been the spot where you would have bought. You could have bought that pullback by the dip. And then you get another morning star reversal. And again, did you know that it would have been a morning star reversal? And the answer is no. When this candle comes in and this candle comes in, you're just assuming that you're going to lose. Your assumption is I'm about to get stopped out. And when that candle comes in, you're having a party. You're calling your buddies over for brownies, pizza and some fried chicken. We're going to have a good time. Woodshed Williams says, why did I used to buy at the high? Because it feels natural. Man, Buying high feels good. Buying high feels good. Don't be that guy, right? It just feels good because you get to see more. You get to see what it's doing. You get to see confirmation. You get to see more data when it's pulling back. You don't know anything, right? We don't know. It's scary. Buying low feels very scary at first because you don't know if it's gonna bounce. You're terrified, you're upset, you're panicked. All those things you just don't know. Remember, I know all of you guys follow me on Twitter. If you don't, you should add newsomenuggets. Do you remember when I was posting, when the market was just absolutely getting hemorrhaged? I posted, I feel like a real giant dumb face for buying right now. I posted it like five or six different times. Like, man, I feel like a real stupid face for buying all these positions. But man, I don't really feel that dumb anymore, you know? Like, I feel better because I bought low. That's the point. It's all about the sentiment and understanding all of this sentiment. Now, who can tell me what chart this is and you will get an Internet high five. What chart does this belong to? What company? First person tell me is an Internet high five and then we will be wrapping it up. It is not Apple. It is not amd. It is not Tesla, not Spy, not Roku, not Facebook, not Square. This is a daily chart, Christopher. Not Baba, not Mu. Oh, this is gonna be a tough one. Who's gonna get it? Ricky? Caden? I'm looking at you. Not Activision. Nope, nope. A lot of good guesses. Nick Ferreira. I got it. First Google. Nicely done, Nick. Nicely done. The hint there was Internet high five. That's okay. I like to bury my hands pretty nicely. This is Google Internet high five. Nick, coming your way. So technical analysis, in my personal opinion is amazing for day trades. It's amazing for swing trades. Trades that last less than a year is amazing for income generating trades. Because my friends, cash is trash. Cash flow is king. If it's just sitting there doing nothing, right? But if you can go into the market, we have the ability to pop into the market to look at some trades to find some patterns that we like to find, some setups that we like to find, some risk, reward that we like. Get in, get out. Boom, boom, boom. Snag it and bag it, baby. Snag it and bag it. Collect and protect. Take your gains, Keep them safe from the wolves. Spend them for your family. Enrich some lives and become an amazing human being. What questions do I have? If you want copy these slides. Remember, text the word newsome, which is my last name, to the number 55444. You can also email me if you have any questions. Jeremyellifetrading.com Featured on the screen are two women who are absolutely incredible traders, both December and Arabia. And they're gonna answer any questions that you have. What questions do I have for you? Nate says, which type of training do you do the most? I do a perfect blend of day trading and swing trading. Yeah. Alan says, mahalo. Ariel says, it will not work for Canada. Sorry, Ariel. It's too bad. Frank says, what about the Canadians? You guys all have my email address. I mean, everyone here has my email address, so you should know what to do with the email address. Chris says, how many miles do you still have to run tonight? Oh, that's a good question. A simple half marathon. No big deal. Just a good old classic halfer. Easy, like a walk in the park, man. Nate says, Six and a half miles. No, 13 and a half. Lydia, that's the best question of the night. Lydia says, how can I join your chat room? Oh, Lydia, I wasn't even gonna do a sales pitch. Let's do it. Pop over to Real Life Trading dot com. If anybody does want to trade with me at any point in time, during any room, you're more than welcome to click on Live Trading. These are my trading rooms. Full disclosure, if you have over $10,000 in your account, any of these are insanely adequate. If you have more than $10,000 of liquid cash and you're not in my rooms, I don't know what you're doing. Not really sure. They're really good. They're very helpful. It's not me that makes them good. It's all the people that are invited, that are there, that are inclusive, that are helping, that are answering, that are posting. We got traders from all over the world. We have an entire group dedicated for just traders on the other side of the world. Real Life Trading Australia. It's an RLT family. It's all about the family. Let me read My boy Alex. My boy Alex is killing it. Alex says, the day trading room is so worth it. I learned a bunch. And you get to hear a Brad rant about an industry every Wednesday. That is a fact. Lottie says, is there a combo? Yes. If you do everything that we have to offer, it's 349amonth. Yes, yes and yes. Totally, totally worth it. Steven says, great work on Benzinga, man. Thank you so much. Nick says I signed up for the combo five minutes ago. Oh, yeah. It's about to be a party, folks. Nick signing up. And again, folks, my objective here is just to help everyone. Yeah. We trade together. We have fun together. We enrich lives together. I want to appreciate you for being Here in module 1 of the intermediate Series. You are all my heroes. It is my honor, my privilege, my pleasure to serve you. I will keep bringing high energy. I will be back tomorrow. Tomorrow I will be doing 28 miles. The next day, I am doing 29 miles. The day after that, I am doing 30 miles for over 450 miles on the month. I am here to prove to you, ladies and gentlemen, that anything is possible with your mind, with your body, or with your bank account. I can help you get there. We can help you get there. The team, the family, we are all here for your benefit. Let's grow together. You are amazing. And until next time, love life, live life and trade it. You rock. Bye.