Feb 26th, 2024 Ultra Wealth Volume Trapping
Live trading/coaching session led by Jerremy Newsome (Feb 26, 2024) focused on "volume traps" and pre-market capitulation. The group reviews multiple ticker examples (CRSP, EPAM, SQ/Block, PANW, ETSY, MARA, CCJ, etc.), discusses multi-timeframe analysis (daily/weekly/monthly), use of 100/200 SMAs, trade execution rules (entry, stop placement, pyramiding, protective puts, covered-call/put-selling tactics), and gap/gap-and-go scanning using Finviz, BarChart and other tools. Instructor emphasizes planning trades in advance, earnings-season gaps, and upcoming lessons on Elliott Wave and options in April.
Chapters
Do it.
How are you, miss? You have an awesome weekend?
Weekend.
It was great. Yep.
Sweet, great weekend.
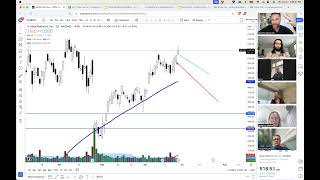
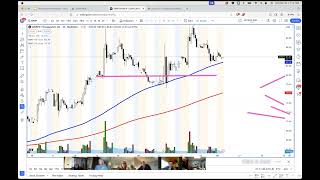
Sweet, sweet sweets. Okay, recording is turned on. I got this pulled up. So today will be pretty easy. Jason Chase, I'll admit to you, today's gonna be like a little bit of a review, kind of a, just a reiteration of what we've definitely talked about before, but this time just a little bit in slide format, a smidge. So a lot of you will have known this and we'll know this. And again, it's just kind of part of what we're continuing to talk about, about gaps. So this, this week, the two things that we're going to be really discussing will be volume traps and pre market capitulation. Just really analyzing that pre market chart, seeing where we should be buying, see where we should be selling, kind of like understanding a little bit about earnings as it relates to what it's doing right in that pre market session. So it should be pretty good. And then of course, as we go through all that, we're going to review some charts that you guys posted. WhatsApp, right. Nancy has some questions about some trades, look at some individual trades, talk about that, talk about some of the positions that you're in, make sure that you're comfortable. Our girl sue over there is just flying high. So just want to make sure that we're, that you guys all got your positions and you got everything. And then we just, we. Everyone knows where everyone's at and you're all happy. So that's what we got going on for today. And then just as a reminder, our Thursday session is moved to Friday. So that's all. All right. Volume traps, pre market. So volume traps. We've already spoken of it. It's just one of my favorite things to look for. And with earnings and with gaps, you get traps. Gaps and traps. This is a stock that we were looking at relatively recently and kind of talked just a smidge about it. Is CRISPR Therapeutics a very, very interesting company. Again, from a biotech perspective. If you're into like health, wellness and longevity, this is a fun one to just kind of like talk about. But you'll remember that we've discussed a time or two how a lot of times you'll get a nice little pump before earnings on, on some stocks, not all stocks, but I think I would say it's over 70% that you, you can get a nice little pump before earnings, especially if you get a good volume trap. And this is a really, really beautiful example of that. So huge bear volume. And what's super nifty is that bear volume randomly also happens to occur at the exact same price that you had really big bull volume a couple of weeks before that. And that price was a beautiful resistance. Now, I didn't sell there personally, but someone did. Let's call them the orange traders, right? Whoever sold their and made money, sold there again and made money. We got a really, really cool drop from that particular price on crispr. We came down, started interacting with those long term moving averages, which would have been really good for some of my option fans. I know we're going to be talking all about options in April and doing tons and tons of trades together in April with our option setups as well. But then you got just this really good consolidation, really, really good pressure, movement. And then we popped Tom and we closed above that volume, trapping all of the bears. Again, depending on what day you would have taken the trade. But one of these three days was, was a nice little move. And again with earnings again right around the corner. It might not seem like a lot, but as Nancy will tell you, if you're reviewing a bunch of charts and you're, you're just saying, no, no, no, no, no, and then you see a really clean setup and you pile in on that setup for that, it could be a day, a week, a month, but it's just all about premium capture and movement capture. I mean, if we're taking that trade and we get in at 7750 and we sell it at 8750, that's going to be $10 a share. And being able to track down high probability trades like that absolutely exist very, very frequently. And it's just tracking them down, seeing them. You'll also obviously remember since we talked about it last week, if you, if you looked at CRISPR Therapeutics and you saw potentially a high volume short flow out there, and you're like, wow, the short float's pretty high on this. Let me, let me kind of analyze and anticipate what it might do based on some type of move. So if I pull up crisper CRSP and let's go look at the daily chart. I'll pull up the daily chart really quick. This is what it did on earnings. So this is, this is the daily and the chart that we just looked at. And this was, this was a trade that your boy did take. I was ironic enough as I was building this class, right? That's the cool part about doing all this research is as you're doing the research you see really good trades but you had a good breakout, right? Really nice. Oh, look at all the bull candles in a row, right? Bull candle, bull candle, bull candle. Tons of bull candles in a row. Look at how we're interacting with that big bear volume. You'll notice and we're going to look at some multi time frame analysis in just a second and we'll see what this purple line is. But you had all the bull candles in a row. Really, really big breakout. Close above all the bare volume. Tons of traps, earnings coming up, retest of something and then a quick little pop. That was it and that was earnings. So now earnings are done and this is still probably one that we could and continue and we can just kind of keep an eye on. But now if we're like, all right, well what's this big purple line for? So here's your daily moving averages. We can see how those held up as a really good support. My favorite moving average is to use for sure without question is 100 and 200. Then I go look at the weekly and we're going to notice what, we're going to notice that little pesky old 200 SMA on the weekly, right. This is going all the way back to week one and week two using all these moving averages to our advantages on whatever we're trading. It doesn't matter. Bitcoin futures, Forex, it's like you're scrolling through and we are going to Talk more about 27, 247 markets later in class as well. But I, I think just really being able to see all the patterns and just knowing that none of this stuff changes, it just gives us, it creates this opportunity. And then here on the monthly chart, right. There's not a whole lot to see specifically as far as moving averages are concerned. But you did have all that big bear volume and you had this inside month here. There's some compression, maybe a little bit of a double bottom. And again if you're looking at the chart then you'll see that we've been all the way up to 200 in Jan of 2021 and we, we could go higher. So we've also talked about how you can start really analyzing bigger price action on bigger stocks for potential bigger moves into the future. Right. So if you're like, okay, cool, let me figure out what this particular stock does and start looking at their earnings and start looking at, you know, YouTube research only if you want to. You by no means have to. But if at any point in time you start seeing particular names or you hear names or you, they pop up in your networks and your meetings and things like that, that's where it gets really, really nifty. This is just as far as opportunities go. So again, we're going to be talking pre market a lot more on Friday, but just so that we can see a little bit of glimpse of that. So here's the hourly chart. And on the hourly, again, this, this move here, this is all the pre market movement from earnings. Was it all this little chop? So let me, let me hide my drawings, my lines here for a second. Now again, this is the, this is the hourly chart that we're looking at right here just so that we're, that we're clear. But if I turn the, all my drawings off just so you can see the moving averages again, you'll see how we interact really nicely with the 100 right here. But if you knew, if you, if you happen to know that the 200 on the weekly chart was here, would that have given you maybe some security to buy some shares at 80, even if you're setting a stop at 70 or 72 or 74? Because again, you're just using that multiple time frame analysis. And now you're also using the fact that you have all these people that are trapped, that are kind of hosed, that are, you know, getting squeezed out of this position in the stock slowly starts to pop a little bit. And again, I think that we should all just keep an eye on this particular stock. I think we should, we should slash, could start doing some research on it because they are, they are solving a lot of actual problems that they're pretty pervasive in the health space. And they had a really, really interesting earnings beat. So they thought they're gonna get 6 cents this year. They got a $10, which is kind of like Nancy Jones, is that, that's her income. That's the way it works. She thinks she's only going to get this amount and then she just trades so prolifically. She makes so much more. All right, so that's the volume trap one just kind of like some analysis of it. Let's let me walk you through a trade that I absolutely got smoked on and go through that one really quickly because I always like to show losers and how losers work. And I mean, I got absolutely trampled on this stock. This was, this was super fun. So we have a gap down, right? Bear candle gapping down. You have good volume. Now I granted looking at this chart, my boy Eric would be getting in down here because he's you know, he's better than I am. So you get the drop, you get the consolidation, you get the compression, you get a nice little pop. Because we're thinking that this gap's going to fill, right? And 80, 86 gaps do fill. For some particular reason, I took this trade late. I don't remember exactly why, but I got in on the retest of this volume trap here. So I got in on the retest of that volume trap, Big bull candle close above. And I was really enjoying this compression. And in my brain, my brain was like, this is going to happen and you're going to make so much money. Congrats, Nom, you're so special. And then the exact opposite of that happened. It was so funny. It was a four hour loss that open. I was like, hooray, this is the best. Because it was just a random gap down, right? It was an earnings, it was some type of downgrade and I liked it. I, I attempted to day trade it. I couldn't find a good day trace it up. I just got smoked, which is fine. You know, you're gonna lose on some trades, it's gonna happen, get over it. But I still saw a bunch of bear volume. And I just said to myself, right, Eric, same thing. I'm like, all right, cool, I lost on that trade. Whatever. This strategy doesn't not work. Just didn't work that time. So when the stock closed above, I took the note from last time to not get in, you know, to wait for a retest of that volume. So I did wait a little bit. So I did not get in there with the close. I did get in on, on the actual pullback. So I was able to snag an entry somewhere around here. I don't remember the exact day, but one of those three candles, I got in on the position and my stop was below here. Right. Which makes sense. Knowing that was going to put it, I was going to put it here and then here as a reminder, I always know where I'm have my stock on everything.
Where was your first stop when you lost in that big gap?
Oh, yeah, good question, brother. So I entered, I think here, stop loss was below there, right below that candle.
But it gapped up overnight. So you didn't get taken out.
Yeah, exactly. Yeah. Gap down. So it opened, it opened below my stop loss.
And you got taken out right at open.
Yep. Yeah, yeah, I got take. And this is, this is why I just wasn't watching. I didn't even notice that it was gapping down. I could have maybe Exited pre market or whatever, post market. But I, I didn't, I don't know why, wasn't looking at it, didn't notice it. It's gonna start happening. And by the time I woke up I was like, oh, this is going to be an ouch town. This isn't going to be the best. Yeah, that, that can't happen. And that's why I wanted to bring it up to you. This can certainly, certainly occur. Eric, what's a good way to protect yourself in case something like this happens? Is there, is there a thing that you can purchase in the markets that protect that just in case it ever happens?
You could have bought a protective put.
That's right. I could have bought a put. Now I didn't plan on buying a put on this particular trade, which is fine, no big deal. I wasn't in a collar. But that strategy still exists. So even though you have stop market orders and things of that nature, they can always get skipped over. And this is just one of those really great examples. But you'll see that this is a kind of a decent little review of a lot of the discussions that we've had in the past about getting in based on some volume. So good, close above volume on that candle. I did get in on some pullbacks. I have my stop all the way below the low this time and I, I was able to exit here. I eventually added to my trade just a little bit. And you guys might remember this as well from week four where we started talking about adding to trades notice multiple 10 EMA candles right here. Right. So you had a lot of bear counts above the 10. We got a little bit of breakout. So I, I sprinkled in some additional shares trying to be like Joe, I can't have her make all the money in the group. So I moved my stop loss up a little bit after that pop happened and just. And sold when we filled that gap or, or got very, very close to that gap hill. I wasn't able to make my whole lot back, But I made two hours on that trade. I lost right around four hours, like 3.8 on that first trade. So I still lost overall. But the, the, the reason I'm walking through this is because the volume was still the reason I got in back into the second trade once it closed above because all I said to myself was okay, if we. Right on that day I began planning the trade that I ended up taking a month later. And that's really the process I'm going to continue to hammer into our, our brains Ladies and gentlemen, is it's all about the trades that you don't take, because there's billions of them. The trades that you do take are the ones that you have to talk to yourself. You have to say what you're going to do. You create your plans for the future. And as you create those future plans, you look to figure out where you're going to get in and then get in with some size that you can make some money. But just make sure that you know what you're doing and you're aware of why you're getting into the position. That's really going to be the most important key. I don't think there's any questions on the trade, but if you have any, please let me know. I got an. I got another one on this particular stock that I've been keeping track of it. It's just a. A random stock that's out there. Million of them out there, because you're going to love the next one. All right, so this was a trade again, this was last year, sometime kind of mid, mid year. And then in November, I snuck in a cute little R on this trade and got back, and pretty much I'm pretty much at break even on eam. Although granted, I could have held for a lot longer. And this is, this is the recent gap that just had on earnings. So it's going to be fun for us to watch if you want to. But again, just as a reminder, when you get a lot of bear volume at a low, I say a low. Like this is a relative low. We were, you know, we were down a decent amount. We'll look at the chart in just a moment, so you'll be able to see that we, we were. We were lower, lowish, semi low, kind of low. And then you had that gap up on earnings and you had the beautiful, beautiful bear volume with this gorgeous indecision candle. And the next day. Ms. Sue, what happened?
You gapped up.
Yep, we gapped up. You're absolutely right. What else.
Is that? A bare candle. Before that, the indecision. Like the bare shat pattern.
Yeah. Nice. Yeah, absolutely. Absolutely. So we gap up on that day. We clo. We also closed above the high, like instantly trapping all of that bare volume. So you just have some really, really good trap in here. And that was just a straight up volume trap team. So I got in bullish there with a stop loss there and was able to get out right there to capture that one additional R back. So I was able to keep chipping away at that loss. Just based on that. Now again, had I held, which I didn't, never, never can hell hold everything perfectly. That would have been another really, really nice trade. But this family is just recent, this gap, which is nice because now you have a double gap action, which is a, you have a gap down and then you had a gap up. So you have a double window of price action around 280. So what does that mean for us, slash for you? Well, again, if this comes on your radar and you schedule, put in your calendar, hey, let's go look at epam. And you put this in your calendar two and a half weeks or two and a half months from now and you notice that EPAM is coming down into 280. Tom and Post a really good reversal signal off the 100 on the daily and 100 on the weekly. Could you do some strategies that make some money as it goes up, down or sideways? The answer is probably. And again, that's really the ultimate point of all of this is to just see how everything kind of blends. And then next month, guess what we're doing all of next month. Oh, yeah. Oh yeah. We're going into the matrix is where we're going. Next month. We are, we are predicting how the markets move and it's going to be everyone's favorite. It's, it's my biohack of the markets are Elliott Waves.
Yeah. You can't unsee them once you see them.
No, no, they're going to be there forever. So it is, it's so cool. And yeah, you know, we're going to have, we're going to have a blast with wave count. All right, let's, before we go look at Etsy on that chart. Let me just pull up this one eam. Just so again, you can kind of see this is, this is where we are present day. So we're getting some consolidation right now. And I'll pull up the longer term chart in just a moment. But again, going into earnings, right, if I, right before earnings came out, I did not do this trade. Mostly just like I can't be in everything. But if we go back a little bit, this would have been a trade that I could have absolutely taken some position over earnings and also just kind of planned on what it might do. So if I zoom out on the weekly, what, what pattern do we see on the weekly? Pretty clear, right? Really nice bottom. Yeah, really nice double bottom. Great double bottom. Good consolidation. Here's the 100 on the weekly. So you have that, right? So you got the 100 on the weekly. Oh my gosh, we're bouncing off 100 on the monthly. This stock was at 700. It's crazy volatile. What a fun stock to watch. So you have all kinds of things down here. This is one that you don't necessarily have to had to buy shares over earnings, but based on all of those factors, there actually was former option friends, there was good option premium down here just depending on what expiration and things of that nature you're selecting if you wanted to own some shares. That one was, was a pretty nifty little options trade that we could have taken advantage of. Again, putting all this research together, doing the daily, weekly, monthly research, the 100, 200, really looking at everything, analyzing everything, knowing where everything is at, interacting with the whole price action of the markets, just seeing it, knowing it, feeling it, and then that gap up is really pretty. So again, this is present day. So for me it's relatively simple. I'm letting you all know if we do this, I will be getting in maybe playing some positions off of 270 on EPAM. Might be a week from now, might be two months from now. If we continue to consolidate into here and just really, really trade sideways and then we end up breaking out, I'll most likely be in that position as well if I'm not in a bunch of other things beforehand. But this is a really interesting looking chart and it really does meet a lot of, a lot of our criteria that we've been essentially studying and reviewing and practicing. Okay, hit me. Question. Yes, ma'.
Am.
If you're gonna buy the shares and then buy protective puts over the earnings, do you calculate that amount of the, what the puts cost you into your R or is that on top of the R?
Yeah, I try to, I try to factor that in depending on just the overall cost because that to me is a dead cost. It's a sunk cost. So I know I'm going to go in there expecting to lose that money. So I do factor that into my risk because I know that's that's money is probably just going to be gone.
Okay.
Yeah, thank you. Yeah, of course. Great question. Tom, any other questions while we're here, team?
I have a question about looking for that bear shot pattern pre market on finviz. Do you look at the screener and is there a button that you can look for pre market gap ups after a strong bearish candle?
Oh yeah, you can. Let's pull up finviz. I'll show you how to do that. All right, so the only, the only Downside is Finviz isn't. So like for example, right now, if I go to go to all and I go to. I always forget where this is. Gap, gap, gap, gap.
Gaps on the left about half. All the way to the left.
Yep. Perfect. Thank you. So if you go gap up 3% or more. So for example, these are all stocks that gaps. Let me just clear all the bad ones for a second. Let me do average volume over 500,000. Just get some of these off the list. Okay. So you're down to 97 pretty quickly. I don't think these are gaps are happening right now. Let's go look. Adapt.
Yeah.
So these are gaps that are not necessarily occurring at this exact moment in time. But I've already occurred. But anyway, there. There are a few different gap screeners. But if you do change from open down, right. And then you have a gap up, that'll kind of automatically tell you that the stock gapped and the this, the candle is still bearish. So that's what this scan will do. If you add average volume. So change from open down gap up 3% or you just do a gap up at all, it gives you a lot more. And then you can change from. You can change the candlestick to something bearish if you want to also. So let's say long upper shadow, inverted hammer. So let's do long upper shadow gap up change from open down. Average volume over 500, 000. We got 21 tickers and I knew square was one of them because this is one we're going to talk about today actually. And you kind of can go through this. Yep, Affirm. So afrm. This is the one that I'm actually in on a swing trade. Bearish. But I'm watching it really closely, Eric, because it wasn't a bear shot pattern here, but it was right here. So these two days is actually a bear shot. Two bear candles, second bear candle opening above the prior bear candles close right there. So again, that strategy to me says we should keep going down, right. Because it's a decent bear pattern. But if we go above the high, it's going to be a little tumultuous. So I'm giving it another day, maybe two, and I'll be actually lowering my stop loss because I'm in a bear trade on this. This is what that trade looks like right now. So I'm gonna give this just one or two more days. I'll end up putting my stop below the low. Oh, sorry. Above the high of those candles. Just so I don't lose on the trade and then kind of see what's happened now. Finviz is not the greatest gap scanner in the world. There are a few other good ones that can happen pre market and that is bar chart, stock twitch. Give me one second. This is bar chart was just a margin calculator. Okay. I guess I'm the saving template. So bar chart.com. And you go to stocks. I'll post this in our WhatsApp group. You can do gap up, gap down. And this is pre market gapping all of these. Okay. Yeah. So all of these are gaps actually before market open ultra. Well popping over here. Okay. Yeah. So all these are are gaps pre market.
Because there's a pretty high probability if it was a strong bear day yesterday the previous session and it's gapping up above the open of that. Right. Then there's a probability of the shorts are going to have to get out at open.
Correct? Correct. Yep. So yeah, I mean essentially just, just go look for good gap ups with this particular screener and then make and see what kind of the prior day was bears. So the. These are going to update right now. This is Friday's gaps. This should update around about 30 to 35 minutes. This will, these will update to the new gap ups for the day.
Thank you.
These are our prize gaps. Yeah, you're welcome man. Sure thing. Sure thing. So again, yeah, we can use, you can definitely use some finviz for sure. You can use bar charts. There's, there's a, there's a few others. Here's BlackRock Blk. I mean this is one of the larger financial institutions in the world. Right. Blackrock is. And you got this perfect little hammer right here. You had a nice little gap down there. Good close above the gap down retest. Here's. I'm pretty sure this is an all time high. I don't know. Oh, it's actually not. Almost. Almost an all time high. Yeah. Blackrock. I mean this, this is a stock that's going to go higher over time. Right. Duh. I'm not in it camping everything but here's your first bear above the 10 EMA. We review that strategy right there and then here's another one. This is the second one. But if we pulled back, you're looking for a dip buy on BlackRock795. That's the high of those Barrick candles. That would be really nice. Again, that's what, that's what's cool. It's like any screener. The opportunities that you probably have all Found they're, they're endless. They're not going away. We will always have more trade opportunities than we're going to have money. So it's just about find the ones that you like. Maybe it's a company that you know, maybe it's a company that you've heard about. Maybe it's one making headlines. Maybe your, your mom's talked about it, parents, whatever. There's all kinds of things that it could be. Now we, we've seen this also continue our, our knowledge of the technical, the technical chart. But you can obviously have the down volume as well, Tom. And anytime you get big volume bars like this, I'm going to use that volume price for a while as just kind of a really important level. You know, up or down doesn't matter. But this was a beautiful, beautiful gap on Etsy that eventually faded and filled and just trapped all those bulls. I mean we can see what a, what a glorious sell off that was too like team. This is a very, very profitable trade. I didn't, I didn't take this trade. This is one I just found kind of doing some research. But I mean you got a lot of really fun factors here, right? Potential triangle channel looking thing, triangle pattern, really, really good close of all that volume. We act as a resistance support. Resistance support. It ultimately breaks down. Even if you were to draw a support level, oh I don't know, kind of like right here, you know, and you drew a level, you drew a level there off of that support, right? And just your one last ditch effort that broke down. So that's, that's one of those just using, you can use bull volume traps or bare volume traps. And I know that we've all seen these in the past. And so this is going to be a, a decently easy review just because this is something I talk about naturally. It's just hard for me not to when you see all the volume that gets trapped on a position up or down. But it can really help you make good trading decisions and some good profits and have your, your entries be really just spot on for sure. Okay. And so Friday afternoon we're gonna go and just talk about the pre market and you know, really analyzing pre markets, kind of studying the pre market for any of our trades. There were two really, really interesting gaps that I'd like to look at just so we can kind of have a general idea of what's going to happen and really blend all the analysis that we've really understood from all month into the analysis of these stocks. So I'm gonna have Jeremy the bearded Jerem walk me through square AKA block based on earnings. I'll have you share your screen with me. Jeremy, if you can walk walk me through square. What's your. What's your strategy? What's your analysis? What's your opinion? What's your thoughts? The why, the where, the when, the how. Give me all the breakdown. Give me the walkthrough. Let's go make a bunch of money on square. Let's go. Time travel, bearded jam.
All.
This one.
Nice.
What a gap.
What a gap, huh?
Just moving things around here.
Go away.
Zoom bar.
No one likes you. Zoom bar.
Okay.
Is this.
And do not. Let me see. Is that. No it's not.
Okay.
So it's kind of sideways on the weekly and I'm gonna do that. There's like sort of a resistance right there which maybe on the daily. Okay, we're like approach. Big bare volume again. So a bunch of compression in here and then gap up on earnings even though earnings didn't. I guess it's not terrible. Pre market it's not really moving much.
So.
If we close above that that's really going to squeeze these bears. And we're also breaking this high and Oops. And this high over here.
Yep.
Kind of breaking out of like this channel. It's sort of in.
Yep.
We're above the 100, 200 on the daily. Also now above the 100 on the weekly, which is good. Let me throw that on there.
I could do.
The monthly. Nothing yet. Oh, actually there's a little.
Oh you found a little. Oh wow.
It bounced off the hundred on the.
Yep. I was hoping you would find that Easter egg. That's. That's why I sent it to you.
That's.
It was so fun for me to see that.
Look at that. I've never seen that.
Isn't that nifty? So go into a five minute chart so that you can be blown away for the rest of your life.
Oh boy. I think this is the monthly one, right? No, that's my support resistance. Is this the monthly one? That's the weekly. What am I looking?
Well, you might have drawn it a little. Maybe a little high or at least, at least on my chart the 100 is on the monthly. Yeah, the 100 monthly was exactly.
Oh yeah.
8272.
Oh it didn't save. That's why I'll just reuse this day.
Yeah. Dude.
What?
I didn't take that day trade on Friday. I was. I was getting ready to do some stuff. Man. That Was the coolest thing I've seen in a long time.
Look at that.
Can you imagine being Joe and shorting right there? Because that's. I'm sure that's what she was getting the hand surgery or she would have done it. But that was just so cool. Again, talk about multiple time frame pieces. Because why did you think that based on the daily chart, Jeremy, that it would have or could have sold off a little bit.
On the daily. I had no. I was looking at it, I was like, that's weird. Why did it gap? And then it sold hard, like seemingly on nothing. And it makes sense now because it. The 100 on the monthly. Because I was like, they're really. That's why I drew that other line there with, with, with these, like. Because that was like the only resistance I was seeing above. I guess that kind of coincides with the 100 on the monthly as well.
Yeah, yeah, yep, exactly. And. And you also had the, you know, some bull candles. Right? You had some bull candle. Bull candles gapping up. This was 18% up at some point during the day. And it was a very, very high likelihood of a strong, strong earnings gap. Because square gaps a lot on earnings. You know, very, very frequently. Square has some pretty, pretty big earnings gaps, especially recently. And we've been trading sideways all year, like really, really compressing. So there was a strong likelihood of a big move coming on square. And so that was again great for if you're, if you're doing any type of earnings review. Like that was the likelihood of it doing a big move was pretty big because you're above the long term moving average on the daily chart. Like you said, the weekly is kind of right there and just sprung. It was either going to be a big gap up or down. And so it just kind of went with up. But then. Yeah, trade right into the 100 on the monthly. Perfect resistance intraday. Really, really fun sell off. And you have that retest gap. Right. Bunch of buyers from the previous day that they were profitable so they had to sell. Yep. So what should we do here, man? Well, from going forward, let's say three weeks from now. What should our plan be three weeks from now? Well.
Probably because I also, I'm seeing gaps here. What? That's text.
Wait.
Here and here. And also we have this. So we're gonna have to battle the 100 on the monthly. I think I said we have the. Yeah, we have the weekly under us. I feel like it might pull back to try and fill this gap and we might get a bounce off the weekly and then come up and hit the resistance and maybe break through.
Yep.
I like doesn't do that. I mean there's a lot of support down here so it would really have to. If it was going to go bearish it would really have to like break the 100 on the weekly break the 100 on the monthly break. All, all this support and then the 1 and 200 on the daily. But I feel like the bullish move maybe pulling back to fill the gap at least somewhat potentially bouncing off the 100 on the weekly then eventually, you know, breaking through the 100 on the monthly is probably more likely.
Yeah.
So walk me then through. Last but not least, the pre market action today. Based on Friday's candle, what would your day trading plan be?
Oh my God, look at all my lines. So. Kind of sideways on the pre market.
And.
Look at that. I would probably. This would be one where I would like. I probably wouldn't trade the open because there isn't any clear like pre market is just sideways. It's like and like sort of like a channel. I don't see like any clear trend unless like we sort of continue from yesterday. So maybe it will start pulling down but maybe just be patient and wait for like a solid 10 may play and like you know a good direction in the trend because we got. I'm not going to go bullish unless it closes above the 100 that's for sure. So probably more biased towards a bearish move and just wait for like the right setup.
Gotcha. So look, go back to the daily chart for me really quick. I love that perspective. What's your thoughts on this potential pre market open right here below low that candle.
That's.
We got a lot of room to fill. Lot of gap to fill over there. Jerems.
That's true. Again like still bearish perspective I think.
And is this candle bullish or bearish? Also bearish. Yeah. Yep. So I think, I think you're absolutely right, man. The pre market is pretty flat and my thought would be that if we, if we take out the pre market right. We get a nice little drop. This is the exact opposite of a hammer. And I would love to share everyone with you guys a nice, nice nifty little trick. You ready? Does everyone want a nice little trick? All right, here goes. So Jeremy, go into the ticker for me and type a one square. So one the the question mark. Sign the. The the thing next to the question mark. Hold on.
Next to the question mark.
Yeah, I'm being dumb. Click on this, type one and that little slash that's in the question mark.
Gotcha. Sq?
You guys ready for greatness? All right, Click Enter. What this does is it inverts the chart just in case you have a bias.
Wait, what?
Helps you see things a little differently sometimes.
Wow.
Put a math formula for you there, my dude. That change anything or.
Yeah, yeah, it. It does. I guess. I'm not a super bear. I would play that bullish all day long.
Like.
Wow.
That totally. Wow. Okay.
Isn't that fun?
Definitely.
Yeah. So it's sometimes just good just to shift because again, if we're never bearish, which is fine, it's not a big deal.
But.
Make money as we go up, make money as we go down. Both are, both are available for us. So sometimes it's good because I, my, my, my challenge you, Jeremy, is to short square today on a day trade. Real money, fake money up to you, but share the chart with us if you get a chance to day trade today. It's not all good, but. Exactly. I knew, I knew you would go long on that as if it was a hammer candle all day. And so since it's the exact opposite candle at a really nice resistance, that's going to be a fun day trade opportunity.
Now that, that is a very nifty trick.
Nifty, nifty. It's my worth.
Is there an indication where, you know, I. You said sometimes you get in right away in the first few minutes or some. Side. What type of indication is there? Because like, yeah, stuff sometimes just rips and sometimes it just messes around.
Yeah, for me, man, it's, it's really. I generally don't get in aggressively super, super early on most things, but the answer to your question is a small, perfectly placed gap. That's a great gap and go is a very, very high likelihood for me to get into a trade. Very, very quick, quickly. Just a really, really nice, high quality, beautiful open where you're like, wow, this thing is going to run. It's not like every. Everyone is either trapped or losing money or it's just really, really nicely placed. I'm trying to remember the very, the most recent trade that I played extremely aggressively. I don't have one off the top of my memory because it's been a while, but it really is just a, just a trade that just small little think. Usually it's like 3 to 5% somewhere in that range and it's a gap and go. Do you have one Joe that you played recently? Really aggressive.
I'm trying to think. Sorry.
Well, Nancy caught one on Tesla the other day. She caught that. She caught a pre market bottom to like the penny.
That was one of the first times I've ever done something like that.
It was so cool too. It was so cool. But yeah, we'll study pre market a lot more on tomorrow, Eric. Or Friday. Sorry, Friday. And I think that that'll. They'll answer some of your question. But long story short, I generally wait. I usually wait around seven minutes. I find that a lot. I. I'm waiting about seven minutes before I take a trade. Getting in super, super, super, super quick is. Is pretty rare. Yeah, I'm. I'm wait. I'm waiting at least three minutes. 99.9999% of the time. Jason says good look to short square to 20 EMA on the monthly. I agree. Yeah, s. Go square will be pretty. Pretty fun. Okay, let's see. There's another gap that I want some research and some work done on. Let's go, Sue. And review for me. Ms. Sue. Paulo. Alto ticker symbol P A N W.
Can you see my screen yet?
Yes, ma'. Am.
Okay. Palo alto. P a n w. You're definitely bullish on the monthly. Yeah, get a big bullish candle here. Coincides right with that line right there. 10ama on the monthly. Same line there.
Now, no pressure, but the reason I'm asking you is because you helped us make a bunch of money on Nvidia. So I just want to. I want. I want that money again. So.
Yeah, me too. Okay. Well, all the EMAs are way underneath us, so they're supporting us. That's pretty high stock there. That's not what I meant to do. I don't know why that line is there. We're s. Curving. I mean, like so plainly. Just classic. Looks to me like we're going to keep going up, but we're resting here. That's on the weekly. All right, now we got a big gap down on the daily. Right after earnings coming off of the 200. 268 up to 297 before we hit the 100 at. I'm bullish here for sure. This is today. It's Friday. Let me look at the pre market.
So it doesn't like. It doesn't look like you have a line on your pre market. Do you want one?
Yeah.
Right click for me. Go to settings and scales and lines.
I hit canvas.
Scroll down and there should be pre and post market. Click where it says yep, value and then do value and click line. There you go.
Click okay.
But I want both of them on there. Value and line.
Yep.
Okay.
And then go, go back to the daily chart really quick. And so this is kind of nifty. It's my word of the day. And you'll, you'll be able to see now where we're actually opening pre market. So this is a, this is a cool opportunity because again, it has, has a nice little open above the high of yesterday. Again, you do have a lot of bearish trap. This is a volume trap on Palo Alto, as we can tell.
Yeah.
And fundamentally a good company. And again, just like you said, Nancy, it's up, it's going bullish. Like it's, it's a good pullback. This is going to be a fun one to watch, I feel like, for sure.
So that line is there, which I drew on the monthly. So that's a really strong line there. And it's bouncing off of the 200 here on the daily.
Yep.
And yeah, we're here even on the 50 on extended hours. We got all the way up to 305 before we hit another resistance here. Lots of room to make some money. Bullish.
All right, well, I'm glad. Bullish. I'm pretty bullish too. So, yeah, I'm glad that we're thinking. Thinking the same thing.
What else should I see on here, Jeremy?
Honestly, you nailed it. I mean, you, you mentioned the 200 bounce off the, on the daily chart. The. That's, that's what I was kind of keeping an eye on. And, and the volume trap. Right. We got to close above. So you saw all the things I was hoping you would see and all.
This gap here, so.
Exactly. Yeah, it'll be, it'll be some opportunity for the future. Right. I mean, there's, there's all kind of strategies we can use to take advantage of that movement. And even if it's just one that we watch on the list, I mean, it's a big, big, big company and, you know, pretty, pretty large. Large and in charge. So this, this movement down, I think just represents a good upside opportunity for us.
Another tech company too, so.
Yep, yep, exactly. All right, sweet.
Well, thank you, Jeremy, on that one. Do you look down there at that really big Support around the 234 range and say if it comes down, that's.
Where I'd buy down to here.
Yeah, that'd be, that'd be a strong pyramid level for sure. I would agree. So if you're, if we're either A, pyramiding into this one, B, selling puts C, buying On down days, this, this general range right here is going to be, going to be a nice spot. And again based on the, the close and the volume trap here because again guys, my goal is to teach you something and then go make money with it. Right. So we got a really good gap and close above there. So I think there's a pretty good chance this runs this week. Even, even just into 300, which there's a moving average there. The, the blue one on, on her screen and that's the 100. So it's like just going from the 200 to the 100 I think is a pretty good possibility. And that's know 10, $11 a share. I think that's relatively high likelihood day trading or doing a swing trade. So just certainly something to keep an eye on. Yeah. Great question, Ms. Stancy. Joe, what's your, what's your target? You want to share your screen, Joe, and walk us through Carvana and tell us what you're thinking because I know you're in that.
Give it a try. All right. Where's the share? All right, is that working?
Yep.
Okay. Well right now I did sell a call on Friday. My phone was working in the hospital, so managed to do that, get that done. So I sold 75 call. So just I'm gonna see what happened over the next bit. I believe it was a March one. March regular.
Yeah.
So right now it did come right back down. So at this point it looks like it's going to expire worthless, but we'll see what happens. I'll probably check what the price is on that potentially close it out and take the premium and then watch it from there. I think it could pull back down potentially to this support level a little bit, but seems to have some strength. Test the 50 monthly and see what happens from there.
Ah, sweet. Okay.
But if it, if it, if it breaks below this high volume, then it will definitely be coming down. But that was a pretty good run. So.
Yeah, it really was. So how, how do you determine if you're going to buy an option back? Where are your rules?
I buy on a, on an update, usually towards the end of the day, see what happens. So. Or if it, it does pop up high into some resistance, then I'll do it at that point. So if I'm able to, you know, get the capture back here, it pops back up here, I'll probably sell one again.
Gotcha. But so you're still in it right now though.
Yeah.
Understand. Okay, got it, got it, got it. So you got what you sold the 75 regular March call against your shares you brought in. Do you remember how much?
$7.
$7. Nice. Yeah, nice. Super cool. Okay. I love it.
Yeah, I know. My cost basis I think is like 49. So not bad profit for a fifty dollar stock at the time.
Oh, yep, exactly. That'll be really nice. I love it. Love, love it. Okay, wonderful.
What do you want question on that?
Yes, ma'.
Am.
When, Joe? When you said a regular March call, what does that mean?
That's like just the, when the monthly options expire. So like the third week of the month.
Okay. That's the regular Friday.
Yeah.
Okay.
All right.
I don't know all that lingo, so no worries.
Yeah, good question. Great question. Okay, sweet. Who else has something they want to review? Eric, let's go look at your Q's. Trade qqq. Walk us through your plan or your thoughts or what you're looking to do.
My covered call worked and I. My shares were sold with and I collected the premium and a small profit on my shares. And now I'm looking for something else that is close to the 100. The I don't want to get in. I would rather get in. The Q seem really high to me and I'm always concerned about that 10 pullback. So I don't want to buy a hundred shares or more of the Q's at all time high. So I've been scouring, looking for another opportunity to get in a good quality, quality stock that is under the 100 or 200. And I think I found it this morning. It is called Palo Alto.
Yeah.
So I, I'm looking to maybe buy a hundred shares of that and then just hang on to that and do the options thing with that company long term.
So. Love it, love it, love it. Beautiful. Well, looks like you found it. Right? Buy low, sell high. Right, big guy?
Yeah, I think the, yeah, the cues that they don't just look.
You're just not buying at a discount.
Yeah. It's not a discount. And just wait till they come down and bounce off of the 100, 200 on the daily or you know, better yet the weekly if they ever get that low again.
Yeah, yeah, true that. Never so. And we sold it. And you sold a put on that one too, didn't you, Eric?
Did I? I think I saw the put on. I know I'd sold the put on Palo Alto. I'd have to open my broker. I don't think I sold. I did sell a put on Palo Alto, but I don't remember doing one on the queues. Did I do one?
No, they didn't do on the queues. But you did one on the. On Palo Alto. Yeah, yeah, yeah.
That one was awesome.
Love it.
And I. It was like a one day deal. I did it one day and then next day I closed out for a big profit.
Sweet, sweet, sweet, sweet. Okay, beautiful. Anything else that you want to review? Anything else that you're in or you want to look at my guy? No. All right.
I am in lunar, but I don't know what's going to happen with that.
Yeah, that's going to be bouncing around all over the place for a little bit for sure. Okay, cool. Sweet, sweet, sweet. So, Jason Chase. Jason says he's in on shop at the 20 EMA on a weekly. Jason, I want to share your screen. Walk us through your Shopify analysis set up and thought process. Hey Jeremy, while he's loading up his screen, I just want to say something to Eric. Hey, just know that they have earnings today. Trading View is wrong. Trading View says Wednesday, but the earnings are actually today. They have not specified the times for the earnings or the press release on that. So just know that you're going to see some volatility today when those numbers finally come out. Okay, cool.
Thank you.
Thanks, Brian. I think you're. You're muted. Jace, he's in your truck. Okay, gotcha.
He says he's in his truck. Yeah.
Got driving to a business deal. I like it. I like it. Jeff. What about you, Champion? What are you looking at, man?
I am.
I'm out of most of my swing trades right now. My. Most of the stocks I'm in right now are longer holds. Like I'm in AMD Amazon. I. I do have 40 positions in Q, but I was buying on down days. I'm in Google Spy vu like just safer stocks right now. I haven't really been too risky lately.
That's okay. I like it though.
I have a lot of other business moves going on besides this. I haven't been putting as much time into the day trading as I probably should, honestly. So I've been trying to grow other things that is.
Okay, man. That's. That's the beautiful part about swing trading, right?
Yeah, I mean, definitely interests me especially to, you know, trade up to that 100 SMA. So I'm looking into that.
Cool. All right, awesome. What about you, Scott? Same thing or are you playing you anything specifically interesting and cool.
I'm still in the basic stuff. I was doing some back trading over the weekend. I found the company called CCJ it's a uranium company. Energy.
Oh yeah. Yep.
It looks like it's going to continue dropping down to the 200. So I have wanted to place a swing trade on it today.
Ccj. Yeah, interesting find. Let me pull that up. Yeah, here it, here's the daily chart. Why do you think it's going to keep going down the 200? I agree with you but what was your analysis that got you there?
So like I said, I was back trading over the weekend for a couple hours on this one and I have a lot of resistant lines drawn on big bold days, bearish days and just with the trends that I've seen that have been going on. And then I read the news on it and it just seems like it's going to continue down. And then all the other moving averages are way below. So it looks like it's heading back down to those averages again. And then kind of on the daily, it's just set up again for another attendee. MA setup, so to speak.
It just broke that.
So it's kind of more compression like verifying that it's going to continue to drop.
Yeah. Yep, Good call. I like that. Yeah, down 200. I mean it's been on a beautiful run. Look at this man. From 23 to 50. You said this is, this is uranium.
Yeah.
Love it.
They do other mining too and everything like that. So bye.
Awesome. Okay, I'll keep an eye on that one for you. My man CCJ will watch it. But yeah, 3814. Good little spot to buy the dip. I was at 50 recently, so starting to get in some there on a, on a pullback. Makes tons and tons of sense. Thank you, rockstar. All right, Ms. Nancy, what about you Legend?
Well, I didn't know if we could look at Redfin. That question I asked over the weekend because it has dropped so much from its high. Is it just a dead stock that we shouldn't even worry about?
Yeah, great question. I mean my, here's my, my initial thoughts are yes, unless or until we get above the 100 on the weekly because Zillow, which I wouldn't call it a direct competitor to Redfin, but it's, it's going to be semi competitor at least. I'm keeping a close eye on a lot of the real estate positions because if real estate is going to be picking up because of interest rates going down, that should be a really good sign. So any real estate company or like industry or sector that isn't moving nicely with that new news and with that information's probably not going to make it or they're just not going to do really well. Some example might be Compass. So Compass, I mean you're getting the best news that you could get with real estate and you're getting some awesome like sales and a lot of numbers. This one's still not doing good, so they still haven't hung out. So Compass, Redfin I've definitely been concerned with, but Zillow, we can see Zillow's done well. They've recaptured the hundred. They have moved higher. So this one just in general having more strength than those two and then you have expi realty. And so this one also, as you can kind of see, they had one little spike and then since then, just can't really hold up.
Tom.
Now, granted we are about to come into a strong support and so if you're picking some up, this would probably be like, you know, an absolute zero play or maybe just buying some small size on down days just to see if it bounces. But I do, I agree with you. I think Redfin is probably eating its last strong, bullish meal for a while and then earnings, earnings, the only thing it's going to do to save it. So it, it has to open above 926 on earnings to do anything great. And if that doesn't happen, it's just going to slowly meander down, I think.
All right, thank you.
Of course. And you had one other one, right? You had.
Was that Nanox, Was that though?
What's your thoughts on this, this thing? N O X.
Well, the fact that we came back above the 200 coming down, I mean, I would think that the 100 will be a nice place to buy, but earnings are like just in a day or so or is that the one that. It may have been one that. Yeah, just a couple days between the other one. But.
So you're keep an eye on it. See. Yeah, no, this makes sense. You're right. I mean if we go look at the weekly, right. We just started battling the hundred. So if we can start taking out last week's high, especially if it's on earnings or if it gets back down there, I mean this last little push was really pretty right in here and then this little level right there would be super, super cool if we popped above. Yeah, really nice hammer. Really nice hammer on the 20th. That's something magical. Yeah, sure. Absolutely. Let's keep that on the watch list for a good earnings gap just in case something fun happens with it. Okay.
So just watch it until after earnings and then Yep. See if there's an opportunity after that.
Yes, ma'.
Am.
All right.
Yeah, because that's, you know, was on the screener there for shorts and it was like, not every short is a good short, right?
Precisely. Yeah. But that's why it's gonna be very interesting if we do get a gap up on earnings and we take out that hammer and we get back above the 200, we take out that weekly bear candle. That could be a fun move. So, yeah, I think it's a really good find. Very, very nice. Okay. N o X nano X imaging. And then our girl Joe did some homework, so we got Mara. So, yeah, earnings is close on Mara. And Nancy, you're in this one, too. What do you got going on with. With Marathon Digital? Did you sell another covered call? Get into the caller, time it perfectly.
I haven't sold it yet because I was waiting for a move up to get a better premium.
Might begin that today. Good. Yeah, that'll be good.
Because when I'm gone, it can just either sell or it can still make money when I get, you know, stock.
So.
Yep. Yeah, this is gonna be a fun channel too, family. If we, if we really play this out as a channel, I mean, like, let's just hypothetically plan for that. Right. We get a little bit of some bull candles here. We got some gaps that need to get filled down there. We know crypto is high, so Coinbase, Ethereum, all the others, they're. They're relatively on the upper side of the echelon of the movement. And so these crypto stocks like Marathon Digital, they're going to follow the, the crypto space pretty well. So if we end up trading back down and get down into here, that could be a really, really fun long because that is a substantial channel as we're talking like 100% returns from 16 to 32. So that could be really nifty on Marathon if we get back down there. Plus you have the 100 on the, on the weekly down there or sorry, 200 on the weekly, 100 on the monthly around 16. So that would be, that would be a gift if we get back down there, Joe. So good. Fine. Thanks for posting that because you're absolutely right. Earnings right around the corner. You got a 10 EMA play here. You got a lot of shorts that are pushing this one down. So if it drops and we get a chance to buy it low, excellent. And then we'll, we'll see what happens on earnings. That's why I love earnings season. That's why I Think it's so important for us to just really practice these gaps and really just do the, do the work that we discussed last week on any individual stock like who is most excited, who's the most damaged, who's losing the most, who's the happiest, where would be the. Where would be a very interesting gap and then just kind of plan for it. And again it might not happen, but it happened really nicely when we did all that work on Carvana. And I think that allowed us to just kind of plan really well what we needed to do for our, for our collar that a lot of us ran.
Jeff, do you know of a good site that look at companies financials more? Because this, this site is not accurate at all. Like it's still like into quarter.
Four.
Or three of even 23 on most of them. If you click more information. Do you know of a good site that's like more up to date with the reportings on earnings of companies?
Probably the, the only one that I would think would be hopefully the most up to date would be that company's website under Invest relation like Google Ear, Google Finance, Yahoo Finance, things like that and, and Earn and Trading View is probably going to be a little bit behind. But remember they're all the earnings that people are reporting, they are always going to report last quarter, you know, so that's like right now. Yeah, anyone that reports now, they're going to report Q4. They won't really be reporting a lot of what they did, what they're doing right now.
All right, so. So there's no web, so there's no website just to kind of scan through to see who has positive negative earnings and just go through and say hey, this looks like a company. You have to go to the site individually basically because it's a good way to kind of know like if they had really bad earnings the month before, you know, you can kind of like look and see where they kind of are to date. Do some research, kind of determine the gap based off of how healthy a company is in reality. You know what I mean?
Yeah, totally. That makes sense. Does anyone know of one? I mean I know you have earnings Whisper but. But I haven't used it for that reason. I don't know if it's. If they do that exceptionally well. Something like might have to build that company. Jeff, let's do it.
Let's all put money into it and become billionaires.
Perfect. I'm down for that. I like billionaires. I will. I do have a company that would like to Share with all of you. That is going to be worth the price to admission for ultra wealth. Saying all that to say I've only been using it for a week so I don't know if you guys are ready for this though. Everyone sitting down? Okay, Hope everyone's sitting down.
Sitting down.
We got an AI company that will show you who is buying and selling on really, really big name people AKA Nancy Pelosi, Congress and senators. Now obviously I totally disagree that they should be allowed to do this but you can see what stocks they're buying and you can do some research based on that too. So this is called quiverquant.com so quiver quantitative quiverquant.com I'll post in the chat pane, I'll post in our WhatsApp group, do a little bit of research on it because I think that that's, you know, again it's just relatively interesting or slightly unique. So it's valuable to have to some capacity. But check this out. If you go to strategies again I haven't, I haven't paid for this yet. But you have U.S. house of Representatives long and short, 275% return. Oh it cracks me up. And you can go follow individual traders like you got Dan, you got Josh, Congress sells, you got an inverse Kramer in here, you got the Nancy Pelosi fund that's up 66%. She's just a better day trader than all of you guys by the way. So just, I'm just letting you know, maybe you can become a little bit better day traders. Top government contract receipts, you know they're up 1400%. So this could be a fun, a fun little avenue for all of you to just, I don't know, practice or look at. It's really, really cool and I think you're gonna get some value out of it. I've only been using it for a week so if anyone spends a lot of time, energy and effort and you find something awesome on it, you will have found it before I did. So I just want to let you all know that you're welcome to spend as much time on as you want. I'm still very new to it, but it is kind of nifty. So. All right. Anything else boys and girls, anything else you're looking at, you know there stocks you want to review any trade setups that you have questions on.
And Jeremy, there's one. It was sprout social when I was trying to do my homework and I didn't really find a really good one.
But.
It'S got A really good bare volume bar. Let me see.
What was that ticker again?
Sprout spt. I've never heard of the company. Technology services.
Oh yeah, it's pretty. Very nice.
I think the short float on it was. Trying to remember. 19% maybe.
Good. Fine. With that double bottom on the monthly Sue.
Yeah.
Okay. Super cool. Yeah, that this is a pretty one. Let's absolutely watch this cookie. For sure. I'll give that a day. See what it does today. I mean this is a bear candle above the 10 Friday as well.
Yeah.
So I might sprinkle in some risk at 66 and if it closes above 68, add to that position. Good. Fine. All right, I will. I will keep an eye on that one. Okay. How fun is it to to have all these tools in your toolbox, Miss Sue?
I love it.
Isn't it fun? Yeah, super fun. Okay, well, family, if you have anything else for me, obviously just let me know. If you're taking day trades, swing trades, long term investing, put sales, covered calls, options, whatever, let me know. Always happy to help. Always here for every single one of you. And next month we will be talking about Elliot Wave and just more technical analysis, more charting, more understanding of just sentiment. We're just going to continue adding to what we know. And the best news is in April we going over options in depth and April's probably where you're all going to make the the most money you've ever made in your life with trading. So be prepared for that. And we're just gonna keep going at. It's gonna be a really fun time. I'm hoping that we get a little bit of a market pullback in March. That's why I'm saying April could be a really, really profitable year month for us because I would love some kind of pullback. We're really high. Well, we're really high on so many things. Even Nvidia. Right. Everything is just sky high. So just some slight pullbacks would be fantastic. And yeah, giving us access to trade any market at any time because we have all the tools that I have. That's the ultimate goal. It's just to make you all just very comfortable and confident and secure and knowledgeable and just know your system, know your plan, know how to scan, know how to look, build and then just boom, get ready to attack it and build wealth and add to your communities and give generously and be amazing humans. That's the goal. All right, family, thanks so much for hanging out with me. I appreciate you all. I'll be back Friday afternoon. And that's what our next session is. But again, any trades between now and Friday, please let me know. Happy to review. Any of them for you. Day trade, swing trades? Doesn't matter. Post in in the WhatsApp chat. Always here for you, fam. You're the best. Enjoy your day. Bye.
Thanks.
Bye.