Feb 8th, 2024 Ultra Wealth = The bear and bull shat pattern
Instructor Jerremy Newsome leads an Ultra Wealth trading session (YouTube webinar) focused on advanced gap analysis and two daily candle gap patterns he calls the "bull shat" and "bear shat" patterns. He defines the bull-shat as two consecutive bullish daily candles where the second opens (and preferably closes) below the open of the prior bullish candle — a gap-down-and-reclaim pattern whose low, if later broken, signals a high-probability short. The bear-shat is the inverse: two consecutive bearish daily candles where the second opens and closes above the prior bear candle's open — a gap-up compression that, if the high is later taken out, signals a bullish entry (and if it fails, resumes the downtrend). The session applies these definitions to tickers (Google, Nvidia, Coinbase, Zillow, Spirit Airlines, MongoDB, Apple, Intel, Qualcomm, ELF, etc.), shows live scanning examples (FinViz), discusses entries/stop rules (stop-sell below second bull candle low for bull-shat; stop-buy above second bear candle high for bear-shat), and assigns homework to scan for these patterns.
Chapters
Okay, family, we are here and ready to rock. What's up, Sue?
Good morning.
You feeling on top of the world?
Yes. Nvidia gapping. Yeah.
All it does is just go up.
It's amazing car now.
Incredible, wild.
How far can it go? Did you say it's split before or no?
Oh yeah, I think it's had, I think it's had three splits in the last five years. So I mean seven hundreds, why not like that's how, that's days away. I don't know if anyone's in those call options or not, Tom, but they are looking pretty. If you got a chance to buy any, it was that what once it hit 600, that was the right. Buy some out of the money calls was the play or, or buy some stock with profit or whatever. But yeah, Nvidia, it's incredibly powerful. Very, very wild. It'll be fun to watch for sure.
This stock reminds me of that movie you had me watch. It's going to come crashing down and go out of business.
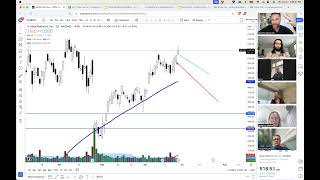
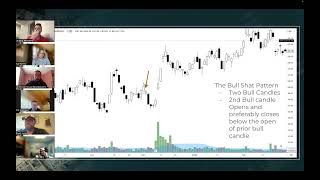
Enron. Yeah, it's, it's, it's possible. Enron was the hottest company in the world for a long time. Well, not, I mean made the hottest, but it was, it was strong. But so far, I mean, you know, you know, anything's possible. This is still pretty sustained. It's nothing too crazy. If, if we're gonna have any worries of meltdowns or Nvidia going zero, we're gonna have to go all the way back and get out, take out the 501st. So that'll be our sign. So until that happens, it's not gonna happen. All right, so we will definitely be reviewing broader markets today. Team reviewing some individual stocks and some individual charts and just reviewing some things that you all might be in, making sure you're comfortable, cool, happy, excited. P About the markets. We do have some slides because we are in officially month two and there's a very key word here, advanced gap analysis. Most of you have probably at some point studied my gaps, just in general stuff on YouTube, all the videos and your media course. I'm doing my best to give you additional gap insights. In this particular program, in this particular month, we're just going to focus on gaps. Gap. The gap gap. Gap gaps just really go through how you can capitalize on those for swing trades if you want, how you can capitalize them on day trades, how you can stay in really good winners and how you could exit losers based on the gaps and really kind of plan ahead of time your wealth to make sure that you're in beautiful, beautiful winners and strong movers and you know, you crush it. So that's what we're doing this month. And this week we're gonna be diving into two particular patterns, the bear and the bull. Shat pattern. Just a fun name. So that's why I decided to keep it. So we're going to go in depth analysis of today, specifically the be shat pattern because the markets are pretty bullish and it's actually a bullish pattern and that's what I've alluded to in the past. Eric, for you on Spirit Airlines, we're going to go look for some of this charts. We're going to talk about this analysis, we're going to talk about this sentiment because it is really, really unique and pretty interesting and it' actually kind of rare for it to happen. But the bear shot pattern is a strategy where three seconds. I should make sure I have this correct. Yes, bull B U L L for this week today bull. And we're going to work on bear. So the bull with the reason it's called a bull is because it's comprised of bull candles. So this one is, I have noticed a little bit more on the rare side. It doesn't actually happen as often as the bear pattern which we'll be covering in depth Thursday as well. But the bull pattern is quite interesting. This is if we think about it from a sentiment perspective. You have a bull day. The next day is also a bull candle. But for a perfect bullshit candle pattern, you're looking for the open and the close to be below the open of the first day. So the open and the close of the second bull candle is below the open of the first bull candle. So what this means if you think about it is like you have a trade, people take a trade. Just a normal day. The next day you have a gap down, as you might all remember, it's a gap and go right bull candle gapping down. So the bulls on that day are trapped and you're thinking yourself, oh no, Tom. People are scared, people are panicked, people a little bit worried. But the bulls come in and save the day and it closes bullish. And everyone gets to celebrate for a second. But we never really reclaimed the open of the prior day. We never really got past above that open. And so what it is is kind of like a crack in a dam, right? And you're just hitting it with a hammer. If the low of the bull candle gets taken out, it's a really, really, really powerful, very high probability. Quick trade. These aren't trades that you have to be in forever, you can be in and out of them pretty quickly. They don't trigger all that often either. But when you can analyze them, when you can set them up, when you can find them for two or three day swing trade, a day trade opportunity, or some type of option strategy, they can be very, very beneficial for you to know, see, find and understand. So the bullshit pattern, two bull candles, second bull candle opens and preferably closes below the open of the prior bull candle. That's really kind of essentially the definition of this pattern. Oh, yeah, you can scan for these for sure, dude. Yeah, definitely. You can scan for anything. That's what's cool. The challenge and the fun part with scans and the part that you might all probably found at this point is I scan a lot for patterns, but really I just kind of, I, I more or less just scan through stocks. I just look for volume and I just try to find really cool trade opportunities because at the end of the day, if you scan every single day for all the patterns that I like and love, double tops, double bottoms, bullshit, bear shot hammers, big volume, trapping volume, good gaps, you're gonna run out of money real quick, Real quick. Now, that doesn't mean that for a period of time you as traders can't specialize in something. So you're like, all right, this is all I'm going to do and this is all I'm do forever. That's fine. I do normally suggest picking a period of time where you can go, all right, this is all I'm going to do. I'm going to look for this pattern and only this pattern. I'm just going to trade this pattern. This is all I'm going to do for this period of time, three, four, five months, and just become a master at that pattern. That is fun. I do enjoy that a lot. And you can certainly do that. I do not look for this pattern in day trades because it usually doesn't show up because it requires a gap. This is a swing trade, bigger time frame, daily chart, candle pattern that once you see this on the daily chart, you can certainly zoom into a smaller time frame. But it means the most, really, and only the most to me on the daily chart. So, Jeremy. Yes, sir?
Would you wait if you had two, as you're saying two bowl candles would be in a row after a gap, how are you getting in on that? Are you getting in above the first bowl candle and once it hits a certain target point or if it's going bearish, you're Getting in below and then you're sitting up either a body limit or stop, whatever it is.
Yep, exactly. So the second candle shows the, the bears are strong overnight. The bulls gave one last push and so if the low, the second candle gets taken out, go. So this is a pattern that I'm looking to short.
Yeah. So you, you're going to scan for a gap the first day. Once you see that gap, you're going to mark it and then you're going to set a line where you think it should be if it gaps down and pre market and then you're going to set your, your buy from there.
Not quite so really for this particular day you're not even, you don't even know that this day right here exists. This is just a normal, nothing special, nothing stands out. This is the day that's interesting. If you're scanning for this candle you'd have to scan for down, down days that close, that close higher than open. And if you do that scan so a down day. So it's a red day right with a bull candle and then the prior day is a bull candle. Also depending on your scanning capabilities or whatever scanner you're using, that's really what you're going to scan for. But even if you just scan for down days, that's an update down days it closes higher than open. You'll be able to find some of these patterns and yeah, you're, you're doing a stop sell order below the low of the second bull candle and I'll have a few more examples for you as well and then we'll go look at some because yeah, it's a really cool pattern to find. This is this one was on Google and what's cool about this particular pattern, kind of like what Scott was saying earlier is we did get a breakdown but it wasn't until much later. This is just a fine me finding the pattern. But you'll notice right here that would have been the low of this two day candle pattern right here. And so again I would be looking to take it short. What's really, really interesting to note or keep in mind or be aware of is this pattern. This support should hold for a period of time. It's a really, really good support. The bulls have tried really aggressively to keep this price up. So if it doesn't stay higher it has a pretty strong probability of going down. Which means if you're shorting of the red line and you took the short, you made some money into here on a swing trade or again maybe you were Looking at a day trade, you're able to capture some type of profit. The second pattern that shows up, right, also a bullshit pattern, right? Bull candle gapping down into a bull candle. You'll notice that was the low of Google. Like, we didn't, we didn't really take out that low like that. That was it essentially. Like we, we have Stonewall Jackson based on that price, which is really good to know because again, you could have an alert or an entry or whatever says, all right, if we break this price, I'm going to short, but if we don't break that price, you will know. That's a strong support. What you think, Joe?
Very interesting. It's a good thing to watch for. Sure.
It is a cool thing to watch for. Yes, yes, yes, yes. Especially if you find these little puppies. Here was one that I'm seeing now. It's kind of hard to see on this exact chart because the dots. But there was, there was that pattern again, didn't take out the low. It's just, it's just one to watch for. That's really it. It's like if you find it, if you happen to find it, if you happen to scan for it, if it pops up on your radar, beautiful. Because again, the low should hold. So here's another pattern. The low should hold. So if you are doing credit spreads, right? Bull put spreads, put sales. If you have a stop loss in place, if you want the stock to go higher, if you expect the stocks to go higher, the low should hold. And if it doesn't, then you know something's up, then you can exit your positions, then you can buy puts, you can start unraveling day trade bearish. You have a pretty high degree of certainty to really watch for this particular pattern. This chart that we're looking at here is interesting for a couple of reasons, because if you just draw a low at that pattern, now you're starting to incorporate this gap that acted as a support. And that particular pattern itself, Jeff says, is FinViz, your favorite scanner. It's the one I use the most frequent. Yep. Yeah. Again, scanners aren't the, aren't the challenge. It's kind of like seeing, you know, do a scanner is like a restaurant. You know, they're everywhere. Once you find a good one, you're like, oh, cool. But yeah, Trading View has a scanner. Trend Spider has scanners. Every broker has a scanner. You can build your own scanner. There's, there's literally millions of scanners. So, yeah, what you were saying earlier, Scott, which I really like is you're saying, okay, again, back to the sentiment of this. Could you also have a bull perspective? And the answer is, sure. Kind of like the 10ema. Now you're starting to see how this all blends together. If you have these candle patterns. Normally these candle patterns are either a 10EMA setup that doesn't trigger or a failed 10EMA that starts to go higher, which again, just simply means you're going to have double confirmation if it breaks down. You have multiple 10 EMA candles that are really powerful, right? So you have the 10 EMA, multiple bull candles. Place a good trade. If it takes out the high of that 10 EMA candle, as we talked about recently, like this candle here. If this is a 10ema candle and it took out the high immediately, there's some bull day trade opportunities. It's just a really fun pattern. And the more you start seeing the patterns in whatever chart or whatever setup you want, then it becomes even easier to analyze everything and then to know how powerful a future move is, because you can go back in time, analyze the previous moves, even if you made money on the moves or not factor in those moves and apply it for the future. So a great example would be if I look at this move here, Joe says, is this kind of like a morning star reversal? And the answer is yes, absolutely right. Bull candle gaps down into a indecision candle, bull candle. And then you got that morning star reversal. So it is kind of like the start of a morning star. But let's. Let's go to here on Google. That candle right there. Nothing special. No pattern this exciting or significant. But what we can really see on this one is when this gap comes in there and it's opening above the high of the upper shadow, it's gapping above multiple days, really multiple weeks. And then you go back in and go, wait a minute, Google just pulled back into again now. Now we're reading the whole chart from left to right. Google had a really nice gap over here. A bunch of bears were trapped on this volume. You had a compression pattern, good gap. This gap held. Boom, boom, boom, boom, boom. You had a bullshit candle pattern here, nice morning star. We bounced off of it. It did not go lower. We came down, we gapped again. And then all of this gapping, we pulled back into old resistance, new support. How high of a probability bull entry does that make that setup? Right, Sue? Because now you're able to read the whole chart from left to right. And as you look at each candle and as you start to blend these, it tells a bigger story. And that's all the Ultra wealth program is designed to, is so that we continue to dive into this thing and we can dissect every day if we need to. And ultimately, as we're looking at things, we can build a stronger and stronger and stronger case for any particular trade so that we can either stay in trades longer or get into a better trade with better size and then hopefully hold that trade longer, because that's how you're going to make your money. Get into great trades and hold them again. Day trades are cool, but I think all of you here want to make.
Some money, so would you. So on that, that chat pattern, would you set a, a stop limit if it goes lower and then set a limit if it goes higher? Would you set both entries there if you see that type of pattern or not?
Yes. And they, but they're both stop entries. They both, yeah. So this would be a stop sell to short as it goes lower. And this would be a stop buy if it goes higher.
Now would you set that one because that's such a small wick, like to the middle of the gap.
Yeah. This is. If this was right here. So that was the support I would 100% and I did. I would have a stop sell order there below this candle and below this candle to short if it goes lower, which we can see it didn't, which is fine. And then as it starts to go higher and that level holds, this is the area where you're doing put sales, bull put spreads, or you're doing all kinds of option selling if you want to, and, or, you know, this level is an extremely strong support. So you're buying stock there, you're buying calls there, and you have a really, really good place to exit out if it goes lower. Great question, Jeff and Jeremy, you're not waiting for the candle to close below. Right. Even if it just wicks down, you're getting in immediately, right? Correct. Yep, correct. So if it goes below that candle, I'm in short, which we can see that it didn't. And that's okay. No big deal. That. But it's, it's a good pattern to find. So Brian says right now, real time, we have one on Zillow. So let's go look and see if he is correct. He is correct. It's not perfect. It's very, very close. But you had one the other day when I was like, hey, hold your, hold your short calls for a little bit longer. This close, closed above the open. So it's not a. Not a perfect pattern. It's. It's good. Which tells you if this breaks down and you wanted to get into some protection or buy some puts or sell some calls or short some shares or just do something that protects you lower. That's fine. This one is a nice morning star reversal, but not. Not the exact bullshit. This one, though, right here was right there. So you'll notice the second bull candle. Right, team? This guy right there opens and closes below the open of that bull candle. Right, Brian?
So you want the first one 100 be a bull candle. You don't care if it's a bear candle. You want it to.
It has to be bullish. That is correct. All right.
Okay.
Otherwise it's not the candle pattern. This one right here that you drew, which I really. I love. That's a very nice morning star reversal. Yeah, very nice morning star reversal. But that's just. That's not the overall pattern. Second candle has to be a bull too. Yes, Correct. Second candle has to be a bull. Yeah. Both of them have to be bull candles.
Yep.
For this particular pattern. So this one right here is. That's the perfect one right there on Zillow right there. And you can see when we took out that low, I mean, you're. You're able to make bear money in here for however long day trade, quick little swing trade, quick in and out. It's not like it went higher after it broke below there. It went lower for a period of time. And that doesn't look like a lot for you guys, but Brian will remember that trade pretty well. It was a lot, guys. It was a lot. Yeah. So, like, you had some short positions. Like you have some. Some capacity to make bear money in that move. That's fine. Again, selling stock short, buying puts, having your sold calls, whatever. And the one that you were looking at right now today on Zillow, would everyone agree that they're both bull candles? Just the second candle, which was Friday, we didn't close below the open. So it's not a perfect, textbook by definition bullshit candle pattern. It's just a cool, like, almost almost. And so that just says to me, if I was in this trade, if we. Tom, now, Brian, is not a just a wick pass. It would require close. If we close below the low of those two candles, essentially the low of Friday, then I would probably create some level of protection for myself if I was in the straight bullet just to have it. Right. A collar just depends on whatever position someone was in. But I would probably have some Level of protection. If we closed below those two candles. I say those two candles just specifically, since they're both bullish. If we close below the low of this guy and closed below the low of that guy. But I would need a close below that. All right, back to the drawing board. Practice a few more. So here's one on block specific, specifically on the left. Oops, sorry. Right here. So again, same type of thing where you can get. You see the bull candles gapping down. The second one's closing below the low. This one makes it very interesting for me, this guy right there. Because if you're able to see what's happening, I actually took this trade, and it was really, really fun, Tom, because I lost on the bear trade and got trapped and had to go bullish. So let me kind of explain what happened to me on 20. In 20, 20 on square. So this was a bullshit pattern, right? Bull candle two. The second one opened and closed below low. The first, I went short on the close of this candle and the open of that candle because it went below the low of the second bull candle, and it turned out to be. I don't even know what I would call that pattern, but technically, it's triple bear, a triple bullshit pattern. So you had two, three bull candles. The second two both opened and closed below the open of the prior candle. So I was short, heavy here, and I was like, sweet, it's going to go to zero. And it did not. The next day, we gapped up, and I got a doji. Now, what was cool about that doji is I was trapped. I was losing money. I was in this position. I expected it to go down because of that. Just because of the candle sentiment. And sure, you can say the trend or whatever else, but I was expecting it to go lower, Tom. But with that doji, it was very, very easy for me to go, all right, I'm going to place a stop loss here. If it goes higher, get me out of the bearish position. And if it goes lower, I'll stay in the gap. That happened overnight. You're also forming probably a teeny, tiny, itsy bitsy little double bottom here. Nice little doji again. I was able to try take the stop loss. I got stopped out of my bear position, Lost like three or four hours, I think, and then took a position long and. And was able to hold in. And then once this candle pattern came in, which was the bull candle gapping down, opening and closing, very, very close to the low and the open of the prior day, I took my stop Loss and put it right below that candle, which is a good takeaway because again, if that candle gets taken out, it should be a very, very strong selling event. And we can all see that it did not, which was nice. And it kind of continued higher. And then we get one of my other really fun favorites that I'm a big fan of, A pattern that I've really only been playing with for about a year and a half. It's not been ultra long. But this one is a bear shat pattern. So it's a bear because you have two bare candles. So these are some ones we're going to be practicing and looking for all week. These. These candle patterns, just, just to try to go find them. That's going to be. Our homework, is to look for them and study them. But the bear shots, exact opposite, where you get two bear candles, the second bear candle opens and closes above the close of the prior bear candle. And then you're going to go bullish if it goes above the high of that candle and if it goes down, it's going to resume the trend, just like the bull, except in reverse. So the two bears, you'll notice this bear candle and then the bear candle that had this gap up right there. The open and close of the second bear candle is above the open of the first one. I love this pattern, especially since I'm generally a bull trader anyway, because when it takes out the high of that candle, I'm absolutely watching this to go higher. Day trade, swing trade, whatever. This is the one that Eric played accidentally on Spirit Airlines. Again, we'll talk about that. Just a moment. Coinbase just had it two or three days ago, so there's some patterns out there that this is already happening. This one, to my experience, does happen a little bit more frequently than the bull shat pattern. But again, to just couple all of this with analysis, notice for a moment how strong once this candle, this support level comes in here and you could say to yourself, all right, we got a bear shot pattern. We have a really, really strong bull candle here. We have a gorgeous lower shadow here, we have a really, really pretty lower shadow there. They're all the exact same price. Once we take out that price point here, is there any reason not to be short? Yep, Scott's absolutely correct. There's no reason. And you'd have had a couple of days to really be able to see that. And the bear shat is kind of what started it. We didn't go higher, so that's not a bull signal. And then you got all of this compression, all the sideways movement, bang, bang, bang, bang. This is an extremely high probability short. And ironically enough, it also just happened to be Covid March 2020. So if you were shorting square there, you went from $78 a share to 48 a share in like two weeks. Which if you're shorting shares, you're making a bunch of money. If you're buying puts, you're making a bunch of money. That was. That was Gains Gain city. All right, here's another one. This was recent. These are. These are really, really cool patterns. I. I truly do enjoy both the bull and the bear shat patterns. They're super fun to find. Again, if the price action moves past the high of the second bear candle, a short squeeze should take effect, which we're going to talk about in the next couple of weeks, because a short squeeze is a gap type. It's a very, very fun thing to do. Very fun thing to find. And yes, you can scan for them. Yes, you can scan for all of them. And yes, you. You can scan for every pattern I'm gonna talk about for the rest of our class. And you will run out of money in a couple days because they're all there. What I like to do is find our stocks that we trade. And as I'm looking through my stocks, as I find one or two stocks that look interesting, I scan the last couple days or weeks for all these patterns that we've talked about, and we'll continue to talk about. And as I just keep stacking and stacking, right? Moving averages long term, daily, weekly, monthly bear shaft gaps. All the things. Blend, blend, blend, blend, blend. We find Nvidia or you find plug. My girl sue, man, just over there, crushing it. So it's a really, really cool pattern. And I like this one. This one's exceptional because it's specifically this candle. Because you'll notice you might think it's this candle and the green arrow. Who can tell me why? The green arrow candle isn't a bear shot pattern by this current definition. Let's go. Oh, sorry. Yep, There you go. Yeah. It did not close above. Precisely. It didn't close above the open. But that next candle does. Right. The next candle does close above. Right, that. So the. The one with a red arrow is a bear candle. Previous bear candle. It closes and opens above that. Prior bear candles open. So again, think about it from a sensor perspective. You have shorts, they pile in the market, make a bear day. It gaps up overnight for whatever reason. Hashtag Jim Cramer and the bears Sell it again. And they're like, all right, we got another cell. So we have two bear days. But they're losing traction. So it's almost like you can feel the price action slipping away from them because they really, really, really need it to press lower. And if it doesn't press lower and it just cracks, it's like a levy. Just boop. And then crush. Now, again, if you were here back in the day, and this was back in the day, this is like 2017. To continue on with some of the stuff that we've talked about so far. Big, big bear candle. Right, Right there. So you have a super strong resistance. You got the trend. It's doing its thing. It's whatever. We retest old resistance, new support, and you get this bear shot pattern. The overall trend is already bullish. Can't you just. You should be able to look at this chart and almost feel the pressure. Just ready to. And it did. And then you got another one over here. A couple back to back to back, right? Bear candles, where the second bear candles opening and closing above the prior bear close, which is literally the definition of higher highs and higher lows. And then it just beep. That levy cracks. Bang. Nothing stopping it. Strong pattern. Really, really love finding Scott. Hit me, my brother, where you have.
The arrow where it says bear shot, right? Now, that taller bearish candle, that's the one that kind of want the first of the three, would. Is that where you would put your entry, or would you be confident enough on that chat pattern that you would go above that candle?
Good question, bro. Ready for this? I would do both. I would do an R here, and then I would do an R here. I'm adding risk units at that point. Because you have multiple reasons, right? Just like. So if we go back to just A good old 10, Ema. The more bear candles you have above the 10, the more risk you can take. Right? So now you have probably. This is probably a perfect bear candle above the 10, and it's a bear shot. So it's like, all right, I'm gonna get in above the high. And then when you take out this bear candle, and what's stopping it? There's nothing to the left. Nothing at all. In fact, if you don't think that this looks like the Nvidia chart, I don't. I don't think you looked at charts at all this weekend. Right, Sue? The same chart, Right. The same type of pattern. And here's the best news, Eric. Best news ever. You're gonna be able to find a Pattern like this again in a month from now? Yep. What about a year from now? Yep. Five years from now? Yeah. Is it going to work almost every time? A certain percentage of the time. There you go, dude. Certain percent of the time is going to work, team. That's it. And it's like if it starts to work and you're like, all right, cool, I have all of these things. And so you, you get to go down the. Boom, boom, boom, boom, boom, boom, boom, boom, boom, boom, boom, boom, boom, boom, boom, boom, boom. You go down the whole list that we're building together and then we start compounding. Like, you could put some size into these things and that's how you make money. You're not going to make money with a hundred dollar risk. It's just not going to happen. But a hundred dollar risk is what you learn from, is what you study, is what you understand, is what you get. It gives you the, the building blocks and then once you get the building blocks and you know your risk, you know how all the trades work and you blend them all together and the patterns never go away and you're able to see them for the rest of your life. Yeah, it happens. Big, big, big, big shifts happen. Okay, so let's just go look at a few. And then again next week, we're just going to be, we're, we're studying these bad boys all week. Let's go look at Coinbase. Because even from a day trade, an option sale like this, this was a fun one. This was a really, really nice opportunity. And it still, it still kind of is. And doesn't, doesn't mean it's going to go away. This, this is why I think right now Coinbase is a pretty interesting spot, depending on all levels of your trading, like what you're trying to do here. This is a bear shat bear candle right there. Second bear candle opened and closed above the previous bear candles open. Also, it was a morning star reversal, so that was a little bit of a bonus. Also, the high of this candle and the high of this candle are identical within a couple pennies. So that added a very, very strong resistance right here, which gave you an incredibly good, very high probability, either day trade or swing trade, a few different things that you could be doing here. Right. Because now we're factoring in everything so far that we've learned. We got the 100 down here at 110. So we know at some point it's going to hit that. It's not even a question of if, it's just When? So if you are picking up some shares and you're selling some covered calls, you're picking up some shares and you're selling some puts because you want to own some more. You have a beautiful day trade opportunity here. I mean, today, AKA Friday, was an inside day. So if we get another strong pop, Tom, today or Tuesday, it's going to be moving again. So I can start creating orders and get ready for a good pop on Coinbase today or tomorrow. If I'm selling puts, which is a bullish strategy. Right. I'm selling puts around here because I. If I get share ownership down there, great. And if it continues to go sideways or higher, then I'll win on those too. A lot of things to do here. Back to Eric's trade. Now he's gonna be able to see it so clearly. Come over here to Eric's trade. And here you go, right? Bear candle followed by a second bear candle that opened and closed above the prior bear candles. Close and open. And what did it do the next day? And so again, you can see that it's not like it rips for 5,000 points, but is this pattern, gentlemen and ladies, the exact same thing that Coinbase just showed up? It's the same pattern. And then you got one little push and then you got the retest and then you got the sideways action. So, like, this is what Spirit Airlines is doing. This is probably what Coinbase is going to do. I'm just going to kind of chop around and trace hours and then you can wait for, scan for and have it on your watch list for a good pop up because there's not a lot of downside opportunity here because you're at $6. So the, the risk is to, the risk is to the upside for the Bears. So a good. Whatever. Let's say Thursday morning, Spirit Airlines is opening here at 750. You know, that's going to be a really good bullish day trade. Yeah, I don't know if it will or not, but that's going to be a great trade. So let's use all of this to go into and analyze Apple for a second because great, great job. For anyone who's doubling down on Apple or who did double down on Apple, I agree. As I mentioned, I thought Apple was going to gap up on earnings. I was wrong. Did not. However, I also stated that if Apple did gap down on earnings, that it would fade. And this is the fade. We're talking about those next week. The fade on Apple was real. This is not a bullshit pattern because yesterday's candle, which is Friday, did not close below the open. But it has similar characteristics, it has similar principles, kind of like this one. So my assumption is that we're going to get some good movement out of here on Apple. And I think all of you probably at this stage will know, see and understand where the line in the sand on Apple's going to be. Right. We can all have a pretty good idea. Apple's gonna hold 180 for a bit. If it doesn't.
Going down.
Yeah. And then that means you can, you can buy it lower. Doesn't mean you have to short it. It just means you can start creating your orders ahead of time. But these are all things that you're going to build your case for. And so Apple moves and does one of these things over the next two or three days. It gives you opportunities to buy some shares, sell some puts leg into some positions, wait, hold longer, set up some day trades. You start planning ahead of time using all the information that we've really all kind of uncovered together so far already. And I don't have any other current bullshit or bear shot patterns to analyze like present day. They look extremely exciting. Google was really nice though. That was just a really good bounce off the long terms, Tom. It's almost like, it's almost like those moving averages work. I don't know what, what's about. I don't know why these things work as well as they do, but it sure does seem like they work a lot. Okay, so any questions, anything else you want to review, any charts that you want to look at, any setups that you have questions about.
Can we, can you show us how to scan for these on finviz or Trade View just so we know the proper way to set it up.
Sure. Yep. While I'm doing that. So this gap on Google and this gap on Google are identical. Almost. Just so you all know. So this, this is what's about to happen. Same thing. Just so you have that in your knowledge banks. All right. Finviz screener, click on all right, calls on that.
Or would you buy shares?
You could do either one. I, I generally on Google am comfortable with either position calls or calls or shares. I always lean to shares because they're easier and that they're just, that's pretty much it. Like there's no time, Tom. They're not going to expire. Worthless. They're never going to go to zero. However, Google is an unquestionable. Absolutely. Very easy to determine, very easy to see uptrend. Right. And it's an uptrend on all time frames. The only thing that makes me a little sketched about the calls is the all time high is here, it's 150. So when I say sketch, I mean I would prefer. If I buy calls, Tom, I would sell them when it gets back up there and then I would use whatever profits I made to buy more. When we break out of that big bear volume there. Not an if family. That'll be a win. All right, we do something like that and pop out of there. It's gonna be nice. Okay, so the scan on finviz again, we're gonna still have some other things in in place here. So I'm still going to do price because I don't want cheapos in here. So there's some parts of the scan that are really always going to be the same. So I'm going to scan for stocks that are over five and that's going to take away like 2,000 of them. I'm gonna do average volume over half a million and that's going to take away a bunch. Now we only got 2000 stocks to look at. So we can have gap down. And then we can have. You could do candlestick. So there are some candlesticks that you can search for, right? Like okay, gap down into a hammer. So let's do it. Gap down into a hammer. And the change from open is up. And this will be a pretty decent bullshit scanner. Doesn't mean all of them. And I'll put this in your WhatsApp for you. It doesn't mean all of them are going to be perfect candle patterns. But this is. Or it doesn't mean this is all going to be a perfect bullshit pattern. But this is really a scan that's going to get you farther than just looking on your eyes by yourself. Remembering that you can do every scan every day for every setup that I tell you and you'll run out of money very quickly. EBay. Almost had one. Let's go look at eBay. EBay. Yeah, it was close. So you can see it wasn't perfect, but there it is. I mean that's a decent little morning star reversal already with that scan. I like it. Yeah, you're at the hundred simple on a monthly chart. So there's your blue line. So that's a resistance. You got the 100 on the weeklies at 44.66 and then you got the 102 on the daily. Like this is one. If I was. If I was really thirsty. Really thirsty. Entry here. Target There. And that's a dollar and a half. That's thing you can scan for anything. They're all there. It's all. It's all available for us. Let's go look at. So I don't like this chart. That's the other thing I really like about Finviz is you can just hover over the charts and just kind of see it. The reason I like that chart is because that's what's called an adr. American Depository Receipt. You get gaps all over the place. So I don't like those. I've never even heard of this ticker. GGG. Looks nice though. Again, not a. Not a bullshit exactly. But this one was over here. I'm gonna go to the weekly chart. I'm gonna go to the monthly chart. I'm gonna zoom out a little bit and look at that. So we found the stock at its all time high. Very close to it. Working on a breakout. Daily chart. So I'll draw a quick little line here. So here's a resistance. Here's the previous all time high. There's the all time high. This is just a resistance zone. Some really great gaps in here. Some beautiful movement. This was pretty. And again, how would I trade this one? I would look for. I mean look at all that bare volume that's about to get trapped right here from the other day. So I'd look for a new high and then I would buy the pullback into here. Strong bull trend. That's how easy scanning is, you know, for producing manufacturing company. There we go. That's potential trade chart set up. All right. Leh. This is close. Lennar Lear Corporation. So this one earnings is just two or three days away. So I'd probably wait on this one. It's not again, not a perfect bullshit pattern, but it's definitely close. It did have a gap down. And again I'm playing. I have the candlestick as a hammer. So you can have the candlestick as essentially whatever you want. You can go through a few of them. But it's. I do like I love hammers, right? So a little too gappy on this one. Oh man, look at this. This is the one that John Alonzo played. I. Can all of you see how that trade could have been played, right? Taking pretty much the same sentiment that we, we've discussed so far. And that's a really, really beautiful hammer there. Bear candle, shooting star inside candle. That's. That's your entry or this is your entry. So again you today you don't want to play this. But you could buy a pullback on it. Earnings is not that far away. So it looks like it gapped up not on earnings, which I really do like. Really? I like great gaps that happen not on earnings. Jeremy, why do you think that is? Why I think I like gaps that happen not on earnings. Stronger. My thought, if I see a gap that's not on earnings, then there's something going on. It's like a stronger sentiment because you kind of expect some sort of gap around earnings. Yeah, precisely. So people kind of get surprised more. That's exactly right. People are like, oh, wow, that was weird. I had no idea. Yep. It's not expected. Exactly right. Not expected. Let's go look at. What was Home Depot doing? Home Depot. Nothing today. I'm just gonna look at some other stocks real quick. Caterpillar, Russian. Oh, wow. It's gapping up. Yep, it's gapping up on our earnings. Caterpillar gapping up on earnings. Okay. P, D, O. No, no, no. And almost. Let's go look at W. Was that Wayfair? Wayfair, yeah. This one's close. Again. Another. Another nice little series of hammers. But again, what's cool about this one as I'm looking at it is it's not quite a bullshat, but again, this is how you scan for it in Finviz. Pretty easy scan. And if we take out slash close below the low of this pattern, we know that there's going to be some bulls that are trapped. And so that could end up being a day trade, a swing trade. There could be a lot there that could. That could slowly transform that pattern into some. Some unique selling. And then for the bear shat pattern would kind of be the exact opposite. So let's just do any candle on this one. Let's increase the volume a little bit, and let's have a little bit more fun with it. We're going to go to short float, so we're going to do shortable under option shortable. That way we can short the stock if we need to. Tom, we're gonna do float short over 5%, which we're gonna talk about a little bit more next week. But this means that people are shorting the stock aggressively. And we're gonna do gap up and we're gonna change from open down. There we go. Now we got 19 to choose from. And I'll post this scanner and this will be a bear chat scan. Fill. That's weird. Okay. I don't know what we're doing.
All right.
I guess I'll Just wait. I'll post again if that doesn't work. And then again, the reason I mentioned earlier, I like. I really like scanning through just looking at this. I can just hover over and look for a pattern that catches my eye. Because the more you do this and the more you start studying charts, you'll get something. Just go, oh, that's really pretty. M I n m I n m. This looks cool. What are these volume spikes doing? John, what are these volumes doing? Look at this. Weekly hundred right there. Daily. Yeah. Minimum inc. No clue what it means, no clue what it does, but that one is officially made my watch list. And again, why? You got the pattern, you got the volume, you got the breaks, and you got some compression. So let's see if it can hang out for a day or two because that cracks the 100 on the weekly. What's. What's going to hold it down? Not a lot. And the volume. The volume is there. All from a free scan. Similar. Just took it off in bs. I found this one this weekend on a similar scan. Inbs. Again, it might not do anything today, but I'm watching it just. Just to see how it interacts with these. With this average here. Just a volume scan that alerted me to this one. Nbs. So it's worth watching if it takes out the high of that candle for two or three days. Again, not. Not a lot. This one's gonna be really, really, really quick. See if I can post this scan back in WhatsApp. No, not yet. Weird. Close WhatsApp and restart it. Okay, Take a screenshot of this, but there you go. There we all go. US Steel. Yeah, US Steel's been doing nothing for a little bit, but as you guys get these lists and you do the scan, you scroll through them, you'll eventually find things that just look interesting or look appealing to you that allow you to go, okay, cool. Based on this, Based on this, Based on this. Lqda. Was that Liquidia Media. You got your bear candle. A bunch of bull candles in a row. Not a bear shot exactly, but close. This is your weekly chart. So kind of out of resistance. You had a good bounce. So there doesn't a. There doesn't appear to be a whole lot above it realistically. Right. This is the weekly chart. So as you're zooming out on the weekly chart. Yeah, that one looks kind of cool. This is the daily chart. And I do like this compression. I would really, really like a little bit more of a build. So let's see if we can do something like this or trade sideways. But I'll put down the list on a swing trade list. I'm just kind of keep on it. I'll, I'll come look at it Wednesday because again, when you have every choice in the world, you just want the great ones, right? All right, Brian, Take care, buddy. So to review some of our trades or stocks that either may be in or might be watching pretty closely, we got stopped out of Zim, which is fine. That one happened pretty much instantaneously. So I, I'll leave Zim alone for a little bit. The ones that we're all probably most interested in is Mongo database only because if you missed Nvidia, you probably don't want to miss this one. It's the exact same pattern and there's, there's nothing above it. Once, I mean this, it closed on the weekly. So that was it. So now we're entering a new month and the new month chart already looks strong. The weekly already got the close and so now I'm in And I will buy on any pull. I will buy and add to my position on pullbacks. Bear candles or weaknesses. You could be in shares here. You could be in long term call options, long term call options of anything. For me that expires past May. I'm going see if we can crack this price and ultimately all we really need to do is get up into 500. I think that's very, very possible, Extremely likely. This gets a 500 this year, you know, so 70, 70 ish dollars a share. Obviously you can make the alt, you know, go to 580, but this is the, this is a target based on this gap is, I don't see, I don't see anything stopping between now and then. So that's Mongo database. This is Advanced Auto Parts which Joe is in and she's making some good money on, which is awesome. I will still try to wait for a pullback down into like 63. I just don't think we're going to get it. Personally, I know a few of you are in Boeing playing different things. I still haven't gotten filled at 195, so I'm still kind of waiting on that. Earnings came out, they were pretty decent. You're still below all the moving averages. And again so if you are doing some strategy on Boeing, just, just remember be buy low and buy slow because it's going to take a while for that to recover. Just because it's of the news, right? None of the news is good on Boeing. That's what you want to buy. You want to buy when news is bad, when the stock is low, you just buy slowly because you're going to, you're going to have to hold a little bit for the fluctuations of the stock to go higher. It is going to have a pretty good gap on a day trade though, so it does look like it's going to open below the low of this candle. So there's gonna be some cool little selling on Boeing. That looks unique and interesting. Rivian. We'll see. I'm still in my shares letting those do whatever it's going to do. Tesla, same thing. There's still a decent amount of weakness that keeps coming into Tesla. And again, looking at the overall chart, we're comparing Tesla to this move over here, right here. And so far it's really not that far off. Right. You have the drop, you have a retest, you have a consolidation, you have one push lower. Drop retest, consolidation, Tom. So I think we're gonna get that one push lower still. Joe has a put sale at 170, which means she wants to buy some shares at 170, which is a good price to buy. Keep in mind, whatever price you're buying Tesla, you're not gonna get the low. They're gonna chop around for a bit. It's gonna take a while for this thing to get real strong. Liftoff. But it will. Tesla can dance the beat of its own drums. It does not need the market to go higher. It can do whatever it wants to do, which is cool. So if the market goes down, Tesla can go up. If market goes up, Tesla can go down, vice versa, can go up. And market goes up, doesn't go down, market down. Those do whatever wants. But if you are shorting Tesla on day trades, short on retests, and what I mean by that is if you are playing it, don't play breakouts, because we are really, really, really extended. We're pretty, pretty far away from the 10 EMA. We haven't really pulled back into that for a while. We keep getting beat up by short sellers. So if you're doing any day trade on Tesla, just make sure you wait for that retest to come in before you're playing anything short to continue to go through another list. So we have Carvana. Carvana. A few people are in that one as well. It's just hanging on top of the 100 right here. So it hasn't broken it yet. So if I just hide all the lines, all the drawings for a second, you'll see Carvana Just really hanging on top of that 100. If it breaks that 100, I have no reason to expect it not to go to 3429. So if you're going to be buying more shares there or if you're in protective puts, right, essentially keep holding them into the 200. Tom Chewy, same thing. I'm gonna get filled on all my shares, but I still have these protective puts on Chewy. And what's going to happen most likely for me is I will be getting exercised on these, on Chewy, which means I'll be selling my shares at $20 for a small loss and then looking either get back in or see if it plays how it plays off of this support. This is the strong support on Chewy based on that volume. And so if it doesn't hold, it's going to go lower. That one's just going to be a good practice of risk mitigation. And then obviously Nvidia is the big winner. So this is my drawing and my expectation. What I think is going to happen, I think it's going to go above 700 probably this week and then start to slowly start pulling back. But that's just a quick review of some of the trades are either in or reviewing or planning on being in for some of you. I know a few of you have different individual positions. Is there anything that anybody wants me to review or check out for them personally? Day trades, swing trades. We can look at anything, anything you want to review. Can you look at QCon? Absolutely. All time. Okay.
I'm filled on one of my pyramids and it just, I missed it by the second one by 40 cents, but.
Oh, nice. Okay, so 40. All right, sweet. So your limit buy, right? Yes. Okay, so I got good news. This bull candle gap down into a bull candle. Second bull candle opened and closed below the first bull candles open. Which means that, my dear friends, is your bullshit pattern. Scott found one for his team. How cool is that? So you have a level level that needs to hold and if that level does not hold, it's going to slowly dip down more. Which I would say since you want to buy Qualcomm, it's a great stock to buy on a pullback. Absolutely. Is like a must own great trend. I'd probably just lower your limit orders a little bit more. Right. So as your second, your other order entry, your limit didn't get filled by a couple pennies. Lower it some maybe to 135, 132 and that'd be my takeaway. I don't necessarily know if you need to short it because you want to buy shares. So if you're day trading it, probably in a different account, maybe you could short it because you can't short a stock that you own in the same account. Right.
So you're saying where my limits are now bring those down. Because we're pretty confident it's going to continue to drop.
Yeah. Or at least, or at least this limit order, you know, the one that you missed by 40 cents, even if you just take that one down a little bit. Bit.
Okay.
Yeah, yeah, great.
I got my shares, like you said.
Totally, totally. There's your weekly. So yeah, the, the ultimate levels. We want that bad boy, those, you know, 126 price point, which would be really cool. That'd be really fun to get. Ms. Sue, what about you or Jeremy or anyone else or Eric? What you guys looking at?
You could look at ELF again. For me, it just keeps going up. I'm like, probably need to sell it and buy something else because I don't have a hard shares, but it's gapping up today.
Yeah, you could, I'd probably say hold over earnings. Just leave it alone. If you again, sell anything, sell small percentage 10 of your shares and then just go, all right, cool. Hold it for a stock split. I mean, because at this point you bought it so low. I mean, ladies and gentlemen, our girl sue bought the bottom. This pullback down here accidentally.
But yeah, good accidents happen.
Buy stocks and uptrends, you know, that's the way it works. Yeah, I just hold on to it forever, I guess, at this stage. Because it could go to. They go to 200, why not? And then they, they do a stock split and then 30, you're, you sell, let's say you sell three shares, right? Your 27 shares turn into 65 shares and two years later, your 65 shares turn to 120. And then you have a, a good core position of ELF Beauty. Or it gets bought out by Ulta because that's what you could expect. Like I, I would if I was you this week, spend some time back trading Ulta because If they're similar, Ms. Sue, you could be looking at your elf being like right here, like $161 a share. It looked kind of like a similar chart. Right? You had a big run up to essentially 300, and then a pullback to 2, and then a move to 360, then a big drop. Yeah. And then it's at $500 a share.
Crazy.
Crazy. And again too, like you go and look at ELF and you go try out their beauty products. Right. Go to the store, go to the customer service counter. Maybe buy, maybe you should buy some more shares. Like maybe it's a really good position to be in and you can take income from your business and buy five shares a month and just kind of build into a good core position because you got such good cost basis on it. So that, that's just w up to you essentially, right. That discovery of should you be in more, should you buy more, should you analyze, should you study it. But at this point, man, I would probably back trade Ulta because that's either Ulta or Estee Lauder since they're in that same arena and.
Yeah, I like it.
Yeah. Come up with some trajectories and just see what could happen for you and the problem. Just leave it alone. I love it. It's really.
Thank you.
Of course, Of course, of course. Who else squadron. Did you look at SoFi? SoFi technology. Let's go check it out. Sophie. So this one, so this one was an interesting one because how quickly, how quickly this volume got punished. So again for me I, I'm not in this position personally but if I was in I would just make sure to, to have some, either some puts or just slowly be trimming some positions. Don't have anything too, too heavy. I'd be inputs though just because awesome gap. Amazing volume. Beautiful, beautiful. Boom. Got spanked. The very next day, very next day, the stock action closed below that. I'd have to relate it something to this because I was in this position and I'll just kind of back. Go back a little bit. There's. There's definitely some differences. So it's not identical but you can see, you know, back in August, great earnings, awesome gap. I thought this gap was going to go to the moon and then essentially the next day we close below that volume and then just, I mean that, that's how volume works, right. You have a bunch of buyers and then you take out those buyers. They just sell. Those buyers are going to turn to some sellers. So just make sure you have some protection I guess is really all because the hundred on the weekly is 689 and we've been down there before and I think that there's a good chance we get down there again. Thank you. My pleasure. Yes, sir. Okay, so we got Mongo. So just to review some of the big names just so we'll have kind of our plan since you know it's only a month in Meta's going higher. Ladies and gentlemen, don't buy it today, but buy it at a lower price at some stage. Go ahead and start planning. Do your big, big, big, big boy scans, your big stock scans. Unbelievable move. Crushed earnings. I mean the, the big names on pullbacks are going to go higher at this stage, right? So the really large companies, I don't see any reason for them to stop at this point. Your Google's right, Google's going to go higher. Your Amazon again, it needs to rest. It's going to have a pullback, but you can buy dips. It's going to make at least get back up to its previous all times high this year. So don't get fomo. Don't FOMO in. If you, if you experience FOMO and you're like, oh my God, I'm an idiot, I'm an idiot, I'm an idiot. How am I missing this trade? Buy 5 shares, buy 10 shares, right? You don't have to buy a lot. You can nibble if you feel like you're just really doing something stupid, you're missing a position. But the big names, I mean they all did good earnings. Apple did gap down. So I was wrong about it gapping up on earnings. But Apple's going to go back up to 195. So if you bought Apple, good for you. It's Apple. That was a, that was a day trade. Stop loss. Okay, so Apple's a really nice little good open this morning is opening above the high of this candle. You know, it was a beautiful, beautiful move. So Apple's going to go higher. All the big names, I don't know why at this stage why they wouldn't. The trends are really, really strong. So yeah, your meta, meta, Google, Apple. Let's go look at Netflix real quick. Netflix has some really nice compression. Look at that sideways move. So that's ready for something up or down. Tom. I, I'd probably lean to shorting it and then, and then going long after it pulled back some. But it wouldn't be an ultra aggressive short because you're about to come in contact with the tenants. Maybe today or Tuesday. It could be a quick little day trade. But if you don't want to do anything with day trading, just set to buy some on some pullbacks because right now trends are, trends are bullish, Tom. And if we look at the big, big, big market, we did get a, that early pullback in the beginning of the year that we were talking about, it only pulled down 4%. So it was small. But the next one that we get which we always get pullbacks, guess where we're going to pull back to. I mean any pullback that we get at this stage, you're pulling back to old resistance, new support at this stage. So we get something like this and you know that that's your, essentially your worst case I would assume for your bulls is we just, if we pull back to the previous all time high. So this is definitely a time to just be looking at some good charts. One of my mentors, one of the best traders in the world, Dennis Dick, on Friday, he said if your stock didn't go higher on Friday, you're holding a shit stock. So something to keep in mind, right, if you got, if you have a position that did not have a strong update on Friday, that didn't put in a good return, that didn't make some type of strong move, it's probably not a good company or, or it's most likely not going to be ultraly well performing.
So you think I got a bunch of those?
Yeah. Well, again it could go higher over time. It's just like if it, if it didn't close bullish on Friday, it's again, that's just what Dennis Dick said. But he knows this stuff. This is a market strength, so be looking for strength. Can you go back to Google please?
Intel didn't close.
Good, I'll go Google and then Intel. What you got for me, Eric? Yeah, just look at that. If that takes out that big three candles ago, that big bear candle with all that volume, that thing's going to fill that gap pretty fast, don't you think? And head by the end of, by, by March 18th, we're going to fill this gap. Okay. Why, how did you pick March 18th? Because of, it's about how long it took this move. Okay, got it. Yeah, that I just sprinkled in some extra days just in case I'm wrong. But yeah, that's all I do, man. I just go, I ask that question every single day, every chart I look at. Did this do this before? Whatever chart, it doesn't matter. Did this happen before? Okay, what, what happened? And then I take it from there. I mean the fact that you gapped down on last earnings and you had one, two bear days and then one final push and then a bull move, I mean gapped on earnings or one bear day, small bear day, final push lower. If you look at the percentages, I mean it's scary, you know, from, from close to low 12%, close to low 10. And I thought the last one was more Bearish, in my opinion, than this one. Last one was below the 100. I thought I was gonna go to the 200. So, you know. Yeah, ma', am, this Google is going to go higher. It'll fill the Gap by March 18th. And then intel said, my boy, Scotty, Intel. I mean, it didn't. It didn't have a strong update. I agree. But intel is going to fill the gap. It will. It has to pay dividends. It's a beautiful hammer, Scott, right at the 100.
Yeah. Up and down again today.
Yeah, Light. Light it is, but a little bit. This has such a big, you know, had such a hundred percent move on. On intel. Right. Went from March 23rd to just the other day. You know, Intel's up 100, so you're gonna have to have some level of rotation. This is the weekly chart. So you're below the. The. The 200 on the weekly, which just means again, to your position here. What's that?
Did you add more to your position here?
I would add my. To my position a little bit lower. Wait, so here's where I would add to my position. Let me adjust this chart for dividends for just a second. Yeah, man. I'd still have put sales around 38. So I'd be adding to my position down here. If I added here. There's two strong reasons as why you would slash could maybe even three. And we'll. We'll go through those. Nice hammer. That's one. You're at the 100 on the daily. That's two. If we go to the weekly chart, you're at the 200. Simple. On the weekly adjusted for dividends, that's 3. And so all that means to me is if I'm adding down here, I'm probably adding small. All right. I wouldn't take a huge, huge, huge core position. Like, if you have a thousand shares, I wouldn't buy 3,000 more. I'd probably buy a hundred more at this price. And the part. The price that I would add a lot larger size would be down here because that's a really, really comfortable pullback at that stage. You're down 25% on Intel. It's the hundred on the weekly. On the adjusted dividends chart, it's the a hundred on the monthly adjusted for dividends chart, Non adjusted for dividends chart. It's very, very close to the 200 on the monthly, which is what we bounce off of. Of last time. And it's the 100 on the weekly. Non adjusted for dividends. So there's a Lot down there around that 38 price point. That's where I would add a lot heavier, personally. And at this stage, yeah, again, I would add some, but it would be a little bit of a lighter position and just capture those dividends and make sure that you rebuy some shares with your dividends. Yep. I'll walk you through this position, man. You'll come out profitable on it, don't you worry. Same with Qualcomm. They're both great companies. So it's just. Just got a little bit of. A little bit of a matter of time. A little bit of matter of where you're buying. All right. Intel, anything else?
Yeah, Jeremy, we look at album. It's gapping down.
Yeah, yeah, it's this one. This one's unique. I don't know why it's so weak, but what I'm gonna do is I will buy a put on it later today or tomorrow because I'm in that 10k challenge with you, with Dan. It's a great company. It's gonna go higher over time at some point. But this gap down's not the strongest gap in the world. So gap down. When it pulls back up to 113, I'll buy one because I don't have many shares of it. I'll buy one. 115 put for March.
When you say March, are you saying the end of March? The third Friday of March?
Yes, ma'. Am. Third Friday, March. Yep. Just regular March expiration. Gotcha. Just have some protection. And then just to make sure that this is not getting missed in translation, I am long on Mongo database. This is the. This. The next big, big, big breakout. Is everyone clear on that? Apparently. Apparently you guys didn't want to take Nvidia. Some of you. Some of you missed Nvidia's gargantuan moves. I just want to make sure.
I mean, it's just been.
I've just been buying a couple of shares. Like, I think I'm up to 10 or something. Should we go a bit heavier then?
If it. Especially if it retests. I would if I was you. Yeah, yeah. Get into some shares. You could always get into some call options if you don't want to buy into some shares. Very expensive, too. Oh, yeah, it's, you know, it's a 400 stock, but you get what you pay for. Family.
Fingers crossed this time.
You get what you pay for.
What does Mongo database do?
Collects data on bases, bro. Duh.
Like a cloud. Like a cloud database thing.
I looked it up like a big server company.
Yeah. All right. Anyone else? Any question? Cool. All right, family. Love you tons. I'll be back. Your homework. Look for bullshats and bear shats. We're going to review them all week. We're going to keep an eye out for them all week. We're going to study them all week. In the next week, Tom, we're doing earnings, gaps, fade ups, fade downs, then short squeezes, gaps all month. If you have a question about a trade or a chart, feel free to post it. If you have a question about a gap, feel free to post it. If you have a question about anything, feel free to post it. I'm here to help all of you in your trading journey and career. Please let me know how I can assist. You are all amazing. I'll see you Thursday, family. Thank you, everybody.