How to use Dow Theory to revolutionize your trading profits! - Intermediate Class #2

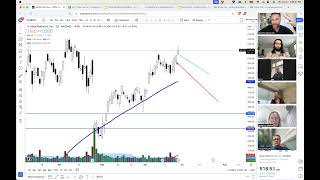
Live webinar (module 2) by Jerremy Newsome teaching intermediate trading concepts focused on Dow Theory and the fractal nature of markets. The session explains the three market phases (accumulation, public participation, distribution), how to spot them across timeframes (fractalization), and practical tactics (protective puts, entries on retests, stops, volume interpretation, wave counts, candlesticks) illustrated with examples (Twilio, Square, Shopify, Lulu, Macy’s, Boeing, Dropbox, Carnival, Uber). The instructor emphasizes process, risk management, patience, and that large winners often come from newer companies and long accumulation periods.
Chapters
Live from Music City, Nashville, Tennessee, this is your motivational, sensational, inspirational, educational, aspirational, international, keenly awaited, highly anticipated edition of the intermediate trading program, brought to you by Real Life Trading. This is module two. Folks and friends, team and family, folks from around the world. Type in A1 if you can hear me. Okay? Type in A3 if you can see my charts, type in A1, A3, whatever you want to type in. I'm here, you're here, we're here. Let's make magic. Oh, yeah. Getting some ones, getting some threes, getting some 13s. Farrah is here. Thanks for being here, Farrah. You're such a great person. R. Santos is in the building. Cameron Blood. What's going on? Cameron, I think you're Amy's dad. Thanks for being here, sir. Lucas is here. Steve Wise says hello. David's here. Dallas, Dave, welcome, my friend Amy's son. Even better. Very cool, man. Very, very cool. Love it, love it, love it. Folks and friends, team and family from those who are here, wherever you might be watching, if you're here on our live audience, live studio, YouTube, or on a webinar, or you're watching this on the Real Life Trading website. Our mission, my folks and friends, is to enrich lives. And we do that by guiding many people towards fully achieving an understanding financial freedom. Once you get a grasp on that, you understand it, you feel it in your bones, and you can live with it and you can breathe in it, you can honestly say that you've achieved it. Whoo. That's a big deal. It's a huge accomplishment. So this particular module goal, what we're gonna be trying to achieve today is we're gonna discuss Dow theory and the fractalization of the markets. Oh, some big words in there. I had to look up fractalization, like, nine times to figure out if that was the correct word and make sure I spelled it correctly. So love it. Some About Me I love being on podcasts and hosting podcasts. So if you have a podcast, invite me. I also have a flawless beard at all times. Just throwing that out there. I also do love growing pretty much anything. One of my side hustles is I like to call myself a performance architect. So I truly enjoy assisting people. Growing businesses, ideas, sales, campaigns, employees, staff, sales. I have a lot of skills. I spend a lot of time focusing on, and it's one of my really exciting things that I love doing and love helping people. That's just one of my other things. If you have something that appeals to you, that is something that I do. Here are some other skills slides that you can access. SRI says how can I find you in podcasts? Type in those exact things in Google Jeremy Newsom podcasts and you will get so many. So many. So for those of you who are in Canada, I forgot about our neighbors to the north and I apologize. So what myself and Matt DeLonge did is we spent no big deal, about nine hours between last class and this class trying to figure out how we can assist you and. And we did. So if you're in Canada, you can text Newsom to 312-487-3550 and we'll get you the slides. If you're in the US and you want to text Newsom 55444 we'll get to the slides. How cool is that? You're welcome. I mean the amount of time and energy that took would astound you. But it's worth it because I love everyone and I just want all of you to be successful. So get your slides from each day's class if you want. Also, you're going to get a free real life training dashboard. Load up your custom dashboard with tons of free courses, tools and premium high end training. All right, here's where we are. Module 2 How Dow theory impacts your trading and the markets I want to share a little bit about the insight between module 2, 3, 4 and 5. As I was building this class and this program and this instruction, what I started doing and I've actually gone back and forth about the slides and the content and the information I want to present. What I first started out doing is trying to teach you all everything. So I nailed it down and said wait a minute, what am I trying to achieve? My goal is I want each and every one of you to be able to leave these modules and feel really secure in a strategy chart, patterns and candlesticks that you can really start using to make money as quickly as possible. I don't want to give you a lot of conjecture. I don't want to teach you all the things that I know. I want you to start making money trading. There's a lot of things that I know fortunately and unfortunately in the markets and rather than me just teach you all the things that I know, I don't want to show off, that's not really my goal and I don't want to overwhelm you. I want to give you information that's tangible, tactical, specific, useful, and can be applied immediately for you to start making some money. Type in a 1 if that makes sense. That's really what I'm looking for. That's what I want to do. So what I did is I reboiled down all of the classes and what you're going to get from module 2, 3, 4 and 5 is the meat. Like some core stuff. Not a lot of fluff. I'm not going to go through all definite. I'm not going to go through all the things we're going to go. Here's what it is, here's why it's important. Here's how you make money doing it. Because I don't need all the other things. It's going to be epic. So here we go. I want to define some terms. Here are three terms that we'll be using a lot and I use very frequently in all of my trading. The term accumulation is where the general public has fear, the broader investors are scared and panicked to buy. And there are very few buying signals here. I mentioned this yesterday. True or false? It feels really good and easy to buy at a low price. And the answer, my dear friends, is false. That's obviously what we want to do, right? That's the goal. But I promise it does not feel easy. It's against human nature, as Jason said, because we don't have information, we don't have verification, we don't have confirmation. We simply have a possibility of something occurring. Remember in the last module I mentioned, how do we know if anything is going to bounce? And I said that we don't. We don't know. That scares people. Especially if you're an engineer or a doctor or a lawyer or a programmer or someone who needs specific exactness in their trading and in their life. See, me, on the other hand, you can probably guess I don't need any of that stuff. That's just not really my personality. I'm not saying it's a bad thing at all. We all have different personalities. We. Me, on the other hand, I have to have constraint on how often I trade. The actual amount of trades for me is not a problem. I'll get into anything for my engineers and my doctors and my scientists and my chemists. It feels very easy to buy something when it's high because you have tons and tons of data. And by the time that you have all the data, Jason, what happens? It's too late, right? It's too late because the market already knows what you're doing. So Jason mentions in the chat pane, I struggled for years as a scientist to trade the markets because I need to trade confirmations. It's hard to get over it really is. I'm talking to you. If you have that personality and you know who you are, it's never going to feel good. And it doesn't feel good even for me. It's just a kind of scary thing that you have to push through it. So accumulation is where we as traders need to start accumulating positions, right? This is where we need to start picking up some things. Now, does accumulation mean you take your entire net worth and pile it into one stock at one time? And the answer is obviously no, right? That's not what that means. Not even close. John says, I'm an electrician and I can relate to Jason. Of course you can, dude. An electrician. That's an extremely specific, absolutely detail oriented profession. You know, I mean, I was an insurance, I was in car insurance. So, you know, you don't need anything with that. Electrician's like, okay, you either get the cables right and they work, or you get the wires wrong and it doesn't work. Or you get electrocuted, you die. You know, so there's not that much wiggle room in electricity. But you get what I'm saying. It's the education and the sentiment and the approach and the perspective and the personalities. That's what makes the market, that's what's exciting about it. So here's the thing. Public participation is where a lot of money can be made. This is where a strong move either up or down starts to come in. And this is where the news starts to pick up the story. And distribution, my friends, is where smart money begins to exit and the noobs begin to pile in. This is where it feels the easiest to buy. This is where I buy silver. This is where I get in the very, very top of a trade. Because it seems so easy. All the data is there. This is Bitcoin at 19,000, okay? Where it's like, yeah, everyone's talking about it, everyone knows it. You just, you get fomo. You feel like a moron. You're like, why am I not in this position? How am I missing this? I'm so stupid. All these people are making all this money and I'm over here being a doofus and not catching anything. Type in three, if you know what I'm talking about. Or at least it happens to me all the time. Maybe it's just me. I get it. It's a strong possibility that I'm the only one, but I doubt it. Now let's talk through this and just look at some charts. This chart brought to you by trendspider this is an accumulation period. Now notice in the bottom, how long did it take to accumulate? Took about a year and some change. A year and a half. That's a long time. Ain't no one making money. That's bill paying money over a year. I mean if you bought really anywhere in that green box, you were bored out of your mind for a specific period of time. And even if you bought right here, you got the very, very tail end of that candle, you caught the tail end of that move, you still had to ride up and then hold through a retracement. You had to hold through four months of this, right? And then it continued higher. I mean that's a long time at least I think it's a long time. So what I'm gonna do, let me pop over here is this thinkorswim. I'll minimize that. Let me just pull up really quick just so we can have a little bit of an idea. This specific approach was I did mention I want to just kind of pull back the charts really quick. And this is a whole list of all the charts that I ever published. And what I want to do on some of this is kind of go back in time and just kind of discuss a little bit about how it began to approach. Right. How it, how it all started. So what I'm do is I'm going to look at this chart but I want to go back in time before it happened. So this is 2016 on Twilio. So this is way before we looked at happened. Now what you see on this chart is a wave count. We're going to talk about that in the advanced section. But the wave count stipulated that. I thought based on this chart that stock would do this, this, this, this, this and then go a little bit higher. Alright, so let's press the forward button for a second and just kind of see if that's actually what occurred. Alright, Type in a 7 if you can see that we did bounce pretty much there and we went a little bit higher and we stopped almost for that. Wave five ended and then we went lower. Pretty cool, right? Okay, that's awesome and all, but that doesn't tell us anything. So again what I want to do is walk you through my thought process back then. Not now talking about current, but I want to go back in time and figure out what that was going to happen. All right, so now we're going to go forward about seven months. And I mentioned Twilio is at a support level. So this is going to be something we're going to talk about in the advanced section as well. But protective puts or stops. If you're trying to pick an accumulation, if you're trying to get into the bottom, you're going to be using protective puts because you will get whipsawed out. We're going to talk about that in future programs. But bottom line, I was 100% dead wrong on this trade, right? So look what it did. It went up and then crashed 100% wrong. So I showed you one that I was right. I showed you one that I was wrong. And this is where I was. This is where I started thinking to myself, okay, this is really unique because right about here, type in A4. If you can kind of see how it traded up to a previous resistance and then stopped. I'll draw that resistance for you. But again, the reason I'm showing you these charts, my friends, so you can kind of go back in time with me, I can kind of walk you through my steps and my thought process because when that candle came in, you'll notice there was the high, previous high, and there's the resistance. So I started shifting my analysis a little bit. I started shifting my perspective. Just some said to myself, okay, a few months later I drew some different lines, I drew some different levels, I drew some different support. And this was Twilio now back in December of 2017. Now what's really interesting about this is I'll read through my analysis. Okay, so this is November 30, 2017, a buy low, sell high candidate. Also a tech stock that did not really participate in the sell off of tech from yesterday. In fact, she's already above yesterday's high, more than likely a four to five month play from here. I would rather use protective puts than stop some shares because Twilio is in an accumulation phase. And we'll chop around here for a bit, hopefully goes higher. An interesting one to watch. And then three or four days later I'm like, all right guys, still watching it. And then February, it worked well. So let's just look at kind of what happened. Again, I'm not showing you just the brag, I'm showing you all this so that you kind of know the steps, right? I actually did go through all of the things that we're talking about in today's program. In my analysis, this was a trade that a lady, her name is, let's just call her T, she lives out in California, she retired off of this trade, this one particular trade, because she liked Twilio. She did a little bit of analysis into the company. She found out a little bit about what they did. And she said, yeah, text message servicing, automated text Messages, text message CRM platforms, APIs for text messages. I like it makes sense. I can understand that. So she did a little bit of longer term fundamental analysis, pouring in a little bit into the company. Just, is this a good company? Is this generally a strong company? Here's something that's a big takeaway, my friends. The big takeaway in this process is if you're going to make large, large sums on a company, they generally are newer companies. When people say, Jeremy, what's the next Apple or Microsoft or Adobe or Google or Amazon or Facebook? They're the newer companies, right? If you want the newer company, you're gonna have to go find newer companies. You'll have to do a little bit of research and look over some charts and pour over some fundamentals and find out, do you understand what they did? Do you understand what they do? Do you understand their products, what they're selling, how they're actually making money? Because if you do that, you can take a trade that looks a little bit like this. So again, you'll notice when I said protective puts, what that does is it actually keeps me in the trade and prevents us from getting whipsaw just two or three months later. You had what we're talking about this in module 5, a really, really strong gap action. Really beautiful gap. Notice how that candle opens above four months of price action and just never comes back. They had very, very good earnings. They came out with a number that was like, wow, Twilio is making this much money. Holy smokes. And it was gone from there. That was it. That was the lowest it had ever got. But type in a 1 if you would agree that it did take about 4 to 5 months from when I first started looking at it at that particular point in time. Here's December and it started going in about March. Now do you think that's useful to have in your back pocket as a trader or as an investor or someone that you can get an idea of what phase the market's likely in? I think so. I think so. I think it's useful because let's continue to look at what Twilio did from there. Look at this. This is at 106 back in February of 2019. And check this out. So this is. We're going all the way until today's time. Now if I just keep pressing the next button. So now, present day it's at 105. Kelly says how do you find these stocks? It's a good question, Kelly. I mean, this is what I do. This is my profession. So the answer to your question is I get a group of people together, we look at stocks every single day. We read some news, we find out which companies are new, what they're doing, how they invest, how they make products, who they're selling the products to, and then we do some analysis. So in the afternoon room, this is pretty much what we do. And this is not a sales pitch for the afternoon room. This is just me saying I can help you find companies like this one of the other really, really big names that was very, very similar to what we did. Again, all this relates to the product and the class we're teaching is square. So square, if I come all the way back. So Square back in 2016. Right. That's four years ago. Notice we were bullish on square all the way back in 2016, 2017. I was talking about this stock. This was what. This is the one that put me on the map realistically, because real life trading was only a year or so old and, you know, I'd only had a trading company, trading education company, for a short period of time. Let me just pop into this July 1, 2016 analysis. Square was $9.27 a share, and I was selling puts on it, and I was being bullish. My analysis back then. Don't be such a square. Do you want to own some shares here or not? Jason says, I remember I was like, what square? Jose says, I got squared at the IPO. I sold it in 2018. Hey, man. I mean, still made a good profit. But it's really interesting how all this works because again, back then, I'm not saying I'm a wizard by any stretch of the imagination. What I am saying is, if I'm looking at this particular chart, ladies and gentlemen, Type in a 9. If you can clearly see that it's at a support level. I mean, clear as day. This thing. This thing is. I mean, look at this. Boom, bang, bang, bang, boom, boom. Smashing job with support. Now again, let's just do some math. It was $9 a share. Nine. How much would a 100 share investment cost you? Let's do some math. 100 shares. $900. 100 shares would cost you 900 bucks. And you know, square right now is around 70. It was all left to 110. So when you're talking about making a sizable investment, you do have to find relatively newer companies. If you're trying to do a what's the new Apple? What's the new Microsoft? What's the new Adobe? You're gonna have to find these newer companies are coming out. They're everywhere. A new IPO comes out like every week. Do some research and analyze them. Matt says do shop. Do shop. All right, fine, I'll do Shopify. I'll do this, the last one, then we'll get back to the slides, I promise. But I wanted to show you all of this is adequate. It is applicable. I'm not showing you this because I know how it works. I'm showing you this because it's legit. All right, so shop. July 1, 2115. Okay, great. New company, double bottom on the daily. Volume is increasing. So I'm looking at shop. We're bullish on shop. The title of shop is I love shop fundamentally. Shops at $30 a share back in 20, 15, 30. And look at this double bottom. We're gonna talk about double bottoms in the, in the very, very next class. The very next class right now. Again, here's a loser. Shop short. That did not work. I do not think this trade worked. Well, actually, let me rephrase. I apologize. This was pre earnings analysis. So this was me saying, okay, if it does this, it could do this. And it actually did drop a little bit. By a little bit, I mean about 9, 19% over that week and a half. So that was a short term trade, my short term, I mean, like those next few days or weeks. But that was a trade that was expecting for it to go down. And it did, it did drop a little bit. But again, look how it trades to support. And I know it's gonna be a little hard to see and I apologize, I can't increase this particular chart. But type in a 7. If you can see that hammer. Now you might remember to talk about hammers. We discussed them recently. So there's a hammer, right? Here's a hammer. Here's some high wave candles. A nice little bullish bounce. Look at this hammer. Type in a 10 if you saw that one. And look at this volume. Whoo, man, it's beautiful. So you're talking about shop. That was $18 a share. 18. We've been tracking shop since 18. Ladies and gentlemen, how many traders do you think have exponentially changed their financial futures because they've been buying and trading shops since 20 ish. 20. So the question is, do you want to be a part of a group of people that can do things like this? I think the answer has to be yes. So if you want to do so again. Shopify. Look every single one of these. Bullish, bullish, bullish. This is 2017, by the way. Bullish, bullish, bullish, bullish, bullish, bullish. We've been bullish the whole time. So reason I was bringing all that to your attention is because it's really magnificently crucial to fully, fully understand that this is possible. You can have some massive winners. You do have to put some time and some energy and some foresight and some direction and some money. But you have to take the time to understand how all this works. That's why you're here. This piece right here, right? Accumulation, it's the most boring part of trading. It's very hard to time. Accumulation can last a long time. It can last years. A daily chart and this is what everyone and their mom tries to find. The breakout. The breakout of an accumulation phase. The breakouts the most fun to trade and generally it's the most profitable. It does take time. It does retest very frequently. It doesn't move nearly as fast as you might think it does on a longer term time frame. But that's kind of the thoughts of accumulation. Jason says. And you can make tons of money during the boring times with the right strategy. Advanced strategies that Jeremy will cover in the next course. That's right. Indeed, indeed. Now here would begin public participation. So when you're talking about public participation, if you can look at a chart and go, yeah, the chart looks like it's in a public participation. What do most noobs try to do? One of two things. Right? A begin. A brand new trader will try to do one or two things. They'll pile in here to go long or they'll pile in here to go short. It's really weird. But a brand new trader loves calling tops. One of their favorite things to do ever. They love trying to be the person. They just. They always participate at the exact wrong time. It's the weirdest thing. That's how you know you haven't studied enough. If you buy and the second you buy it starts going down or you sell, the second you sell, it starts going up. You haven't studied enough. Now I'm not saying it doesn't happen to me. I wish I could say that, but it happens to me very rarely. I definitely get into some trades and I am wrong immediately for sure, but not very often. When I first started trading, I wanted to write a book called hey, do the exact opposite that I do and you'll make money. Have you ever felt that way? Like you just get in. And you are, you're the moron. Apparently the second you click the buy button, Bro, Shed Williams says, I published that book. It's a good book, man. It's a best seller. It's a best seller. So the reason I'm bringing up the whole noob thing is the public participation is generally the most fun of the parts to train to trade. And it's the most difficult to stay in. It's the most difficult to say when you're in a public participation phase, if you can look back and go, wow, we were in an accumulation phase. Let me bring that back to you again. If you were in what you might think is a public participation phase, maybe it is, maybe it's not. But you can go back in time and go, yeah, it does definitely look like we were in accumulation phase. Then you should probably hold that trade or investment, whatever it is. This is when you make the money. This is the important part of the class. Like if you want to make a lot of money trading, you're going to have to hold some serious winners at some point. And it's when it starts really rocking and rolling. So you'll notice that we did have a pullback, right? As I mentioned right here, the noobs who bought, they got smoked. And the traders who sold, they got right, they were correct. But look at what the stock did. The stock AKA Twilio pulled right back to old resistance and that became new support. Is that the most insane thing you've ever seen or what? That's mind boggling to me how that works. But it does, it works a lot. It works real frequently. The ceiling becomes the floor, old resistance becomes new support. This is one of my favorite traits. I want you to all know that I miss this part of the trade all the time, all every day. But you know who does not miss this part of the trade very often? Not me. I'm asking who do you guys know? Does anyone know? Because it's definitely not me. I still miss those trades too. But I catch one ever so often and that's what matters. I catch one ever so often. And that's the point. A bunch of real life traders will catch those trades. Now the red box is the distribution phase. This is where the news is most excited. This is when everyone's the most excited. This is when your grandma calls you up and asks you to trade her money. Or if you are a grandma, this is where your grandchildren come up to you and ask, can I give you $100? You can invest it for me, right? Or your dad wants to give you his retirement. Wink, wink or whatever. This is where it's easy. This is where the move has already happened. So when distributions come in, those are spots that you don't want to buy. And I already know what you're thinking, right? I know what you're thinking. This is a very strong bullish trend. Can you have one of these in a bearish trend? And the answer is absolutely. So let's go look at Macy's, right? Macy's, you have a distribution. The other question that you all have right now in your mind, right at this exact second, 95% of you, the question you have is, Jeremy, how can you tell that you're getting into a distribution phase, though? Type in a six. If that was a question you had in your mind, how can you tell if you're getting into a distribution? This is all cool and all, but how do you know? That's a lot of sixes. Looks like I have created the slides exactly the right way. Stay tuned. So the distribution phase. Terrifying, right? It's easy, it's simple. It's where everyone starts to get in. And then you get some general breakdowns. You get some general trend line breaks, you get some directions that change. You get volume, you get new highs, you get shifts. And then you start getting public participation. Big, big, big, big sell off. And then bang, you get an accumulation phase. So accumulation phases can happen in distribution phases. Sorry, I apologize. In bearish trends. Because this is where the smart money thinks the stock is going to do this. Now the question is, could Macy's have done that? The answer is, of course, right? This happens on every time frame. The smart money is not always right, I promise. It's just called smart money because they've studied. That's the Jeremy Newsom quote. Smart money is also wrong. They're just smarter than you because they've studied. They also lose money. They just know mathematically how to lose less than they win. Smart money is you out there listening to this webinar right now. You can be the smart money. I love looking for trades down in these kind of areas, especially when they make a new low, right? Like. Like this low right there. Boom, right? It makes it. I love trying to be that person who gets in bullish and then ride this all the way up to here. It's really, really fun. Jason says, look at that hammer. I know. And then it comes down here and I buy again at the new low. And what happens? I'm wrong. And then it turns into a public participation phase. Another one. I Didn't want to go through too much and draw too many things on your screen. But what do you all think? Is this area right here a small accumulation phase that did actually turn into a bullish public participation phase. And the answer is yes it did. Right. How would you have known? There are chart patterns and we're going to be talking about those chart patterns in the next module. But there are chart patterns that you can clearly see. That's a double bottom. You might have found a little bit of divergence down there. There's all kinds of signals that kind of give you a little bit of insight that might have been over. And then right here you have a really classic, beautiful, gorgeous, obvious double top which we're going to talk about in the next module. Double top, boom, boom, boom. Close to the neckline. Retest and she's going lower. And now Macy's is working itself down to zero. Right Now Macy's is $5 a share. Macy's and JCPenney will both file bankruptcy at some point. I've been saying that last five years. It's just taking a long time. Jason says every bit of insight you can apply to your trading strategy, put the probabilities in your favor. Yeah, it's just about stacking probabilities, that's all. Now here's a good question. So this is a weekly chart. Don't know if you noticed that or not, but this is a weekly chart. Remember earlier I used that really big word fractalization, the one I had to go Google to make sure I was spelling it right. Fractalization is so crazy in the market because it's organic. What else is organic? And I would argue life. Human life is organic. So humans are organic, the earth is organic, life's organic. Therefore the market has to be organic. And if the market is organic, it moves, it lives, it breathes like an actual living thing. Therefore it has cells that's going to blow your guys minds. But if it has cells, right, smaller fragments of bigger fragments, what's that going to be? Scientists. Can anyone give me the term fractals? Right, yes. So you're going to get really in there, really zoomed in and dived in. So this is an hourly chart. Steve says mind blown. Kelly says, not when the fret, not when the Fed is printing money. They'll always be something out there. I promise there will always be something. Fed printing money. Fed not printing money. Gold standard, not gold standard. 1942, 1987, 2020. There will always be moves you make money if it goes up or Goes down. But honestly, team, let me do this one more time. I'm gonna go back in time. Let me just show you this. If you don't think this is a little mind boggling. I always say that word, weird. Mind boggling. Mind boggling. Need to work on that word. Check this out right here. Just, just really, really look at this pattern for me. And notice how you get this distribution phase and then it sells off and you have like a little bit of a sideways move, then you have another drop and then it bounces and has like a weird, you know, like bullish cycle. Then it rolls over again. Okay, just really burn this pattern into your brain for me for a moment and take a screenshot, use the slides, text newsome to one of those two numbers. If you need the slides, follow along with me. Look at this. I mean, do you not see the similarities? They're outstanding. I mean, this is an entirely different company on an entirely different time frame on an insanely different year. I mean, one is Macy's, the other is Lulu, one's on a weekly chart, one's on an hourly chart, one is the last five years and one is nine days ago. I mean, look at the sim, look at the similarities. You have this lower high that comes in, right, Assuming that it broke whatever trend line was happening over here. But you have this, you have this down move, you have this up move, and you have this lower high. So we're right about here. Now do you know it's lower high. Do you know what's gonna happen there? No, not really. You don't specifically know anything until this happens. Once it starts taking out that bullish candle and that bullish candle, which I know is a little bit hard to see, and I promise we'll do in more detail in just a second. But once you see all of those start breaking down, and more importantly, once this guy comes in, AKA the neckline of the double top, which we'll talk about in the next module. There's your double top, there's the retest, there's a continuation lower. And then in module five, we're going to talk about the, the get this really, really nice gap down that occurs right here. Did you see the price action? How the candle goes from here to here, trades up, hits old support, is new resistance, and starts rolling over. Kelly says, do you find all these phases on 15 or 5 minute charts? Yeah, of course. That's literally what we're talking about right now. That's, that's 100% this portion of the class, right? This is the hourly chart. So yeah, I promise it is there on the five minutes there on the one minute there on the 30 second chart. It's really quite amazing. So remember that pattern folks, how I said that we sold off, we had this really big sell off and then you had this weird looking double bottom thing and then we ended up going a little bit higher. You guys remember that this is the same exact pattern. This was, this was by sheer coincidence, I hope you know that. I was like, what stock should I look at on the hourly chart? I just look at Lulu. Pulled up Lulu and you get this exact same double bottom, two totally different time frames to totally different companies. It's insanely amazing to me. Just incredible. And then you have a player participation phase. It turns into a distribution phase. We trade sideways and we start breaking out again. And that was Lulu back at 220. Let's see what Lulu's doing right now. Lulu Limone. So that particular chart. Yep. So this, this, if I go back really quick, this was at 218:59. I had drawn it. That was in a public participation phase, which means based on my analysis, I would have expected to go higher. Did Lulu go higher again based on the public participation? This was at 218. So over here, I took that screenshot and yeah, nice move up. Nice little pullback. And I mean, it's at 224 now. So worst case, you buy 218, you're at 224, $6 a share. It's not too bad. Now, as granted, you could have sold out open today at 230 and made a lot more. But you, you get the point. Really interesting stuff, I like to say, I think. Now here's the big questions that all of you have. And I get that these are very valid questions to have. How do we determine if it's in an accumulation phase? How do you know if we're getting in a public participation phase? When do we get out of any of those traits? How do you know when a diversification distribution phase begins? How do you know if any phase is beginning? Doesn't matter which one it is. When do you get in? When do you get out? How long do you hold? When, why, how, where? My friends, if you can answer properly any of those questions, you can make as much money as you want. You can make as much money as you want. There is no end to how much money you can make. Do you want to make $100 million? $10 million? A billion dollars? $100 billion? You can do that. It's endless. Now, the cool part is you can answer these questions. They are answerable. They're just not answerable all the time with the exact same answer. The answers change. It's kind of like anything else in life that requires a two factor authentication, right? You have to change it. Update. There's answers, but the answers change. So it takes practice, takes permanent practice. It takes a lot of practice and takes a little bit more practice because the reason it takes so much practice. Quite simple. If you're gonna be a professional at anything and get paid to do anything, you're gonna have to spend a lot of time doing that thing. Example. And be honest with me right now. Could anyone go out and get paid $10,000 before Monday to play soccer? Anyone here? There might be someone here, might be a really good soccer player, I don't know. But can anyone here right now go out before Monday and get paid $10,000 to play soccer? I definitely cannot. Rob says I could get paid to stop playing because I'm that bad. This, the trading thing, this stock market thing thing, ladies and gentlemen, is very similar. It's a professional environment. If you want to make big money in short periods of time, you need to be a professional. You need to know what you're doing. If you're going to go to the NFL or any other MLB or NHL or any other professional athletic department, you're going to have to put in years to get paid millions in months. I'll repeat that again. You're gonna have to put in years to get paid millions in months. It's going to be that way. That's simply the flow. Now here's what can help. Candlesticks, volume support, resistance, wave counts can help. We're gonna talk about that practice. I'm gonna help you. Real life trainings and help you. Trading rooms can help you. Guidance can help you put yourself in front of people who have done this. Put yourself in front of people or around people who have become financially free or have made millions of dollars or don't have any debt, or travel the world, spend time with their family and friends, do whatever they want to do whenever they want to do it, who are totally financially free. Put yourself around those people so that you can grow through this whole process and become a little bit more closer to what you're trying to see. Now let's go do some more. Let's discuss all about this. Beat this, this little beast over here. So when we're talking about how does someone know when a distribution phase begins on any time frame you Generally have. And I know it's a little tough to see, but do you guys, Are you able to notice up there how we actually made a new high that failed pretty quickly? Can you guys call, kind of see that? So we made a new high that failed quickly. That's one really good sign. A new high that fails quickly. Now quickly. It depends on the time frame. So if it's a weekly chart, okay, it might take three or four weeks to fail. But a new high that fails quickly, very, very common sign that a distribution phase is going to begin. So something like this makes a high, comes back, makes a new high. Boom. When I see a pattern like that, I immediately begin to go, alright, here's a resistance line. Mer. And then I start watching for that. Resistance lines either hold or not hold. Now, true or false. I can still play a position. Bullish, get in down here and just ride it back up to there. True or false answer is of course, of course you can. But if it fails to make that new high and starts doing one of these, I go, oh man, oh man, this could be bad. This could be a lower high. Now what if it doesn't? What if it goes breaks out to the upside? Okay, I lose. I lost money. It's not in a long term distribution phase. Let me see if I can catch the next wave rotation. Remember one of those, right? Pretty clean, pretty obvious. And again, going back to it, let me just do this. What if it comes down here, purple line, and I get in bullish here and then it does one of these. I hope you guys are taking on these sound effects. Literally. This, this is what the stocks will do. What happens if that occurs? Okay, I lose money again. I lose on the trade for a second time. Then I go, so weird, man. And then I draw another resistance line and I go, all right, this is now a resistance potentially. And I try to find another spot where I can try to ride it up again to that level. And that process repeats itself over and over and over. You are going to be wrong in a distribution phase. That's the next step. Ready for this? Here we go. You will begin to be wrong a lot on your direction. So if I get into some trades directionally, let's say bullish or bet, you know, whatever the direction is. And I keep getting wrong two or three times in a row. I go, man, this must be some kind of weird distribution phase or accumulation phase. And so I kind of like take back a little bit. I start reassessing, I start waiting because a lot of you will go, oh, Let me just mentally figure this out. There has to be an answer. And the answer might be, just don't do anything for a little bit. Sit on soh. Sit on hands. Time to reassess. I will go.04 some trades before I just throw my hands up in the air and go, well, I'm just a moron. So let me just figure out what's gonna happen here. Russ says if I did just the opposite of how I trade the first six months, I'd have a new boat right now. Yeah, man, I hear that. Memoir says I'm doing that currently. Mark says, why did you want to go bullish in a downtrend? So, good question. You wouldn't have known it's a downtrend on this particular stock chart until about here somewhere is realistically answer. The other thing is, at some point, it depends on how big the downtrend is and depends on the time frame of the downtrend. So that's a very good question, Mark, because if this is an hourly chart, can this be four or five days of a downtrend on an hourly chart where the actual primary trend is extremely strong and the stock goes higher? And the answer is, obviously, you know, of course. Rob says, would you look at moving averages to determine if it's in the downtrend? You definitely can use moving averages. And we'll be talking about those in module four. Yep. Kelly says my entry is always a challenge. I'm too late to the party. Yeah, it's. It takes. It takes a lot of practice to not be late to the party. I don't like being late to the party either. I like fresh queso and cold beer. You know, I don't want to show up to the party. And it's just like those stale chips that no one likes. The bottom of the bag, you got a scrounge around. You got a bunch of, like, peanuts and eggs. Nobody wants those kind of parties. So when we're taking these types of trades, what has to happen is if you're going bullish, right? So let's say, for example, I'm trying to play a lululemon bullish here, and I lose. Okay. And then I take lululemon bullish here. What do you guys think? Could I win a little bit? The answer is probably. So I take it green and I lose. I take it in the black, and I win a little bit or I lose very small. Now, would I take it bullish here in the blue circle? And the answer is, it depends on the time frame. Probably not. Probably not. Because I can see at this point in time we have now began to make lower highs. I can clearly see that. So if you go. Well, Jeremy, so you're telling me that I should never go bullish before I get higher highs or higher lows? No, it's not what I'm saying. I'm simply saying if I think that a public participation phase is going to begin or I think a distribution phase might be over and we could be entering into a public participation phase, I'm going to try to wait. I'm going to try to wait to see if I can get some type of signal that can give me a little bit of insight that it might be over. What is this insight? One of the things I mentioned in the previous slides. Who wants to remember? Who wants to remind me besides the Trading Room and sign up for Real Life Trading and join us. Besides all those very soft subliminal sales pitches, what was the other thing that I mentioned on that chart? That black charts? I had some bullet points. Candlesticks. Yep, candlesticks. What else? There's one other thing. Wave counts. Yep, we're going to talk about that in the advanced section. And volume I mentioned Volume. Yes, that is correct, boys and girls. Volume. So what's special about this volume down here? Can you want to tell me? It's a big, bearish candle. Volume, huh? It's above average. Yep. Huge volumes coming in. When you get massive, massive volume that comes in towards the end of the move, that is often a sign that something is changing. Now what? Who's changing when you get met. So a lot of traders will say that's the time to take the breakout. And those traders don't last very long because they don't understand what we're teaching you tonight. If you're taking a breakout down there, you're getting hosed and you're massively wrong. Steve says if it's a big red candle, what do you think is gonna go down more? That's the exact point, Steve. No, because it's based on volume. If you see huge volume coming in at them at a massive low, at a big. After a big downtrend, that's the news piling on bearish. That's everyone freaking out. That's people who had the position and who had bought up here. Panic selling, let's call it a washout. Also known as a capitulation. Also as Jason's typing in cnbc. It's an exhaustive move. Everyone's finally getting on the bus and they're a little late to the party, right? The only beer at this party is Rolling Rock. And no one likes Rolling rock. Okay, so we're late. All that volume is coming in. John says so red volume candle means selling. It does. Yep. So here's what's really kind of cool about that. What type of candle? And we talked about this recently. What type of candle is that candle? That one right there is a high wave candle. Absolutely correct. So here's a question I hope all of you're gonna get right if you don't. It's okay. There's no penalty for getting it wrong. Would I have gone bullish above the high of that candle? Yes or no. And the answer is yes. Would I have most likely gotten stopped out on that position? Yes, I would probably over here. Most likely I would have gotten stopped out. So you're saying. Wait a minute. So Jeremy, you're telling me that you'd have lost on that trade? Uh huh. That is what I'm saying. Yeah, you're definitely correct. For sure. I would have lost on that trade. Almost without question. Well, dude, you're supposed to be the one teaching me how to make money. Why are you teaching me how to lose? Because you have to going to happen. You got to lose small. Because here's what's interesting. When I lost or when I would have lost on that trade. And this is a, this is an actual trade that I lost on, by the way. So it's really, really good. This is an actual. I lost. When this candle comes in, notice how that candle on lower volume closes above all of that bearish volume again. Do you guys see that? How it gets back above that level, how it takes out that price? Again, that is a very bullish signal. Now you might be saying, okay, Jeremy, you said yesterday if a big candle like that comes in, where are you gonna get in? And I mentioned yesterday I'm gonna get in about halfway point, 50%. So ladies and gentlemen, you tell me, did I get in on that candle? No. Why not? Because I follow my rules. How often? All the time. But Jeremy. So are you telling me that sometimes you'll take a trade, get stopped out, try to get back into the trade and then miss the trade? Yeah, like on the reg. Okay, quite often. So when did you get into the trade, bro ciflini, bro B1 Kenobi. When did you get in? The answer is when this resistance, when we broke above that resistance, we had tons and tons of white candles. So I played the retest of that resistance and bought here. Now what do you think? Did I Put my stop down here. And the answer is no, because that's where I would have gotten in. One trader says, what makes that candle so big? A lot of buying. That's it. That's the answer. So even though when this candle came in. Yep. I set up an entry and I did not get filled in, I have one trader saying there is no volume. Yeah, that's okay. It's a massive common misconception that has to have a lot of volume for a stock to go up. That's incorrect. Put you this way. I'll give you an example. I don't know how to pronounce your name, so I'm just going to call you C. All right, C. Let's say you want to buy my house. You and trader L. There's two people that want to buy my house, and trader L has been trading with me for a long time. They think my house has good juju. So they want to buy it for 1.4. But you see, are brand new. You don't know me, you don't like me, you don't care, and you want to buy my house at actual market value. Who am I going to sell it to? Sell it to person L at a higher price. So that's how it works. If there's not a lot of sellers and there's a lot of demand, what does the market have to do in order to find sellers, ladies and gentlemen, has to increase. The price has to go up. So can stocks go up on lower volume? Of course. It's a massive common misconception that stocks have to go up on big volume. And you should only get in when big volume comes in. I get in when big volume gets taken out because I'm smart and I want to help you all be smart money. When big volume gets taken out is when you get into trades, not the other way around. Because by the time big volume comes in like this, type in A9. If you saw that volume, by the time that volume comes in, who's a little bit late to the party? And the answer is, you are. You're a little bit late. I'm selling to you. Type in a nine. That just absolutely blow your mind. Because so many people get that part wrong in trading. It's not your fault, it's their fault. They teach you bad stuff. This is the right way to play it. Now, does that mean it's gonna always work? No. Right? It does not. I wish it did, but it doesn't. So this particular trade, you're right. You had to play the Retest. Even though I want to get in the pullback and I didn't, Trader C says, why confirm trades with volume? I mentioned that you want to trade. I didn't mention what type of volume. And I also didn't mention the word confirm. Very first class module one. The only thing you can confirm is what? The only thing that can be confirmed is the trend. It's the only thing that can be confirmed. Once you have the trends, you have to play the trend. So if you have a bunch of people who have a confirmed hourly bearish trend and those traders start getting trapped and the stock starts going the opposite direction on lower volume, how do you think they're gonna feel? Mad? A worried? Upset? Frustrated? Annoyed. So take advantage of that and buy as the stock goes up. So I don't look for volume to confirm my trades. I look for the volume to confirm against other traders. Terrell says, would you consider a good volume or what type of volume do you look for? Honestly, man, anything over a hundred thousand is. I mean, it's fine. So that answers your question, Charlie. Anything over 100,000 is. You're not gonna have a problem getting in and getting out with shares. Realistically, if I'm day trading it, I really would like a 500,000 volume minimum. If I'm day trading it, if I am going to trade options on it, I like it to have 3 million or more. And that's all on the daily chart. John says, is that called a short squeeze? Yes. Short squeeze is where a bunch of bear traders get trapped on a position and the stock starts going up. Mm. So that's what I look for. Sean says, where did you put your stop on that retest? I put my stop below the previous move. So when I got in on the retest here on that pullback, I put my stop below the low of the massive bullish candle. Because remember, massive bullish candle are strong supports. Steve says that's a huge stop loss. Yeah, it was indeed. I don't know what to tell you, man. Worked out really well though. So with the R strategy, Steve, it doesn't really matter how big your stop loss is. Your risk is going to be the exact same. Your risk is always the same, no matter the position. So again, through here, I'll kind of just go back to where we were. Steve. Steve was saying Newsom. Steve was mentioning Newsom. That's a really, really large stop. You know, if your entry is here and your stops down there. And the answer is that is correct. That is true. It was a large stop but when you trade the R units, the R system, it doesn't really matter how large your stop is. And it's on an hourly chart. So it looks large, but it's not really that large. On $150 stock, it was 20 points. And obviously you can see, Steve, that the stock did really well after that trading really, really nicely. So type in A16 into the chat pane. If you can see where this distribution phase on the hourly chart began, I'll kind of draw it out for you. The distribution phase began right here. That's what you guys are looking at. I would not have known until that point that the distribution phase was in. This would have been just hooray. I'm the greatest trader in the world. And I start singing that song. I'm the greatest trader in the world. And anytime you start singing that song, by the way, just sell everything. It's easier, more profitable because you're not. And you're wrong. I'm the greatest trader in the world. Open up your account, click Sell all. That's the way that works. So right there in the green little blob that I have on the screen, that's where that really became the distribution phase. And that's when you start going, okay, we could continue to trade sideways for a while and approach it from there. Rob says, when drawing in your support resistance, how far do you go back to determine your stop? Rob says, when drawing in your support resistance lines, how far do you look at? How far do you go back to look at support to determine your stop? If I'm getting into a trade right now, it's just then whatever's happening most recently, I don't really go back that much farther. So let's just, let's go look at an example. Let's go pull up, I don't know, Carnival Cruise Lines. That's one that I have a position in. So let's go look at Carnival. And if I'm on Carnival really quick. So again, it depends on the time frame, obviously, right? If it's a 5 minute or 15 minute whatever time frame it is, because it does obviously change. But if we're going to go look at the daily chart and we do the one day. So just as an example, this is Carnival on the daily chart right here. And let's say for example, that you're gonna get in bullish tomorrow, you would just use your, your stop loss would probably go right there somewhere. You know, stop loss can be the green line. I mean, if you're really, really conservative, it could Be at the red line. Ladies and gentlemen, true or false. In stocks that are extremely beat up in this current recession that we're getting in the market, could you buy some stocks and set your stop loss at zero? So worst case, you only lose your 1R of risk. Could you do that? And the answer is absolutely right. So let's say your R happens to be, I don't know, a thousand and you go, okay, cool. Carnival is at $14 a share. Could you take a thousand and divide it by 14 and come up with the amount of shares to buy and then just do an absolute zero on the stock trade? Is that possible? And the answer is, of course. And you'd come up with 71 shares. Steve says, wow, never thought of that. There you go, man. That's worth the class. That's worth the price of the class by itself. Russ says, unlike oil, this cannot go negative. That is correct. That is 100% correct. Amy says mind blown. Yeah, awesome. So these really depressed companies, you can do things like that. And I have been, by the way, I do have a position on Carnival. Spirit Airlines is another one I'm doing the same thing with. This is not a totally accurate chart on Spirit Airlines. Let me just pop back over to trading view. I need better data on wealth jars. I'm working on getting that. But spirit Airlines is $14 a share. Right? So you do the exact same thing pin national gaming. I mean the easiest thing in the world to buy around five, six, seven dollars. Your stop could have been zero. So you guys kind of get the point. You can do that. It's definitely doable, it's possible, it's plausible, all those adjectives. Now the reason I'm bringing that up is because that's the risk. That's the goal of understanding how much you're gonna make or lose on a particular trade. So when we were looking at Macy's here, even without looking at volume, type in A9. If you can see the new high, that failed immediately. So when I say failed, I mean makes a new high. And then we take out that candle very quickly, extremely fast. By the way, that's what happened during the whole Covid incident. Markets make new all time highs. You're like, no, it didn't, Jeremy. All right, that's cool. Let me go show you. You're right. I shouldn't just say random things. Here's the weekly chart on the markets. Let me just hide all this for a moment. Here's the weekly chart on the markets. Did we make a new all time high? Sorry, not even new all time high. We did. We did. But did we make a new high and then quickly get rejected? And the answer is yes. How long did it take? Two weeks. And it. And it happens with a gap. It happened with a gap. So not only did it just randomly happen, it also gaps down. It's kind of wild. So we're talking about that. That's kind of what that means, is when you make that new high and you get immediately taken out, you really, really start taking note of that. Or if it makes a lower high and immediately gets taken out, AKA back over here. Or notice again, when the market, right when it's doing this, we trade higher, we come down, we make a new high relative to that, and then we immediately lose that lower high. Again, very frequent. Can really occur if. Now here's what you're going to. Here's what you're going to. The argument that you're going to get about this current bullish market. Well, let me rephrase. I'm sorry, I mean, I don't mean market. Here's what you're going to get about the current bull move that we're experiencing. If anyone says, but we're going up with lower volume, don't listen to that person. They do not know anything about charts or trading or money. Okay? Simple as that. I'm not saying the market can't go lower. It can. I'm just simply saying that the volume going down is not the only predecessor that's gonna be a requirement for this happening. Stocks can absolutely 100% go higher on lower volume. So here's the monthly chart. You know how many people. And Jason, I'm sure you know these people. You know how many people said that the market was gonna go lower back in 2011, 2012, 2013, because the volume was declining? I was like, this doesn't make any sense though. Prices can go up with higher volume. And the person's like, yep, but it's a bubble. And it's gonna be a bubble. Can't go up with higher. With lower volume. I'm like, really? Because I feel like when everyone rushes in and there's tons and tons of volume, then it's a problem that then it's an issue. AKA also known as this guy, type in a 9. If you're wigging out right now and you think this is the coolest thing of all time. Look at this volume. That was two. That was the predecessor of 2008. Look at that humongous volume spike. All right, ladies and gentlemen, volume. When everyone Is doing it, then it's a problem. Then you're like, I don't know, man. So check. I mean, this is so fascinating to me. I love this stuff. Look at the 2009 crash volume, and look at how well we interacted with that volume. Huge, huge, huge volume. And all we did the whole time is go higher with less volume. Look at the volume decline. Just let me do a different color because not the greatest of colors. So volumes going down, volume going down. And then when we get above that candle, what happens? Who's going long here? And the answer is all the people that said, yeah, the way you make money is in a. Whatever trend is when it takes out the highs of these candles, that's when you get in. You can, if you really want to, you know, like, if you want to wait all the way up until that resistance, but you want to get it up there, because at that point, you got to buy the pullback because it's already made its move. It's already done this. So those of you who are getting in too late, that's because you're buying up here, also type in a 6 if you can see that that's a new high that gets failed immediately. Now, that's on a monthly chart. But again, it's the same principle. So what am I trying to say? I'm trying to say I do not buy very frequently on new highs. I'm not talking about, like, this type of new high, okay, when you have tons and tons of room to go higher. I'm talking about new highs like this, when you've already made strong movements when you do something like this. I'm not gonna buy up here. At least again, I've done it before, right? I've lost all the monies with the best of them. I've definitely taken my lumps. I've learned some lessons, but we can learn from them together. Beautiful. So as we're reviewing these charts, as we're talking through, it's the same principle. Same thing applies. If I'm trying to go bullish down here and I'm playing that double bottom, could I. Could I have made money? And the answer is, yeah, could be a little bit of money. Where would I have sold? I don't know. New highs, where all the noobs are going bullish. Okay, cool. So I'll sell there now. Do you think I would have gone long here at the Black Arrow? Yes or no? What do you all think? Am I going long at the Black Arrow? The answer is, yeah, of course I am. Yeah, because it, because it worked previously. And if I get in there, did I lose a little bit of money? The answer is, obviously, so I'm wrong immediately. But then when I get stopped out and I'm wrong immediately, what did I say yesterday about being wrong immediately? Or in the most recent module, if you're not here live. Exactly. You begin to flip or you begin to change your perspective, or you begin to figure out, okay, if I'm wrong immediately, let me do something else. Let me change my perspective and change my ulterior thought process and motive. And then on this trade, did old support become a new resistance? Yes or no? And the answer is yes. And by that point, where I go, yep, we're not going to bounce. I'm obviously losing. Could I have, at that point in time noticed the lower highs, noticed the lower lows, and made a little bit of the money on the downside to recapture my previous loss? And the answer is yes. Pretty cool stuff. And over here, right as we're going through it, do you think that there's a chance that one could have been bullish somewhere in this blue circle and made a little bit of money on the upside, and then they had a target of this resistance, and they didn't actually quite hit that resistance, and then they ended up getting what's called trailed out to make only a little bit of money or maybe break even? Would that have been possible? And I would say absolutely right. Very, very likely that could have occurred. But once that level comes in, they would have been able to notice lower highs or you got a high, you got a lower high, you got a lower high, you got a lower high, they would be able to notice that, hopefully. So until we start breaking out of that high, until we start at some point making higher highs and higher lows, I'm going to be looking at taking the trade bearish, because at some level, on some time frame, you do have to begin to make higher highs to start going bullish. Now, some of you might be thinking, all right, Jeremy, that's cool and all, but you just said the market, right. Is not making higher highs yet. So. And you also said to not go bullish when it does make a new high. So how will you know to be in bullish? It's a very good point. So this is a monthly chart, ladies and gentlemen. If I'm looking at this chart, what is the trend up? That is correct. We are making higher highs and we're making higher lows. This is not a higher low, but it is a potential lower shadow so it could just be a trap. Doesn't have to be. Cause you'll notice it did not close. Can you see that massive lower wick? Right? That massive lower wick in March told me and I told everyone I could all real life trading. I was like, guys, I'm bullish, so we gotta be bullish here. April, it's gotta be long because that's a trap. It's a massive, massive lower shadow. We did not close. We did not. If you're gonna say the word confirm, if you're gonna trade, change trends, you gotta get closes to make lower lows and lower highs. Now at this point, am I gonna create some type of level at some timeframe where I'll go, okay, guys, until we break this trend, we can be a little skeptical. So if we do this and we do this and we do this and we do this and we do this, can I begin to get a little skeptical at that point? And the answer is yes, absolutely. Now, I hope you all answer this question correctly. If that occurs, will I look to go long down here in the green circle? And the answer is yes, I will. And one of two things will happen. I will either begin to lose on the trade or it will trade back up to that lower, high level. And then I can sell. Let me try to do that. The same color. And then I can sell and lock in some gains, or I can see if it can hold and break through that trend line. And if it doesn't break through that trend line again, then I can continue to be a little sketchy and little skeptical. But if we do at some point break through that trend line, I go, okay, we're now making higher lows and higher highs on whatever timeframe that would be. Let's go. So the challenge with trend reversals, we're gonna talk about that a little bit in class five. Module five is, realistically, it's going to take a lot, a lot longer than a lot of people want to. So those are some personal real life examples. Let's go do a few more. Go ahead and throw some charts at me what some stocks that you guys want to review. First one will get it. Whoever types it in first. I'll look at that one. Uber. So Uber is very interesting because Uber right now is in lower highs and lower lows. Type in A3 if you would agree. Uber is brand new. So as I mentioned earlier, brand new companies, those are the ones that if you're going to make any kind of big, sizable investment in any kind of massive, massive return, it's going to have to be a little bit of a newer company. Uber is a newer company and it is making lower lows. Lower highs presently. But what's one thing that kind of jumps out at you on this particular trade now? I'd have to say that volume, that high wave candle and the fact that we closed above it and then retested it and then bounced, that's a little bit interesting to me. So now what I'm going to be doing personally on Uber is I'm a create another trend that looks like this. And there's all kinds of things are gonna happen here on Uber. But if we do something like this where we trade down into this trend line and we trade down to that support and that support breaks and that trend line breaks, do I have a direction that I could take that trade in and answer is, yes, I do. But if it pulls back into that support, what will I initially look to do? Go long. Exactly. As it pulls down to that level, I'll look to go long. But what if it doesn't bounce? Then I lose. What if it doesn't bounce immediately and I lose very quickly? Then I'm gonna look to flip and consider going bearish. And what if both of those don't work? Then I'm gonna go over two and how many times can I try it again before I throw my computer out the window and go, all right, well, let me, let me try to figure this out. I have two more shots, right? If I'm just wrong four times in a row, I call up, bro Shed Williams, AKA Woodshed Williams, AKA Philip Williams, and I go, hey, man, you wanna, you wanna grab a beer and cry about it? And Phil, like, yeah, man, sure. Let's just, let's just tear it up. Let's put on some Hank Williams, tear my beer, and we'll figure this out together. Because that's the thing. Then you start talking about it, then you start researching. Then you start asking and pouring over and looking at some fundamentals, reading some news stories, you put a little bit more time to figure out what's happening. You normally wait and then you figure it out. I'm trying to think the last time I did go over four on a particular stock, I'm sure I'll think of one in just a moment. Oh, yeah, there you go. Dropbox. Someone put it in the chat pane. Dropbox can't trade this stock to save my life, apparently. So how many times have I tried to play Dropbox? Let's figure this out. Let's see Dropbox. All right. Just a nice little glimpse into Newsomville. So support right there. Resistance there. Now it looks really easy. I agree. Looks really, really clean right now. But the time I played Dropbox Bullish, trying to think of the exact I could go back and look at my trades. I haven't played Dropbox in a little bit. Last time I tried to buy, it was right here with that volume. Came in, lost on that trade, then got back in Bullish. Made a little bit back, but didn't hold long enough because we did eventually close above the high of that candle. Let me kind of zoom in just a little bit. Give me a second so you can see this. A little bit more. There we go. Okay. So all the volume comes in at the bottom. So I tried to go long down here. Did that work, boys and girls? No, it did not. So I lost. Took it long. Okay. Got in long, went up a little bit. I was like, oh, cool. Let me get out for a little bit more than I made. So got out of the trade. One a little bit more. Then we close above this ginormous, bearish candle. Right. With all that volume, Did I go bullish there? No, I never go bullish on new highs. Come on. So I bought the retest. Did that work? So I bought the pullback. Did that work? No, it did not. Nope. So I lost on that trade, and I was like, okay, cool. Well, I'll just. I'll just buy again the exact same price I bought last time. So I bought over here. Did that trade work out? No, it did not. I got whipsawed out right there. It's all coming back to me. So now I'm over three. I'm like, okay, that's fun. So the stock starts to bounce up in this area, and I don't take it because earnings is right around the corner. Earnings comes out, and I don't do anything with earnings. Don't do anything with earnings. I wait. I wait. I wait. And then I short it when that candle comes in. Right. So I shorted right there with a close below that support. And as William says so perfectly mentions, I'm getting in at that level. So I short with that bearish candle. And you can see the little upper shadow right there. Boink. I got stopped out. Went over four. And then what happens? Now? It rolled down, and I actually would have won Fun times. So I went over four on Dropbox. I was like, well, I'm just gonna leave Dropbox alone for a while, and I haven't traded since. And this is what it's doing now. So, William, Mr. Supply Level, what would you do on Dropbox? Mr. You bought a support bought at resistance. Here's some support resistance on Dropbox. Richie says you could run. Yep. Again, earnings is right around the corner. So earnings is around the corner. So at this point I'd either buy it down here or if it gapped up on earnings. If it gaps up on earnings, it probably will actually gap up on earnings. I think. I think Dropbox is gonna do pretty well on earnings this time. Lot of people moving to different companies, a lot of people, you know, away from their offices, virtual offices, so on and so forth. Probably tons of subscriptions coming in. Plus you got like, it's weird looking double bottom and you've taken out Covid highs. So I think Dropbox actually can probably do pre roll on earnings. Most likely gap up, trade down and then you could buy off of old resistance, new support, probably. What's going to happen, Alex, is wait until after earnings, typically. Yes. Yep. I generally wait until after earnings to take swing trades. That is correct. At least if I know they're coming. Mary wants me to look at Boeing earnings and Boeing is. What was it doing after hours? Has it already had earnings? Not yet. I think it's in the morning. If Boeing gaps up on earnings is most likely going to fade down because it's very blue chip and it's going to be really obvious. So I don't see Boeing. I give it Boeing gaps up here. It'd be such an obvious, obvious, obvious gap and go that likely. It's going to run up. All the noobs are going to buy and it's going to fade back down and then go higher. It's probably what happens because I mean, just such a, such an obvious, obvious gap. Most likely I would prefer Boeing to gap down some, trade back down, make a new low into the $80 price range and then go long. That would be a preference. I would like that a lot. But we'll see. Again, if we were going to look at Covid stuff, let's just go look at a weekly chart on Boeing and do we see some warning signals? So you get this gap down? Okay. It's not really the biggest massive warning signal, but it is a little bit. Okay, so we come up, we fail to make a new high. We fail to make a new high. We fail to make a new high. We fail to make a new high. So what's happening at that point, my friends? The resistance of 372 is holding. What resistance is holding? This one over here, that one is holding. So then you have a support at 311. And what happens when Boeing, on a weekly chart, closes below all levels of support, finally makes all those lower highs, the distribution phase breaks down and it turned into what type of phase? Public participation phase. Richie says, why wouldn't you call that a new high for that time frame? This one? That. That high? Richard says, yes, because it's literally lower then right there. That is why, my friends, it's literally a lower high. Yeah. So if this was a public participation phase on Boeing, which it was, what phase are we in right now on Boeing? Mason, you have to watch the recording, my friend, because you were late. All right? Now we are in an accumulation phase. That is correct. We are now in accumulation phase on Boeing. So what does that mean again? So if we're playing it, Mason says, yes, indeed I was. We're in an accumulation phase. So John says, can it go lower? Of course, it probably will go a little bit lower at some point. John. That's what I mentioned about accumulation phases, right? Accumulation phases do what? They take a while. They take a long time to occur. They're very choppy, they're very sideways, they're very boring. John says, blow the low. Of course I want that to happen. I just said that a moment ago. I would love for Boeing to do this. That would be amazing. Because then some real capitulation could come in. Because right now we're getting massive, massive buying volume, and there's a bunch of noobs who think they know how to time the market. I just don't think they're right. So I'd really like to see a massive, bearish volume spike on some kind of time frame. Then I know the bottom is in. Not saying it can't happen, but it hasn't happened yet. So I'm looking for a really nice, bearish volume spike on Boeing. And then I'll start knowing that the low is probably in once all the noobs start shorting it down here. Does that make sense, guys? So Boeing, is this a stock that is in accumulation phase right now? The answer is yes. People are gonna be watching this video five years from now, and Boeing most likely will be higher than it is on this recording. It's gonna be ugly, it's gonna be choppy, it's gonna be gross. But it'll most likely make its way back to 200, 240. It's just gonna take some time for that to occur. Robert says, and then they will all say, why did we not buy it back then. That's correct. Richie says, does red volume mean that shorting actions happening? That is correct. William says, can you scroll back to see what the price action did before the recent low? You mean over here, William? I'm not sure what you mean. Like back in. Back in this day. Yeah, there you go. So by the way, check out all the bearish volume. Type in it. Type in a 9. If that was just. That's just the best part of the whole class. Look at that. Massive, massive, bearish volume. That's when all the people that taught you all the wrong things. That's when you guys are shorting and I'm going along and I'm going to wreck you. And I love you guys, but you're just. You totally time that incorrectly. The move had already happened. That's where I'm selling puts, buying calls, buying shares. And I'm betting against you. Anoir says red is bearish volume. That is correct. You are 100% accurate. Yep. And if you get all the bears in one place doing the same thing at the same time with massive, massive force, who else is left to sell short? And there you go. So you have a lot of people who are getting exhausted. Right. Sellers can become buyers. Sellers start giving up. They start losing profit. They start realizing that you have massive, massive fluctuations. And they start changing and shifting models. So, ladies and gentlemen, that's our time for tonight. I know you're loving us. I know you're excited. I know you're all fired up. Type of 10 if you're loving this stuff. Whoo. See some tims. Yeah. Really great. Now remember, this is entirely free. I hope you realize that you didn't pay anything to be here. At least I'm pretty sure you didn't. And then if you want to, let me know, man, because this course could have been a lot of money. So do this for me. Tell all of your friends. Share this on Facebook. Share it on YouTube, share it anywhere you want to share it, because I'm doing it again tomorrow and the next day and then the next day more is coming. Steve. Yes. This is only module two of five. This is it. So any questions, my friends, while we're here? GI Bro. GI Bro says, how many more miles do I have to do? I have to do a half marathon again tonight. So I've gotten 15 down, 13 to go. Richie says that's it. Yeah, man. Easy. John says 5. 5, 4. 4, 4 did not work tonight. You're correct, John. At the beginning of class, I shared the slide for all The Canadians to text that number two. That was at the beginning. Rob says, do you carb load? No, I can. I know how, but I don't. I do like carb loading. It is delicious. Manoir says, I'll make you some good curry. I love Indian food so much. I'm such a fan. Alex says, I was just introduced to your programs. I'm so glad. They're new live classes. Yeah. Thanks for being here. I appreciate it. Lottie says, do you have a 30 day trial on live trading? No, I do not. I do not. Mason said, should I come to the retreat? Of course. Yeah, definitely. William says, can I call you to talk about the retreat? I mean, let's just ask some questions now. What questions you guys have? What questions you have about the retreat? I mean, you can call me if it's absolutely necessary. I talk to people all the time. Santiago says, do you use Elliott waves? Yes, I do. Absolutely. I'll let Matt answer John's question about the phone number. Steve says, jeremy called me swoon. That is correct. William says, what happens if we can't travel due to the virus? I'll just refund you, man. You know, it's real simple. Like if we. If we try to do it and we can't do it, I'll just, you know, everyone will get refunded. It's not a big deal. It's all good. So if you guys do want to come to this retreat, I think you should. It's a really spectacular time and actually it's quite well priced, I think the whole. This whole. I mean, 1295. And guys, guess how long it's going to be? Any guess? Any guess how long this is? Five days. Five per. Yeah. Per person. Yeah, of course, but five days? I mean, come on. Like, I saw courses that are that much. Is the air included? Be honest, man. What do you think? Let's be real. Do you think that includes flights? No, no, I'm not gonna make any money if I have to spend $12.95. I have to buy the hotel and then I have to pay for people's flights. Come on, man. Yeah. So no, it doesn't include flights. I appreciate you asking though, but no, you got to pay for the flights. The good news is flights are cheap. Ladies and gentlemen, flights are super cheap. Get your tickets. If you want to come to this, you should. I know each one of these people by name. I love all of them. They're phenomenal people. JL is in class right now. Felicia Jones is one of the greatest traders I'VE ever met in my life and I am not exaggerating. This is her daughter, Shayla. This is Greg Gilbert. He is an absolute stud. This is Allen, this is Dr. Phil, this is Linnea. And this is Thomas Wong. I know everyone by name. Ladies and gentlemen. Get here if you want to do it. There is food and booze included. Yes, someone was asking in the chat pane. There is food and booze included in this. So if you, if you stay at the hotel, it's $123 a night and you get free. It comes with breakfast, it comes with snacks, it comes with beer, wine at night. It's all kinds of good stuff. No, no. So alcohol, you get three adult drinks at night, 5:30 to 7:00pm so again, I'm not trying to pitch you guys. If you want to come, it's going to sell out regardless of how many of you guys buy it tonight. I would love if you do buy it right now, but you by no means have to. That was not the point of this course. You guys were asking, so I figured I would talk to you and say, hey, you know, here you go. But Mason says, what about youngins like me? Yeah, it's the same price still. But if you text me, Mason, we can, we can maybe figure out something else because you can't drink, right? You're only 21, so you'll have to drink soda. You're gonna have to get some, some. Some Mountain Dew, man. I'm sorry. I didn't make the rules about the 21 year old thing, you know, so. It's too funny. Cameron says you can have a kitty cocktail with me. Exactly. Yep. Ladies and gentlemen, seriously, I really appreciate you all being here. If you are watching this after this is already expired still come to our website. You can click on live trading. If you guys do want to trade with me at any point in time, you can. Morning room. I had the afternoon room. I finished the afternoon room 40 minutes before I came up for this program. So I want you guys all to know, for those of you who are unaware, I did a class 40 minutes before I did this one for another hour. It was like an hour and 15 minutes long. I did that and then I did this. And then I'm about to go run a half marathon. I want you guys to be profitable. I want you to enrich lives. I want you to be incredible. I want you to leave a legacy. And we can help you. I can help you. I want to assist you. I am here for you. I'm here for the world. My goal, my mission is to enrich lives with mentally liberating education. I hope I did that for you tonight, today, this afternoon, wherever you are in the world. Thank you so much. And until next time, love life, live life and trade it. You guys rock. Bye.