How to use Elliott Wave and Fibs: Real Life Trading Advanced Trading Class #5
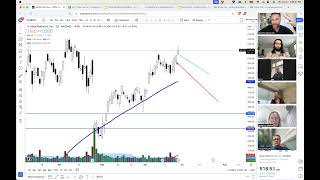
Jeremy Newsome teaches Elliott Wave and Fibonacci analysis with live trading examples in Roku, Twilio, Lulu, Boeing, Netflix, and SPY. He shows how to use simplified wave counts and Fibonacci extensions to set up calls, put sales, and spreads across multiple timeframes.
Chapters
Live from Music City, Nashville, Tennessee, this is your motivational, sensational, inspirational, educational, aspirational, international keenly awaited, highly anticipated edition of the advanced training series program brought to you by Real Life Trading module number five. Traders, friends, family, fans, followers from around the entire world. How are each and every. What have you doing on this terrific day or night, depending on where you're at? Maybe it's morning or evening or lunchtime special. Edwards is long time no see. I know, man. It's been like what, 50 minutes? Oh, my goodness. Lucas says super good day for stocks. Yes. For those who are listening, I'm going to be more energized and excited than normal because today, good chance. Today was the most profitable day of RLT's history. Mostly because we have a lot of traders participating in this exceptionally bullish market that we are getting right now. So it's been a lot of fun. We had a trader hit the dos comma club, got a new millionaire to welcome to the fold. So that was exciting. Always love getting that message on my text message on my phone. So some beautiful, beautiful stuff. Beautiful and exciting times. All right, my friends, well, here's what we got going on. You know our mission and that's what's exciting about this company. I think all of you know our mission and our mission is to enrich lives. We do that by guiding many people towards fully achieving and understanding financial freedom. Hi, folks. My name is Jeremy Alexander Newsom, and I am financially free. Nice to meet you. So excited to say that always I want to help people get there. That doesn't mean that I buy everything, but it means I can if I want to. If I want to buy something, I can buy it. It's not really that stressful, but I want to help each and every one of you understand it. It can be buying, it could be giving, it can be understanding, it could be having the possibility. Maybe it's not there right now for you, but it's something that can happen towards the end of the class. I'll tell you guys a really cool story about someone I've worked with and being able to see how that person can improve and grow over life and the steps that we can take to really figure out the things that we want to accomplish in life. I do have a new book out on Amazon, the Naked Trader. Some people already like it. Few of you already snagged it. So if you want to snag it, and I think a few people are taking it a little too seriously. This is supposed to be Photoshopped. Yes, that is not my body and that is not the 75 year old Michael Thompson. That's not his body either. We know that I wanted to make like an okay Photoshop and it's supposed to be the whole book is a little bit of a joke, but also good information. So you know, it's tongue in cheek the whole thing. But anyway, really good, really sarcastic, but a lot of useful information in that book and already some people are using some of the strategies, tips and tricks in that book to clean house. Recently Robin says I've been enjoying it. Well, thank you Ms. Techle. I appreciate that. The goal of this module is discussing Elliott Wave and Fibonacci analysis and reviewing where we've been. If you have your notebooks, get them out. If you're writing them, getting them out, or if you have a cellular device, I'll give you the phone number that you can use to get contacted and get ahold of me and I'll be more than happy and thrilled to ensure that you get a copy of these slides. I use Fibonacci analysis when I'm trying to find some targets at an all time high. The best $100 I've ever spent on something is TSA Precheck. If you don't have TSA PreCheck, please get it. It just makes sense. Even if you fly once a year, it is worth the hundred dollars in my opinion. Back in college I had a radio show called the Crock Pot. Shout out to Michael White if you're around and listening or watching. He was my co host. And last but not least, I try to meal prep on weekends to prepare for the upcoming week. So today I made sausage and asparagus, right? Friday afternoon, so I made sausage, asparagus and tomorrow I'll be making a little meal prep. Sunday I'll make a little meal prep. I also had someone ask me as long as I've ever gone without sleep. It's a fun question. Longest I've ever gone without sleep was 96 hours. And that was natural, sheer natural, just flaming energy. It was from a It's a very quick story Thursday to a Monday night. And I went to sleep Monday night thinking I was going to have an alarm that was going to wake me up Tuesday morning for work. I woke up, went to work. When the alarm went off, I was at work, got to work, almost got fired, couldn't figure out why. Everyone was mad at me. Everyone was mad at me because it was Wednesday. I slept through Tuesday. The whole day. I slept through Tuesday with the alarm going off. When I woke up Wednesday morning, I thought the alarm was going off for Tuesday morning. It was a really weird day for me. But anyway, so right now I can go about 31 hours with no sleep. The most recent I've gone was a year ago when I was doing an event called 29029, which is Everesting and I went 30 hours before taking an hour nap. So anyway, just a little random thing. All right, so if you want any of these slides because I will be going relatively rapidly, you can text Newsom to these two numbers if you want access to these slides. Matt DeLong says true story. I was there. Yeah, 29 029. So excited about that coming up again next year. All right, my friends, Module one we've talked about put sales and credit spreads. Module two, what are calendar how to implement the Module three was earning calendar Earning strategies, Iron Condor Straddle strangles and gaps. Module four was long term investing and module five we're gonna talk about Elliott Wave Fibonacci analysis. We're recap, we're doing some quizzes, we're gonna Q and A and then I'll tell everyone a little bit of a story and we will pack you on. Let's do a recap from module 4, which by the way was pretty much everyone's favorite class of the entire series. And you can thank Matt DeLonge for that. It was his idea to include all that content in the advanced series. So thank you Matt DeLonge. And naturally it was everyone's favorite program because Matt built it. So generally if someone likes something that RLT does, it's probably because Matt did it and I'm just here, I'm just the dude. Matt does everything and I just, I just speak Roku. You should probably buy some, accumulate it long term, fastly. You should probably tiptoe in and buy some accumulate some over long term. Ayx, you should probably buy some accumulate some over the long term. Lvgo you could probably also consider buying some solely over the long term. And Pinterest Pinterest was very very nice today. Had a nice little move on Pinterest. I do have some Pinterest positions still and could consider buying some Pinterest as well. Accumulate over the long term. And Shopify is still not too expensive. It can get more expensive and it will this will absolutely hit $1,000 unquestionably at this point. Mongo database also not that expensive. Mean it's pricey but it'll continue to get more pricey over time. So again you can own some longer term accumulate. And that was the recap of module 4. Here's a recap of module 3 which was earning strategies. We talked about the strata which is buying another money option for both to call in the put. This will cost you money. Examples buying $23 June call the $23 June put. Why? Because it's not my gap at some point. It's not gaps up per the amount that you bought it for. You can make money. We also talked about something called the strangle. Strangle is out of the money both puts and calls. This will cost you money as well. The example was buying a $27 June call. Buying a $20 June put because the stock could gap at some point. We also discussed in module three the straddle versus strangle why one is better versus the other and why you might choose one versus the other. We also discussed something called a bull put spread. We talked about that in Module 2 and talked about how you can implement that over earnings if you don't think a stock is going to gap extremely well far down. And we also talked about the bear call spread. Bear call spread is a option program where you can sell a call and buy a call higher. Now I actually a little bit of a secret hint. I love love love love this strategy so much. If I own shares over earnings, if I own shares 100 shares or more and I want to bring in some premium but also not cap my upside, I'll get into a bear call spread over earnings if I have shares. That's a little bit of a secret tip. Also the Iron Condors redo both of them bull put spreads and bear call spreads. What's cool about Iron Condor is one of those size is guaranteed to win and I like guaranteed wins. The broker knows this so no additional margin will be used. And that's the recap. Here's the recap of module 2. Module 2 we talked about the calendar Bull call spread, the diagonal bull call spread the diagonal long call and the poor man's covered call. Examples buying to open a long term call option. Example buying a 160 call option expiring two years and selling to open a short term call. An example be selling to open a 180 call expiring in June. We talked about this on Apple went through the background and how you could be looking at playing this one Long call diagonals AKA poor man Covered call AKA diagonal Bull call spread is a debit spread. It will cost you money and you're duty an option approval to do that. And that trade worked out. Here's how I trade long call diagonals. I generally buy out of the money calls on stocks that are in strong uptrends. I often buy as long as I can at support. I usually wait two, three months. And the call I sell is always above some resistance. And it's generally a place I do not think the stock will go. All right, here's recap of Module 1. We talked about call options. We talked about put options. We talk about call options are bullish. If you want stock to go up, you can buy calls. If you want to make money as the stock goes up, you can sell puts. If you want to make money when a stock goes down, you can buy puts or you can sell calls. My second favorite strategy of all time is selling puts. It's extremely simple. You are selling the right to buy the stock at a lower price. Selling puts as the exact same risk profile as owning Charles. And if you want to own the stock anyway, you get paid to be patient. And here's an example of a put sale on Kimbro Diagnostics, aka KimBio Diagnostics, selling a 750 put sale. We talked about the option chart. We talked about the going in, selecting the bid, selling it at the bid. We also discussed what it looks like when you're getting into the actual trade. This is what that looks like. And we also discussed what it looks like at the actual order function. And this is what it looks like when it's actually on your platform in your positions tab. And then we also discussed a bear call spread. And this particular bear call spread has been unraveled successfully. The June 8 and the June 308, 309 bear call spread. Right? This is a trade that you do not want the stock to go higher. And obviously we all know that the spy has indeed gone higher. So this is how you get into a bear call spread. As you click on one of the options and you look to sell it. And you're gonna have two different legs. You're gonna have a sold call and you're gonna have a long call as protection. That long call will go up when the stock goes up and the short call will go down when the stock goes up. You want the stock to go down or sideways to make money on the bear call spread. So here's where I get to do a poll. 5, 4, 3, 2, 1. Boom. All right, quizzing. Here we go. What is a bull put? What does a bull put describe? If you sell a long put at 45 and buy a short put at 40 is that a bullpuppet spread? If you buy a long put at 45 and sell a short put at 40, is that a bullpup spread? Or if you sell a short put at 45 and buy a long put at 40 as a bullput spread, which one of those is a bullpen? Nice. I'm going to close the poll in five. Matt says it will not let me vote. Nah, because it knows you know the answer. Matt, I have programmed zoom to automatically assume that you know everything, so it just doesn't let you vote. Just misku this the polls. All right, ending the poll and I will share the results. So I made this one hard intentionally. The correct answer is, we got a big. We got a big old skew. So sell a long put at 45, buy a short put at 40 is the incorrect answer. Buy a long put at 45 and sell a short put at 40 is also an incorrect answer. Sell a short put at 45 and buy long put at 40 is the correct answer. So if you chose incorrectly, take a screenshot of that, write it down, and memorize it, because that is the proper terminology. If you're getting into a bullput spread, you sell a short put and then you buy a long put below that to protect yourself. 7, 6. If you want another poll to test your abilities. All right, here we go now. Next one. Selling puts is bullish. True or false. Ba da. Down, down, down, down. I do need some good quiz music. All right, closing the poll in 5, 4, 3, 2, 1. Hey, everyone got that one correct. Nice. Everyone who is here, 100% of you got that right. I love it. Fantastic work. Gorgeous, Gorgeous stuff. What about selling calls? Is selling calls bearish to neutral. Bearish to neutral. True or false? What do you all think? Selling calls Is it bearish to neutral? Closing the poll in 5, 4, 3, 2, and 1. Ending the poll and sharing the results. True is the correct answer. Selling calls is bearish to neutral. That is correct, right? Because remember, if you're in, if you had purchase calls and the stock is going up and you sell those calls, you're expecting the stock to trade sideways, pull back or hang out or rest, which is neutral. And if you are selling calls like you're selling puts, AKA naked or getting into a bear call spread, anytime you sell a call covered, whatever it is, you are bearish to neutral. So that is true. All right, one more poll. A LCD pick which one accurately describes a long call diagonal. Buying a call and selling a call above it with a different expiration date. Or buying a Call and selling a call below it with a different expiration date. Which one is a long call diagonal? Who's coming with me to the party of money? All right, closing the poll in 5, 4, 3, 2, 1. Poll is over. And the results. 78% of you got the correct answer. Buying a call and selling a call above it with a different expiration date is a long call diagonal. A short call diagonal is buying a call and selling a call below it with a different expiration date. That would be a short call diagonal, AKA a bear call spread diagonal trade. If you are bullish on the position, you're going to be buying a call and single call above it. That is a long call diagonal. Nice. Good stuff. Module 5. Tap into 9 if you're jazzed up and ready about some Fibonacci and some Elliott Wave. All right, so one thing I want to make sure that's very clear. I could honestly have 900 classes with 4,000 hours on just these two topics. I'm going to teach you how I personally use Elliott Wave and fibs. I do not claim to be a fib specialist. I do not claim to be an Elliott Wave specialist. I've studied them a little bit. I've spent a little bit of time on them. I know how they generally work and they absolutely are and can be useful in trading. Both technical analysis and Elliott Wave are like most analysis is extremely speculative and very opinion based. I try to keep my Elliott waves and fibs super simple. Generally it helps me stay in the trade longer or get in at a great price. Which means if I'm getting into a position, I look at an Elliott Wave or I look at a fib and I create a trade, it's going to help me get in at a specific location or get out of a specific location. It's very, very important to understand that because I have been in many an Elliott Wave room where no one ever takes a trade because they can't figure out the counter. They always have these theories and ideas and speculations and postulizations of where you are in the long scheme of things and they never pull the trigger. I do not do that. I keep my Elliott Waves and fibs as super simple as possible because that's the only way I can do it. So let's go ahead and dive into module 5. Here's some basic rules for Elliott Wave. Wave 3 is often the most powerful waves are fractal, which means they occur on every single time frame. Wave three cannot be the shortest. That's a very important rule. That's an extremely important rule. So the other two are pretty much garbage up to that point. Wave four is a very crucial rule. Wave two never retraces more than 100% of wave one. If it does, that's not wave one. Or is it wave two? We use some examples of this. I promise, if you know my teaching style by now, you know there's some examples coming. And another rule is wave four does not overlap the price territory of wave one. It's also a very important rule. So the first two rules are kind of like fluff rules, and the other three are actual legit rules. They are totally legit. Now, you do have to somewhat memorize those three rules, the bottom three, because it's really important when you're counting your waves, there has to be a little bit of a structure to them. So let's hop over here and talk about how I. How I personally implement wave theory. Here's what I do. Ready? I try my best to find the obvious wave 2 or 3, if possible, and continue to play wave 3 and or anticipate wave 4 to then play wave 5. Right now, a lot of you have no idea what I'm saying. Type in a 2 if that's you. Like, I have no idea what you're saying. Dude, you're just throwing out words at this point. I'm surprised that you're still speaking English. Cool. So no one has any idea what I'm talking about. Perfect. I'm gonna get with you. Don't worry. So this is how I personally implement Elliott Wave in the green. What I do is I look for what is likely a wave three, and where can I play wave three. And if I can see a wave three, I have a general idea of where we're going, and I can create a really nice trade setup. When I looked at this particular chart on Roku, ladies and gentlemen, type in A4 if you would agree there was a lot of volume coming in on Roku. Let me see some falls in that chat pane. All right, so a lot of fours coming in, because you all agree that there is a lot of volume coming in. Now type in a 7 into the chat pane. If you remember the rule where I said wave three is often the strongest. Right. That was just a few moments ago. So if wave three is the strongest, that probably means it has the most of what or it has a lot of what? Volume. Yeah, so it has tons and tons of volume. It's probably some sort of wave three. Also, if it has a bunch of gaps, it probably is a Wave 3. If it has a powerful, strong, robust move, I like to move it, move it. So if it's very, very powerful, it is probably a wave 3. So what I theorized on this particular trade was that this would be a 1, 2, 3, 4, 5. That is what I theorized on Rok. Now you might go, that's really cool and all newsome in hindsight. I mean, congratulations, high five for you. But let's go into an actual trade set up in just a moment and we'll talk about how I figured that was the case. Now, one explanation is have we made a higher high? If we look at this particular candle, have we made a higher high? And the answer is definitely. So if we think about just regardless of Elliott wave, this is gonna be a really cool breakthrough for some of you. You. But why are double bottoms so strong? Because double bottoms are usually the wave 1, 2, 3. The retrace is a wave 4 and then a wave 5. Double bottoms are often a structure of Elliot wave. Ah, that's cool. Yeah. Now that's what makes double bottoms really fun, is that they're a wave structure. So since I could absolutely, unequivocally, without question, stipulate and note that we have ourselves a double bottom pattern, we have a gap, we have volume, we have a higher high. I'm going to expect this to continue. Have a way forward, have a way five. Now, my friends, does Roku have to do that? And the answer is no, of course not. It doesn't have to. But could I come up with a plan that allows me to buy, sell, rebuy, and then resell at a higher high and make money? Or is there a chance where if I got into a long call diagonal, bought some call options where we made money when it goes up and it trades into a level that I feel like I should sell a call, and then when the stock pulls back, I can buy that call back and lock in a profit. And then when the stock bounces, I can sell that call option, make some money. Sure I could, right? Or if I don't really totally fully trust the analysis, I'm like, well, maybe could I get into a bullput spread down here, make money if it went higher, sideways or down a little bit? Absolutely. Or what if I want to own shares of Roku and said, well, you know what? I'll just sell a put down here because I think it could go higher, but I'm not entirely sure. But you know what? I don't mind owning shares at 90, so I'll sell a put, and that can make money that way. What do you guys think? Absolutely. Could you do all three? Sure. Could you pull, put, spread put, sale, buy shares and do a call option? Of course you do whatever you want your money. It just comes down to the analysis. Jay says, I feel like I've been playing checkers, not chess. Dude, it gets so deep. I can get so deep with this stuff. It's insane. I love it. I love. I love Elliott Wave so much now. Elliott Wave. Look at this word theory, boy. This is a theory. And again, please listen to when I say this, folks. There is a rabbit hole like no other rabbit holes. If you start diving into Elliott Wave, it can go deep and get messy, and you will have no idea how to trade. You will be doing counts all day long, and you'll just never take a trade because you're like, I don't know what's going on. Just make it as easy as you possibly can. Try to find a one and a two. How do you know it's a one and two? Because three will have gone higher. And once you find three, play four. Make money. One, two, three, four, five. Boom. Look at that. How epic. One, two, three, Four, five. Bang. How amazing. What is Newsom doing? 1, 2, 3, 4, 5. Boom. What's up? Where you at? How cool is that? I think it's amazing. That is just so intriguing to me. 1, 2, 3, 4, 5. Boom. What's going on? Where are you at now? It's just so much fun. I can do it all day. One, two, three, four, five. Boom. One, two, three, four, five. Bang. It's amazing. Now again, I just try to keep it simple. I just try. I like to count in fives, fives and threes. It's just easy. If I can find a good pattern, I will. If I don't, I won't. But here's what we're gonna go do. We're gonna go listen and watch the analysis on Roku on that particular day. And the recording cuts off before I actually do the wave count. But type in A4. If you'd at least like to hear what I thought on that exact day when I was doing that analysis. This is back on April 14th. So here we go. Next target, really, for Tomorrow is probably 66. Oh, snapdragons. Hold on. Can I go back? I know what I'm doing. Here we go. Sorry. The lines are going to be the most beneficial right now. Are going to be these long. Oh, it won't let me. Full screen. There we go. I'LL figure you out. YouTube. So our next target is 6907 on square. We could hit that tomorrow if we gap up. And then obviously the next target really for tomorrow is probably 66 and some change. So those would be the two biggest prices you have to contend with if you're playing square. But if you're in shares, congrats. I wouldn't sell covered calls yet. Wait till we get a little bit closer and then play it out accordingly. But square looking beautiful. Roku. Roku man. Ms. Roku today by the hair of my chinny chin chin. We had some traders who were in bullish on Roku overnight last night and they sold at open, which is what I thought would probably be the best plan, you know. And you had a lot of pre market movement once this candle closed below pre market. It was a little bit on the bearer side but obviously prior plan we couldn't shorted Roku today. And as I mentioned yesterday, I was looking at going long off of 103. Sorry, 101 32. And you can see that that did not happen. So that's pretty much it. That's that simple. Roku, very nice gap. A lot of people are trying to figure out when the heck we're gonna break out this massive consolidation. This is a big deal, folks. Roku is above. Look at this weekly. So the weekly chart, Roku is closing. This is a close so far. If we go to a monthly chart, you're almost above last month. It's a big, big deal. But the weekly, it's a really, really good close. I would not be afraid of trading Roku Bullish again today or tomorrow. In fact, based on this candle, I think we can set up a swing trade just like this. Just like that. Bullish stop above that candle. Stop loss right there. Let me just pop into an hourly chart and see if I can tweak that at all if I need to. I think I can. I think we could do a bullish stop there and do a lower limit. Pretty sure that can happen. So the limit is going to be. Give me one second. Let me type this out. 109. 69 is the stop and the lower limit will be 109.14. Which means I can do this at 102.14. Okay, so the numbers in the worksheet are going to be 10919 by 102.14. Today is 4, 14, 20, 20 Roku. And again, ladies and gentlemen, I like to say this all the time just because I'm Setting it up doesn't mean it's gonna work. I do like the gaps though. Does look pretty. This one could be Play with options. Absolutely. 102.14. You'd have to have a pretty big stop on that option trade. But it is a good setup. Probably a few things that someone could do with that one. All right, come over here. All right. Boom. So that was the. So you see the process live. So that was me in the afternoon swing trading room looking at the analysis, talking through what I think it's gonna do. Creating the actual setup, creating the actual entry and then placing it in our official trade tracking journal and then posting it in our community, which can get everyone a text message if they have their preferences set up that way so they can get a text message alert that I'm actually going to be setting up that particular trade. So now what I'm going to do is go back over into Roku and just look at what actually happened on that particular day. So here's Roku. So type in a 6 if you can see kind of that it went bullish after that particular day. Right. It gapped down and then got bought up. All right. And what I'll do is I'll pop into a 30 minute chart and kind of come over here a little bit and go back, go back, go back. Now check this out. Remember how I drew? I wanted it to trade up, rotate, and then bounce. What do you guys think? Come on. Come on. How sick is that? I mean, you know, it's not bad. It's not bad. Killer move. Oh, man. Again. I can go replay that if you need me to. If anybody's ever watched this recording, you want to access this video, just let me know. Be happy to send it to you and you can watch that whole thing. This is April 14th. So I was extremely bullish on the whole market back in April. All I've been doing is just absolutely train housing stocks since then. But that was the analysis on Roku back in the day. That was the analysis. That was a setup. That was the trade. That was a very, very nice win because we can see that Roku went on to put in a beautiful trade. Right? This is the back over to the daily chart. And it really had some nice, nice movement. Two or three days later we hit our target and that was it on that particular trade. Now again, stop bragging. I want you all to know that that's the analysis that I went through. That's kind of the process. And that's just what I looked at. I Kind of formulate everything and in my brain I was doing a wave count. I eventually ended up doing a wave count the next day when we got triggered into it. And this is the wave count. I believe I posted this wave count in trading view. Let me just go check really quick. I may not have and if I have, that's okay. I absolutely have numerous recordings of this of the wave count. So it's not that big of a deal. Again, I just want to show you how I use the waves. That's the point of all this. Roku. I did not, not on that particular setup. I did not do a wave count or I didn't publish it at least. No big deal. Alright, so that's what we have so far on Roku. That's kind of the thoughts and that was that particular trade on how I kind of use and look at a general idea how all this stuff works out and plays out. Now what we're going to do is talk about what the wave structure looks like, how to find these waves and we're going to do some more analysis on some real time perspectives on how this whole thing structures. So this is the wave 5 structure, right? 1, 2, 3, 4, 5. Now a lot of times from Elliot wave, the ABC is a little bit larger than I personally think it is. This is a macro scale. Mr. Elliott has all kinds of things that are called like super cycles and you know, cycles and just all kinds of different time frames. Generally a 1, 2, 3, 4, 5 can can have a pretty big retracement but it doesn't have to. That's what Roku is doing right now, by the way. So Roku is following wave structures so beautifully it's insane saying we'll look at Roku a lot because I have counted Roku like 15 times. I can't mess up. Every time I count it I nail it. And so I already know what Roku is working on doing right now. So in this big big pattern you can see the wave. I mean check this out. It's really, really phenomenal stuff this wave one, right? The primary wave, the wave one always ladies and gentlemen, is comprised of sub five waves. Alright, so check that out. So that wave one is always going to be comprised of five smaller waves on some timeframe. This wave two will always be comprised of three smaller counterwaves and of this wave down here will be comprised of 5, 5 sub waves higher on like a minute time frame or like a 30 minute or 5 minute. Right? So it's all fractal. Really, really, really cool. Stuff. And this was R and Elliott's essay, the Basics of Elliott Wave Principles, published back in October 1940. If you really want to nerd out, go crush that book. So here's the breakdown. Wave one is the hardest to catch and time. And that's again, just my opinion. But let's all be honest. You know, no one's really getting in at the exact low. No one's buying right there. So in that particular situation, what we have there on Elliott Wave is unless you have like a limit buy or you're bullish, you're looking at really just nailing that particular price, you're not really catching that wave. So wave one's hard, but this is where the trend changes. Volume comes in here, but generally not enough to alert many technique, many basic technicians. Reversals, candles, gaps, a bounce off moving averages. Something. Something is happening over here. Generally, when the first wave of a new bull market begins, the fundamental news is almost universally negative on the larger time frame. By the way, that sounds familiar. That sound familiar at all? When the first wave of a new bull market begins, the fundamental news is almost universally negative. Huh. The previous trend is considered still strongly enforced. AKA everyone thinks that the markets are going to continue to go down. So it's hard to time. Elliott Wave technicians get this one wrong all the time because they think it's just going to do this and they have these kind of global cycles and they just always kind of mess it up. I always prefer that this is the correction, right? And then we're going to do that kind of forever again. I know we're not going to forever do that, but facetiously, I'm just saying that I generally think it's easier just to kind of expect the market to continue to go higher to some degree. Now, wave two is actually okay. Wave two is easily identifiable because this is where you can get a lot of like double bottom signals. This is the dip. Buy the dip, aka buy that salsa, aka by the pullback, aka by the retracement. Wave 2 is not allowed to extend beyond the starting point of wave one. That's just a rule. So if you find what appears to be the start of a wave one and you're creating your wave two, Wave two cannot go below wave one. If you're drawing a wave count, wave two always has to stop above the high. Sorry, above the beginning of wave one. Now, generally you do not know that this happens until hindsight, but most more often than not, it's right around here that I can start going, maybe, maybe something can begin happening. And it all depends on these candles right here. Morning stars, gaps one white soldiers, new white soldiers, threes or bottoms. There's all kinds of things. But typically the news in wave two is bad. And this is where all of the new traders will start shorting and expecting it to roll over. And everyone thinks the world's gonna continue to go down and stocks and go lower and lower and lower so they start shorting. By the way, this is almost an exact drawing of the S and P. After the entire Covid thing I just realized that I'm laughing about it because this is all purely just hand based drawn. But that's kind of spooky. Victor says. Is that where your 2.4 R target comes from? That is correct, yeah. So wave three. Wave three is usually the largest and most powerful wave in a trend. The news is now positive. The fundamental analysts start to raise earnings and estimates. Prices rise quickly. Corrections are weak AKA right now in the market. Anyone looking to get in on the pullback will likely miss the boat. As wave three starts, the news is probably still bearish and most market players remain negative. But by by wave three's midpoint, the crowd will often join the new bullish trend. Entering public participation. Type in A4 if you've heard that term before. Public participation. And then of course wave 3 often extends wave 1 by a ratio of 1 to 6, 181618 to 1. Which means this is oftentimes 1.618 times the distance of this. Now again, I'm not going to really dull your brain with Fibonacci stuff, but this is a fib ratio. We're going to talk about that in just a moment. But here's the thing. Generally ladies and gentlemen, at some point you can always see this quite frequently. I mean it's happening right now in the markets. Right now we are in a wave 3 shorter term and this exact moment in time. So we began to plan for a pullback of some sort, which is unfortunately one of the harder ones to time. And now you get a wave four. Wave four, my friends, is ugly. Generally wave fours stop out tons of weak hands. So I say weak hands as traders who get bored, traders who get impatient. They might have bought a little bit high. Most traders get in near the top of wave three because it feels comfortable, it feels easy, it feels simple. They think they're catching the breakout. There's ain't they're getting in bullish AKA today, right? They're getting on the breakout by the top of wave three. They're like, ah, yeah, now it's confirmed. Now we're breaking out. Now I'm gonna get in. And they wait, they wait and they wait. And wave four is sideways, choppy, mean and slow. And sometimes wave four can be a triangle, it can be a pin, it can be a wedge. It's usually some type of really ugly compressionary consolidation type of pattern that will just frustrate, annoy, chop people up to bits. And then you're going to go higher. And again, all of this is still ready for type in A1. If you're ready for another mind blowing experience. This is really, really cool stuff. I love this so much. Oh, man. All right, here's the ones. So here's what I got for you. All of this wave theory, this is still accumulation, public participation, distribution, accumulation, public participation and distribution. All of the things that we've talked about thus far will begin to blend into all of these things that have been previously taught. So the double bottoms are wave fractals, right? The double tops are wave fractals. The public participation in DOW theory is all wave fractals. It's all in the same, it all combines. So when you start really, really pulling it all together and you can just kind of feel it and you see it and you can understand it, it's a theory and a good blend. And it's gorgeous. And it can make you so much money. I love it, man. It's nice. Because if you can start stacking the odds in your favor, man, you can do well. All right, so let's talk about wave five. Wave five is payday. If you bought anywhere previously, wave five is payday. This is where tons of newbies will buy at the top of wave five. This is the point where you'll hear the term the trades confirmed, the trend is confirmed. I'm looking to get in, I'm looking to get into a trade, and I can count as an obvious wave, 1, 2, 3, 4, 5. So I'll repay that again. If I am looking to get into a trade and I count an obvious 1, 2, 3, 4, 5, or what appears to be an obvious wave count to me, if I'm buying at the top of wave five, I will wait. So to reiterate, if I can look at a chart and go, oh, wow, yeah, I'm at the top of a wave five, I just will, I will wait. Now, what if this, this keeps doing this and I keep. And I miss the boat, it keeps running without me. Has that ever happened before? No, of course not. Not to me. I mean, it's happened to you guys. Just kidding. Absolutely right. I'll get out of trades. And it keeps running all the time. Like that happens so frequently. Mark says, hints. While we don't buy at all. Time highs. Yeah, all time highs are very frequently some type of wave 5 creation. They're usually. This is. This is where payday comes in. This is where you got to get in, right? Ladies and gentlemen, you only get two chances for salsa. There's your salsa, and there's your salsa. Do you want mild or medium? Do you want tortillas and guacamole or refried beans and sour cream? Like, what kind of dip and salsa do you want? But you're going to get two of them. On whatever time frame you're looking at, you're going to get two. I can blow some minds with Elliott Wave. I love Elliott Wave, but I keep it insanely simple. Two more. Three more things. Edward says. How long does wave five last? It depends on the time frame, my friend. It depends on the time frame. Wave 5 can last a very long time, especially on a big time frame. It absolutely can. Wave A. Generally, people who rush in do so because they missed the main move and they buy here. So they'll go, and I've done this many times, by the way, thousands of times, right? Instead of buying here, I'll go, oh, sweet. Okay, cool. Now there's my dip. All right. Good thing I didn't buy up there like an idiot, right? So I buy right here. I buy that pullback. Oftentimes it's traders who fail to notice how far the bullish move. The bullish stock has already moved. What I mean by that is if the stock is up like 200% and it has a clear 1, 2, 3, 4, 5, and I can see that. I'm very cautious and try to buy. Try to avoid buying a potential A wave. Now, how do I know if it's an A wave and it's not? It can just continue higher? I don't. What I use is, I try to use how far is the stock moved? That's a big, big, big indication of am I chasing? Am I getting in right? Is this a good time? Is this an inappropriate time? Where are we at? What are we doing? It's all about the percentages. That helps me a lot in all this. Okay, now wave B. This is a trickster in true form. Because if anyone bought the A wave, they get super excited. This happens on day trades to me a lot. I'm like, oh, yeah, I am a genius. Let me See the genius banner. If anyone who bought that pullback on a wave, they're like, oh yeah, they get fired up. This is the part where head and shoulders are forming. Double stops can eventually form. I almost never short on B wave. There are some traders who do. I'm just not that good. I'm not good at timing that rotation, honestly. So if I'm playing a double top, I really, really like to find out what it looks like. And here's your C wave. So the frustrating thing about C wave is that it can be so many things. It can stop you out before you go higher. Right. Or it could be just a sideways consolidation. It can be a full on reversal. Sometimes they cause a full on correction, trend reversal or just a super shallow bounce. But wave C is typically at least as large as a wave or extends to 1.61 times beyond a. Now this can either be a nice buying location, it can be a good shorting location, or give me a time to just wait and be patient. Many traders get shopped to bits and wave A through C as this is a distribution phase. Now, I know so far a lot of this sounds super, super, super complex. I get it. So let's make it a little bit less complex by going into the charts where you all feel comfortable because let's be honest, no one likes PowerPoint. And let's look at these charts and talk about what we have from here. Lucas says this makes a lot of sense. I think so. I think so. I mean there's a lot of really cool things that we can take away from this. So here's Roku. So at this point, ladies and gentlemen, what wave are we in? Because again, you could. You should clearly be able to see. Yep, I get it. I know what wave we're in. Mm. You all say three. I would agree. Now obviously we were like, oh yeah, cool. This is hindsight. Well, yeah, no, not really. I mean it is hindsight. But I was there, I was here, I saw this. This was a very, very nice, very orderly, gorgeous setup. Now when you're talking about wave two creating. Look at this wave two. Did you get some nice gaps and some nice candles and some nice traps that came in to give you an idea that you might have a wave to there. And I would think absolutely right. Nice gap right here. You might be able to get in here on this candle when we close above all this resistance. So this is a wave three. So if this is a wave three, that means what wave is coming next? 4. And wave four is going to be ugly. Sideways, choppy, generally. And then we're going to have one higher high somewhere. Now how high is wave five going to go? I don't know. Is there anything that can help me get a general idea of where wave 5 might go? What do you all think now again? Yeah, we could use fibs and we're going to talk about that next. What else? What else can we use other than fibs? We could use a previous resistance. Totally. So we could use this resistance right here, which I'm basing off of this candle. This candle. That's why I focus on my eyes and then, you know, the rest happen. We could use this kind of like trend line. Like this high, this high and this high. Lucas says, how do you know where waves start and finish? Where you can see at this point in time that this is clearly the one. Clearly the two like you can. You can see it. So right now we don't know where wave three is gonna finish. Again, you can use fibs and we're gonna get to that in just a moment. But that's, that's what I've got so far. That was the drawing. That's kinda what I created. That was my thoughts. Alright, so next comes in. Here's the wave four. Kind of spooky, huh? So there's your wave four. Now again, how do you know that this is a way for. The answer is you don't specifically. You never know anything in the market. We can only assume. Okay, this could be possibly a way 4. I got a count. I have a count. So I'm gonna look to do something here. Now. What could that something be? Go ahead and type it into the chat pane. What would you like to do? David wants to do a put sale. Beautiful. That's a great strategy for wave fours because maybe it's wave four, maybe it's not. But I like it. Mark wants to do a bull put spread. There we go. You could do a bullput spread. Totally. I like that idea. What else? Someone says you could buy some shares. Absolutely. You could buy a little bit of shares, maybe 5 shares, 10 shares, 100 shares. You could buy some piece of shares just in case. You can start a small position. You can buy a call option or two, or you can do all the above. Or you could buy some shares and do a weekly covered call. Right, Joseph? Buy some shares, 100 shares here. And do a covered call right here, expiring next week. There's all kinds of things that you can do. And most traders who are trading with me at the time did either bullpen spreads or put sales somewhere down here for a few days or for a few weeks, and this is what happened. All right. Is that a new high, my friends? Yes, it is. Is that a place to sell? Yes, it is. Sell at new highs, Especially if you have a wave count that says, yeah, this is a clear 1, 2, 3, 4, 5. Now, one other very interesting thing is earnings were the very next day. So if you're like, you know what? Let me just sell to lock in a profit. That would have been a great place to potentially do it. Now, what if Roku gaps up to 180 on earnings? Is that possible? And the answer is, absolutely. We know it didn't happen, but it could. You could have. Jay says, I would scale, but leave some in just in case. Totally fine. Absolutely. Absolutely understand. But I love selling at new highs. That's one of the things that I love to do. When a new high comes in, I'm a seller. Right. I don't wait for a lot, folks. So. So, so many people are going to be teaching you to buy this breakout. This is where the breakout. No, this is where you need to be getting in here. Type in a 6 if you can see that. Picture perfect trap. Textbook. It shook out all of the weak hands. Remember how I said it shakes out all the weak hands. This is a retest gap. And what did it do? It retested the retest gap. Wow. Whoa. So retested the retest gap, and it stops people out who got bored and impatient, who bought somewhere over here, probably, and they had to wait. Oh, no. Two whole weeks. Who would have thought that? So they got stopped out. And then it bounces. It's natural. The natural ebb and flow of the market. Just a wave four. So at this point, what could come next, David says, is that exhaustion volume on wave five? Maybe. I don't know yet, but I'm selling there for sure because that's very big volume. So, again, I'm a seller. So from here, you could get A, B, C. That's a possibility. Another possibility is. I mean, there's all. There's literally a thousand different ways you could draw a correction. Another possibility is a 1, 2, 3, 4, 5, which is what we're doing, by the way. So that's another potential correction. Now, again, I'm not gonna get really into the counts, and I'm gonna annoy some Elliott Wave theorists here, and that's fine. But an ABC can also just be A, B, C. And the A and the B and the C waves are all Comprised of the individual waves anyway, right? So they can all kind of be comprised on top of each other. But here's where we are right now on Roku. And the cool part is I personally can clearly see a 1, 2, 3, 4, 5. Can you? 1, 2, 3, four, five. How killer is that? I mean, if that's not mind blowing, why am I even here? Like that is so crazy sick. I love it, love it, love it, love it, love it, love it. And you might go, that's all cool that you can do that now. But what does it mean? It means that Roku is in a phenomenal wave structure is what it means. It follows its patterns very well. So if this becomes a 1, 2, 3 and we take out that high, do you know what you could do from there? I would argue absolutely. And could you come up with a pattern and a plan and an idea? And then you could go, oh wow, maybe this is a 1, 2, 3. Or, or. Or maybe this is a 1, 2, 3, 4, 5. But either way, both counts lead to higher highs. Would you agree? Now, again, I'm not saying that Roku is going to do that. I'm definitely saying it probably will. And it could. In fact, let me go to a weekly chart really fast on Roku. And you ready? Type in another six if you're like one other mind blow experience. Here we go. So Roku, Roku is up. Was up 500% in 2019. That's just a math fact. So remember what I mentioned earlier when I said, hey, if you're looking at trying to get a wave count, you're trying to get a general relative idea of how everything can play out. It's a really good idea to figure out how far the stock has moved. If the stock has moved really far, then you probably want to wait before really going super strongly bullish. Right? Remember that. So here's what we have on Roku, in my personal opinion. Let's go to a weekly chart. I'll move this here for a second. And here we go. 1, 2, 3. All this is wave 4. This wave 4 did not take out the low, which is a requirement. It got close, but it didn't quite do it. And it was during COVID So all of this move is a giant waveform, which makes so much sense. It's uncanny. Now, in order for this wave count to be true, I have to create another wave, two. 1, 2, 3, 4, 5. Before it. 1, 2, 3, four, five. 1, 2, 3, Four, five. 1, 2, three, four, five. 1, two, three, four, five. Boom. Magic now this wave count might not be totally accurate because wave three looks a little bit short, but it is longer than wave one, so it works. How cool is that? Is that not awesome? Oh, man. I think that's amazing. Lucas says the way you teach this is amazing. Thank you, dude. So again, what's really fascinating is we have a 1, 2, 3, 4, 5. And this is an A, B, C correction. Then that means that this is a 1, 2, 3, which would create the postalization of what I just came up with earlier. That Roku is a good long term buy around this price. And the truth shall set you free. It just makes sense. So what I'm doing is I'm really keeping close eyes on Roku over the next few weeks, Jeff says. So a good point of entry might be when it goes through 114. Yes. But again, you can always start slowly picking up a share or two. Right. Or remember we talked about earlier, you could do a put sale or you could do some bullput spreads. Here's the daily chart on Roku. And pop into the daily chart. And if I'm looking at this daily chart. Oh boy. All right, back to the daily. Let me just clear this line. Give me one second. I'm doing all this on a trackpad if you guys are impressed. Okay? So we have this gap to fill. It very well could fill that gap we are talking about. This is a 1, 2, 3, 3, 4, 5. We already got that earlier. Lucas says, I'm starting to buy from 105. Nice, nice. And again, you can just do so with small size, folks. Right? You don't have to load the boat at this particular point in time. I mean you can, but yeah, if it breaks above 114 on Roku, that would be a little bit more bullish in my opinion. So again, all I'm saying is could you begin at this price, have a general idea based on some of the things I'm starting to say that you could go, you know what, let me just start buying five shares here and I'll buy five shares next week and I'll buy five shares next week and so on and so forth. Right. Could you do that? Absolutely. And would it be an okay idea to come up with some ways and come up with some theories and come up with some angles and some possibilities like, yeah, this might be a good time to do that. And the answer is, of course, because at this particular stage. Right. So Lucas, remember just last class, you're like, man, I really wish I was there in class when Jeremy was giving Me one of those ideas. That could be a big, big home run. Here it is three years ago. People are gonna come to this video going, oh, man, that is sick. And if I go to a monthly chart. 1, 2, 3, 4, we're waiting for that. Wave 5. We're waiting. The pressure is beginning to build. It's gonna get really, really fun. Wave 4 can last a very long time. This is a monthly chart. So I mean, wave. Wave four could. Could do this. Wave four just can't go below wave two, Right? Just can't go below wave two. That's it. It could be sideways for a very, very, very long time. Especially since roku had a 500% run up. So top it on one, if that makes. If that makes sense. Right? Ladies and gentlemen, since it had such a massive run up, it can absolutely trace obvious for a while. Yeah. Okay, now let's go back to the presentation. And again, Robin Stackel, thank you so much for helping me with the slides, making sure everything is spelled somewhat accurate. Now here's a good question, my friends. Do you think all this stuff that we're talking about, all this weird Elliott wave thing, does it work intraday? Nah, come on. It can't work intraday. No way. All right, let's go practice. This is a 5 minute trot on Roku. What wave could this be? What wave could this be? So I want you guys to look at the chart and just do your absolute best to get a general idea of what. Wait, what wave could it be? I know the answer. There is a correct one. So here's how I'm viewing it. 1, 2, 3, 4. That's how I'm viewing it. Now, why is this a 4? Well, it's going sideways and we're not really making higher highs or higher lows specifically. It's not then dramatically impressive. It's just. Okay, why would I say that? This is a wave three. That's a very strong, strong move. Now, if you're thinking to yourself, this could be a 1, 2, 3, 4, 5. That's also possible. There's also very, very possible. The interesting thing about it is, does this wave three look super strong? And the answer is not really. But here's what's very cool. If we do not make a new high, you can guarantee something. What can you guarantee? If we do not make a new high, we can guarantee that this is a way five is gonna come down. Because then this is absolutely a way for. Yeah. So if we make a new high and this is a way five structure, then we can start going, okay, well, there's a lot of other things, but maybe I'll just zoom out, do a bigger time frame and try to account from there. Some counts will come naturally for some of you if you sit down and you just absolutely suck at this. It's okay. Spend a little bit of time on it because it is worth your time and it is worth a lot of money to figure this stuff out. So now what wave are we in? Right, so we got the 1, 2, 3, 4, and we got the wave 5 down. So my thought process is, okay, well if this is a wave five, we could get an A, B, C and go a little bit higher. That's extremely possible. Makes a lot of sense to me. Or if it is a wave 5, which it appears that it is, are these candles very, very big, strong and powerful, ladies and gentlemen, yes or no? Yeah, of course they are. Okay, cool. What do you think? True or false? Can a wave 5 get be comprised of 3? Sorry. Can a wave 5 be comprised of 5 internal waves inside of it? Goosebumps. Because this is exactly how I took this trade. All I did was wave counts to make this trade happen. Lot of you are saying, sure it is. So way five can be comprised of 1, 2, 3, 4, 5. Very simple. And then that wave five is over and then it's done. Like that could be it. So I don't know exactly what's gonna happen yet, but here is what I did for my day trade when I was watching Roku. For those of you who traded with me, you remember this. I said, hey, I'm an enter here with a stop there. Type in a 9. If that seems like a reasonable thing that I would do on my day trades. Right. This was a perfect tweezer bottom, by the way. Candles have the exact same low. So again, let's throw all the Elliott wave things to the wind for a moment and pretend that they don't matter. They don't actually work and no one uses them. If we're looking at just candles, can we see that this is a strong selling candle and this is an inside bullish candle. Tweezer bottoms. If we take out that low, sellers are probably going to come in. Yeah. So again, forget the whole Elliot way thing. Doesn't matter if we're looking at just candles. That's all I have on the screen. I don't even have volume. That's intentional, by the way. I don't even have volume because volume would make this even easier. So in a situation of this magnitude, I'm just Saying, okay, well, maybe it'll do that. I don't know. Okay, so here is the bounce up. Pay close attention because this is epic. Can you see an ABC reversal in that move? A, B, C. Oh, Jeremy, you're starting to scare me. Okay, so what does the ABC reversal mean? Well, it means that once you have the ABC reversal. Ladies and gentlemen, can we start a new 1, 2, 3, 4, 5 waves? Yes. Right. Once we get the reversal, we can get away. Now, I get it that you can have massive, massive. What's called expanding flats and all that stuff, which this is all. That's what that is. You can have an A, B, C, D, E, F, G, H, I, J, K. Trust me, like I said, you can fall down the rabbit hole all you want. I fell down the rabbit hole. No one likes me. Girls ran away from me. No one talks to me. I was a nerd. I get it. I had no friends, no money. I just sat in a corner, ate donuts and looked at charts all day. Okay? Understand? Got it. I didn't even know that how much money you could make from this stuff. I just knew I needed to make some to pay my pops back. Right. You guys all know the story. This is where it gets insightful. From here again, let's pretend for a moment, Elliot, waves do not exist. And nothing exists other than candles. And candles are the only thing that matters, which they still do. Is this candle indicative of a lot of buying? Yes or no? I shouldn't say a lot of buying. Some buying. All right. Yes. Right. It's indicative of some buying. And is this candle indicative of a little bit of buying? So you have a big sell off, a potential retracement and a bunch of buying at the exact same level. Could you create a short here where they stop right there? Is that possible? Cool. It is possible. Is that gonna work? Ladies and gentlemen, my dear friends from all around the world. Who knows? Maybe. Probably not. I don't know. But I do know one thing. What do I know, Ariel? What do I know? I know my risk. So it all comes back to that. It all comes back still to the risk. What is the risk? Now, I have stacked a lot of odds in my favor. Wave counts, candles, support, resistance, and moving averages if you use them. We are retesting old support as new resistance. Look at that old support news. So there's many, many things that could go right here. You're stacking the odds in your favor. I still did not think this trade would work. But you know what I did? I set up anyway Because I had to. Because when I see a candle like that, with a buying candle like that, and I have that, that wave count happened in my head immediately. I looked at that chart. I could see the whole thing. 1, 2, 3, 4, 5. This is a wave five down, ABC. And we're starting a one. This is a wave one right now. I got it. I'm here for the one. Let me get on. So this is a one. This could be a two. This could be a three. Here's a four. Here's a five. Now, there's no way that plays out right. Because if that happens just like that, you would have to say, Jeremy is an absolute magician, ladies and gentlemen. That is so sick. Now, again, that is freehand drawn. All right? You might think that I know what the slide is gonna do next, but I promise you, I have not practiced the slides that much. I wish I did, but how sick is that? Oh, my gosh. Now, the cool part of all this process is really this, my friends. This is the cool part of all this that we're going through. What I am very good at is explaining why all this stuff works. There are other traders who are better than me. There are other traders who are richer than I am. There are other people who have more Lamborghinis than I do and more girlfriends. I mean, no one has better hair or a better beard, so at least I have that on my side. But there are plenty of other traders who have more subscribers on their YouTube channel and who are just exceptionally better at everything other than my beard and my hair. So my goal is to help each and every one of you who is watching this understand the why behind certain components. What we have done is we have created multiple steps that can be in your brain subconsciously that help you determine when a trade is setting up, AKA accumulation. That breaks down into a public participation that retests old resistance as new support, that has a hammer cannon with buying pressure, with an inside count that broke down. Set up risk reward entry, targeting your new low. Getting in, making money. Oh, man, that is good. Lucas says, but you are the best teacher. Trust me, classes are better than anybody there on the Internet, man. Thank you. I appreciate that. That means a lot. It really does. That's one of my skills. I know it, and I'm embracing it. And I love it. I love the fact that you're all here. So does this all work in a larger timeframe? Let's zoom out. We've already done it on Roku. Now. Now, this is. This is where things get silly. Do you remember this chart? Let's go back. You better remember this chart. Okay? All the money that you paid for those intermediate classes, you better remember this chart. Now Type in a 7 into that chat pane. If you can see a potential wave count now, your wave count will differ a little bit from mine. And that's okay. That's not a big deal. Can you force a wave count to create whatever it is that you want to see? Yeah, that's called opinions on everything. I think that's called life, right? Someone going, this is what I think is going to do because of this reason. And you postulate an evidence until you have evidence that you're going to prove wrong or you're too stubborn to see the other light anyway, you're gonna believe what you believe. That's fine. That's cool. Here's what I see. I see on Twilio, a one, a one, two, three. Now what does that mean? Well, as I was looking at the chart, it's really, really hard to find an actual two wave over here. Like, there is. There's small ones. There's very small fractals. There's a 1, 2, 3, 4, 5. Like, that's easy. Everyone. Their mom can see that. And then you have like an ABC wave right there. And that's the cleanest thing of all time. And then you have a 1, 2, 3, 4, 5. I mean, that's super, super obvious to see. You have an abc. I mean, that's like free money. Who didn't see that one? And then you have a 1, 2, 3, 4, 5. And that's like the clearest thing of all time. You would have to have coke over your eyes on to see that set up. But the overall point is on the big, big wave count, right, the really large fractal, there's no actual pullback other than this. This is the. This was the most shallow pullback that we got. Which means then, now, granted, is all this hindsight? Yeah, literally everything we're doing in hindsight and everything in trading is hindsight until you're making money. Okay, what we're doing is we're using the past chart to come up with a future plan. So what would this mean if you go back in time, October 2019, on Twilio, and you go, man, this is a really interesting wave 3. I wonder what happens after wave threes. I mean, this is a weekly chart. So what's likely gonna happen? Ginormous wave four. Now, the question that you have to ask yourself is, would I have thought that the Wave four was going to end right here. And what do you think the answer is? Of course. Of course I thought the wave four is going to end there. Why would I not like? Absolutely. So are you saying, Jeremy, that you lost money on this COVID 19 diploma? Yes, I did. Not on Twilio specifically, but just in general. Absolutely. Now, I didn't have any position on Twilio. In fact, I had a lot of positions in Cash in February because the markets were at all time highs. Just Twilio wasn't specifically on all time highs. So in order for this to accurately be a wave four, in order for me and my thesis to be correct, that this is a 1, 2, 3, ginormous wave 4, and this is a way 5, Twilio has to have made a higher high. Do you think, ladies and gentlemen, that Twilio has made a higher high? I don't know. Let's go find out. I do know the answer, so that's not really totally fair, but let's go check. Oh, boy. You guys, you're not even ready for this. I'm just gonna leave the drawing on the screen. I mean, come on. Oh, man, this newsome character. What is he doing? Sure, like, okay, cool. Dude, that's awesome. You're such a great hindsight trader Captain Hindsight. You should get your own commercial. When would you have gotten in? Let's go to the daily chart. Now, there's probably not any chart patterns at all in here that you'd have had any clue that this was going to bounce. I get that. I totally understand that. You would have been just absolutely in far left field and would have had no clue that it could have possibly bounced at this location. Because if there was some chart patterns that was like, hey, you know what? This is likely what's gonna happen when you get into the end of a chart. And I mean, I wish if there was only a way we could have maybe gone bullish on Twilio or I could have, or you could have once it made a new high and maybe retested that chart pattern. But since that didn't happen, there's no way to know that you guys could have played that trade. Especially with a big giant wave count on a weekly chart on Twilio that was literally perfect. So do you think Elliott waves work? And the answer is yes. What wave do you think we're in right now on Twilio? Now this is where it gets fun, right? This is present day. One, two, three. Most likely we're in a wave four. Almost undisputable now, this could be the top of a wave 5, which means this will be A, B, C. And if that's the case, if we take out this high C is over turns into a 1, which turns into the wave 5, which means Twilio goes higher. Either way, Twilio goes higher. Based on this count, This is definitely a wave three. Yep, for sure. Hands down. So I can tell you that Twilio will be higher in the future than it is today. It will. I don't know when, but I know it will. That's very interesting to say with that much certainty. And again, I have tons of money, but I can't beat everything. I can analyze charts. I can help all of you analyze charts. I can do this all the time in the afternoon swing trading room. If you guys ever want to join me there, go to real lifetrain.com, click on Live Trading boom and you can watch me do Elliott waves until your face is blue. I do them all the time in the afternoon swing training room. It's 199 bucks. I mean, this class alone. You think this class alone is worth $199 by itself? Imagine getting this class for an hour every day, five days a week, recorded. All right, Some of you are already in it. And for those who are not cool, you should though at some point. So now they definitely work on a larger term time frame. That's some of the wave structure. What about bearish waves? Somebody asked, does this work in bearish markets? What do you guys think? Yeah, of course it does. Yep. Type in A17 into the chat pane if you want to see a wave count on Macy's. 1, 2, 3, 4, 5 followed by an ABC correction followed by a 1, 2, 3, 4th, 5, followed by 1, 2, 3, four, five, followed by 1, 2, three, four, five, five, followed by a 1, 2, three, four million five followed by an ABC correction which turns into an ABCDEF failure. Stock is going to zero now. All right, so that's Macy's. Takes a lot of practice to get that fast. I know. Again, probably why I'm single. But if we're looking at Macy's, we're looking at charts. We can create this structure. We can create this pattern. We can create this ideal. We can over understand what's going on and why. So do you remember this chart? Yeah, you guys might remember this chart. This was the lulu chart from a while ago. So again, wave structure works on this. This is the hourly time frame. You have a 1, 2, 3, 4 and 5. Bop, bop, bop, bop,. Bop, bop, bop, really cool stuff. Now, honestly, this one, this is definitely the end of a wave 5. Made a new low. So this would be the 1, 2, 3. This is a 3, 4, 5. Now, there's one problem with that wave count. Who can tell me? There's a massive problem with that wave count. Huge problem. Wave 3 is the smallest wave. That cannot be correct. So if wave three is the smallest wave, then what does that mean for this count? What can that possibly. And again, that was an intentional. So what can that, what does that mean then? Well, it means it's off. So if it's off, what can we do? Ready for this? 1, 2, 3. So you're like, oh, okay, shoot. Well, this is just a two. Now we're in a giant wave three. Can that help you with your perspective on taking this particular trade on Lulu? I do that all the time. I'll do a wave count. Go. Wait a minute. That's just not right because of XYZ situation. So let me just recount. And boom, there it is again. You can make that so much more complicated if you really, really, really, really want to. And a lot of Elliott Wave theorists do, right? A lot of Elliott Waves will always do the sub fractals, like 1, 2, 3, 4, 5. I mean, that's such easy thing. Anyone could see that. And you have the 1, 2, 3, 4, 5. Everyone in the world, you can see that 1, 2, 3. So that can't be totally correct because it has to be a weight. Has to be a five wave fractal. So 1, 2. Yep. 3. We're gonna continue higher. That's kind of how I see things. That's just the way I play it. So as I'm doing that fractal, if I do a sub fractal and I can't find out the other wave, that would make sense. And I just go like I just did now. Well, looks like we're gonna continue this wave three then. Because when I went to do a wave one, two, three, there was no. There was no four, five. There has to be a four, five always. In my view of the world, call it Newsome wave theory. There always has to be a 4, 5 somewhere. So if you just have 1, 2, 3, you're off. Restructure it, make it go bigger. Pretty wild. Now, this can work on any market, any instrument. If you trade forex, if you trade futures, Type in a 7 into that chat pane. If you can clearly see a wave 3 already forming on this particular chart. Oh, no sevens. Nice. Or no threes. Forgot what I Said, you know how I can see it forming? Go on, check that volume. How about you look at the volume first? If that volume comes in. Remember I mentioned that wave threes have extremely strong volume, which stipulates that this is a one, this is a two, this is a three. So if this is a three wave, can you count five fractals inside that wave? Let's find out. 1, 2, 3, 4, 5. Yep, I can. So that counts. If I can count a 1, 2, 3, 4, 5, I can count a 5 fractal in any wave. I know I'm right. 1, 2, 3, 4. Yeah, that got close. But it did not take out wave two and then five. That makes sense. So, looks like we're in a wave three now. Is that gonna drive? Ladies and gentlemen, what do you think? Is that going to drive a bunch of Elliott Wave practitioners just up the wall? Absolutely, because they're gonna go. There's not. Your wave count's not right because you forgot the expanding flat. And you can't be. I. Bro, it's cool, man. Don't worry about it. It's all good. This is how I do Elliott Wave. Call it Newsome Wave Theory. This is how I do works, though. It works really well. I'm very, very good at these counts. I'm the best in the world at counting the way I count. Right? It can really, really help, because with this volume in my account, this is definitely wave three. Which means what? Which means be bull. Albert says, I wonder what the logic behind five waves and not six. Ah, the pondering question of math. Who wants to answer Albert's question? Why is it five and not six. Fib ratios? Leonardo Fibonacci. That was his name. Actually, I don't know if that was his name. I think it is Leonardo Fibonacci. But it's the math, Nature and math that come together. 0, 1, 1, 2, 3 5, 8, 13, 21, 34, and so on. The golden ratio, the secret math, all that kind of good stuff. So very, very good question, Albert. And that's why. That's why fibs work so well with Elliott Wave. So there's your continuation higher. All right, so if we're still here, you guys are still tracking with me. We got a 1, 2, 3, 4. So what am I looking at doing now? I'm looking at along. Is that going to be correct? I don't know. Maybe it will, maybe it won't. What if it goes lower? All right, well, I'll probably have to do a recount at some point. Now, again, for My wave. This is really fun. This is really, really fun for me. For my wave three, I have to have a five fractalization always. 1, 2, 3, 4, 5. Okay, Robin says, here's some history. The Fibonacci sequence was invented by the Italian Leonardo Pisano. Bellagio, not Bellagio. I don't know how to pronounce that last name. Biggiolo. Italian Leonardo Pisano, who is known in mathematical history by several names. Leonardo, Pisano and Fibonacci, which means son of Bonacci. That's right. Son of Bonacci. Go, Leo. And honestly, I don't think that math is. I don't think that historically is accurate. I think Leonardo di. Leonardo DiCaprio invented Fibonacci. But let's just say it was the guy in 18, the 1100s. I think it was my boy DiCaprio. But, you know, neither here nor there. All right, that was a bad joke. I don't think anyone liked that joke. So it turned out, yep, we're still in a wave four. We're still going a little bit higher. Very nice compression. Right. Would you all agree that's some beautiful compression? Really, really good sideways action. Good size. So are we still in a wave four? Most likely, yeah. How do we know we're in a wave 4? Based on Dow theory, Elliott Wave theory. How can we be in a way for distribution phase? So if we break out that distribution phase, what wave are we in? For sure we will be in a wave 5. Therefore, we should be doing what direction, ladies and gentlemen, Bullish. We should be looking at longs. Long is strong. Bang. Now, again, natural principles, right? All the principles are still here. Breakout, retest, continuation. Higher, like it's still there. All the normal curvatures, everything is still there. If you zoom in, this is a five minute chart. If you really, really, really zoom in, you can find wave five structures all throughout here. You can find tons of them. They're always there. But I just don't stress about that much. Right. Again, could you do credit spreads, bullpen spreads, put sales? Absolutely. Could you just buy a contract and be in it for a while? Absolutely. So we have obviously a way five. Then we have an abc, abc. And then we consolidate and then we trade sideways and we make another high. Now, after we make a new high and this is where we are at, what pattern are we in now? Lucas says this is five minutes. Yeah, this is five minutes on futures. So you have obviously a what type of chart pattern? We've talked about this previously. What do we got? Bring on the party. For the double top or head and shoulders, whatever you want to call it. But it's some type of reversal pattern also known as an ABC wave. ABC wave. So this is a ginormous one. All right, folks, true or false? Am I looking at shorting it right there? Yes or no? And the answer is yes. Did I short it right there? Yes, I did. I did indeed on this one. I have a coaching student whose name is Lucas. He lives over there in Poland. Shout outs to my boy Lucas. We played this short together actually, and he was quite pleased with the results. So. And you're welcome to go back and look at this. This is just a few days ago. You can go check out how that played out. But it went. It went lower. Not a lot lower, but a little bit lower. So how do fibs come into play in all this? Well, here's how fibs come into play. There again, at least my thoughts. If you are looking at playing fibs, once I can clearly find and identify a wave right in the past. Pure hindsight. We're going back in time. Hashtag Minority Report. Hashtag Tom Cruise. We're going back in time. Hashtag Marty McFly. Hashtag what's his real name? Shoot, I forgot his real name. Lucas says. So funny. I'm also Lucas and I'm Polish. Is that you? As? I don't think it's you though. Is it Lucas? Not me. Okay, so there's another one. Does your last name start with an L? He goes, no. S. Alright, so there you go. That's very funny. Do you live in Poland? Because the guy I'm talking about lives in Poland. He goes, I'm in New York City. Oh, I got you. Okay, got it. Got it. Michael J. Fox. Thank you, John Ax. I appreciate you, man. That's called trying to figure out something you don't know in your brain quick enough. Anyway. Michael J. Fox. Hashtag Michael J. Fox. We're going back in time. Once I can clearly identify a wave in the past, I use a wave structure to find a target. Or once I can clearly identify a wave, I can use the previous structure to help find where I should buy something. What am I talking about? Let's go back to this chart on Lulu. My friends ask a pretty basic question on Lulu, can we agree that this is an obvious wave? Now, again, it's in hindsight I realize that. Understand it. I get it. But using hindsight will help you understand how to see a wave. Once you see a wave, you can create a image chart and Fibonacci extension for that wave. So this is kind of what that looks like obvious wave on Lulu. And this is that wave created into a Fibonacci sequence. Now, all I'm doing, my friends, is I'm taking that wave, and I'm saying, how far can the momentum of that wave take us? That's all I'm asking. I'm asking how far can that individual wave take us? Now, when you create a wave, when you identify a wave, would you be shocked to know that waves retrace oftentimes to a Fibonacci sequence level? Would that be massively surprising to find out? The answer is, well, probably shouldn't be, because it's just natural math. It's nature, the math of nature. So what it does is it will trade back up to a fib level, either.7, 8, 6.61, 8.5, or 0.382. And if it fails at one of those levels and starts going lower, then you can assume with a pretty high degree of certainty that you're going to start hitting some of these fib targets. And you'll notice that we gapped right over the 1618, and we gapped right over the 2.236, which means we're probably gonna hit the 2618. And I don't have the 3 extension on this, but the 3 extensions right there. And that would have hit very nicely as a little bit of a target, just as a general basis of expecting what to do. Now, again, you'll notice right around here that these levels will represent where you would have shorted or could have shorted on the pullback if you have noticed that that wave occurred. So this is the exact same chart that we're just looking at, is the exact same company, same timeframe, and everything. All I'm doing is I'm taking off the right side. So I don't really know. I'm not entirely sure where we're going. So what I'm going to do is very simply ask myself, okay, where is a very clear wave over here? Bullishly, so they can help me figure out where we might be going. Is there a very clear wave? And I would argue that from here to here is a very clear wave. We can agree this is hindsight. I get that we're using the chart to find a wave so that the waves can help us create an idea and a target system of where we might be going. So that if you want to know where white this trade go, you can create a fib extension, and it will tell you where you're likely going to go. So you can finally help create some targets and help Understand where your 2.4 Rs or where your. Where your targets might be based on simple Fibonacci math and extension. When I say simple, it is simple because it's naturific. That's definitely not a word natural or organic. So in this particular example here is a fib extension of this wave structure. So I took that wave structure, that exact wave, and said, yeah, looks like it's very, very clear. Ending and beginning. Lucas says the system can calculate this automatically. Oh, yeah, that's easy. So, remember, we talked about the wave structure. We talked about waves and 1 and wave 2, wave 3. So we have a very, very clear wave. We know it's hindsight. And we can also say, right, we talked about this just a moment ago. We can also say that this could be a one, this could be a two, and this could be a three. Would you guys all agree? Well, if this is a 1, this is a 2, and this is a 3. Wave 3 is generally at least 1.618 times wave 1. So could we come up with a potential target for Lulu? Ladies and gentlemen, based on that normal calculation of where this might go, the answer is yes. It's automatically plotted for us. There's a large chance that we're going to hit $244.90. So could that say, all right, well, I'm gonna hold until we hit that? Yeah. Now, will it hit it? Sure. Sometimes it will, sometimes it won't. Eventually, if you found the right wave, it'll hit your extension of your wave. The question is, are you measuring, like, this wave? Are you measuring this wave? Are you measuring that wave? Right. All those waves can be measured. It just depends on which one you're measuring, which one you're looking at, what your time frame and what your perspective is. All fibs do is they give you an idea of what's going to happen. This is what happens on Lulu on that exact same wave. Present day. Now, if you're not a little spooked out by that. I mean, I always am spooked out. Like, look how well those fib levels acted as support and resistance without drawing any other lines other than fib. I mean, look at that. So, again, you might. Well, Jeremy, this is cool and all, but how do I make money with that? Are you kidding me? How do you make money sell at that level, Lock in a profit and, oh, well, look, it's pulling back to my other fib. Old resistance, new support Let me buy a share there just in case it bounces. Okay, cool. Oh, it bounced again. Trade to that target again. Let me sell it there. Oh, wow, it broke out. Where's my next fib, man? Doesn't look like there's another one up until here. What should I do? Well, I'll hold till there. Boom hits there. Boom hits there. And now we're pausing at the 2618. This is the present day, most present day chart of this setup. Lucas says, wow, that's cool. I think it's so cool. But again, this is an all time high. Lulu has never been this high. So remember at the beginning I mentioned that I like to use fibs to help me understand and articulate how and where things can be and how they can be place at an all time high where your targets might be. Rather than just guessing, you could use fibs. So let's go look at some real life examples. And this is trendspider. So go ahead and throw some stocks out at me. And what we'll do is we'll just start practicing and we'll do five or six minutes. Victor, you can use a line chart. That's fine. Amy says Boeing perfect one. Amy. All right, Amy, what wave are we in right now? Let's see how quick Amy can get it. What wave are we in? Amy says 3. You are correct in my opinion. All right, so that means that this is wave one and this is wave two. Would you agree with if this is wave one right here, that means that Boeing is ultimately going to hit $246.15. Did Boeing stop at a fit level, a fib level today? It did. Right? The 1.236. It kind of paused a little bit of fib level. Based on this math, based on what we can expect and based on our Elliot wave, do we have a general idea, Amy, of what could come next? If this is a one and this is a two and this is a three, three could go all the way up to here. Or this could be the subset of 3. 1, 2, 3, 4, 5. So would it help you to not be afraid of buying the next dip if you're like, well, based on this math, it looks like we probably will dip and I'm gonna try to buy it and then we go higher. And based on that, I think we're going to trade into 246.15. Does that seem reasonable? I mean, does that give you an opportunity to go, yeah, I think I can create a plan based on the analysis we've learned. So far, again, you don't have to, but maybe we can. That's what's really, really cool. You don't have to use any of this. I don't use fibs unless we're at all time highs. Very, very rarely use hibs. But I can tell you Boeing is in a wave 3 of 3 and it will go higher over. John says, do you look at the fib on the wicks of the move? You can use the wicks or the body and just see which one you kind of like the best. I generally will do the wicks, I'll do the body, I'll do a little bit of both. So if I use the body of the move right here and go to the body of the move right here, you'll get very, very similar information, but it will change the number some. So I would say it depends on how aggressive you are. Now here's the crazy part. If you use the bodies of this, look at how well we trade down to this fib and bounced. Now, honestly, really realistically, ladies and gentlemen, that means jack squat. Unless you bought there, alright? The fib levels are irrelevant unless you start buying at these locations. Because if you're, if you're trying to find out how far a stock can pull back, you need a wave structure first. And once you have a wave structure you can create and you can do it on any time frame and on any, you know, bullish or bearish. So let's say that you have a bearish perspective on Boeing. All right, that's fine. So let's say you're really, really bearish on Boeing and you want to create a fib fib retracement that starts, sorry, let's say you have a fib retracement that starts here and ends here. And you're like, I want to short this thing. Okay, so if you want to short Boeing because you're bearish on Boeing and you want to create a fib based on this natural wave, do you have, ladies and gentlemen, a price based on fibs where you could short. What are you saying? And the answer is, yep, 250. 78, boom. Now, will that do you any good if you don't short there? No. But again, when you're looking at fibs, that's all fibs are, is they're just lines of math where human emotion is going to be naturally reoccurring. If you're looking at a particular chart and you have a particular bias or tendency, create your strategy and plan based on that bias tendency and then kind of play it from there. I have a bullish bias tendency on Boeing, so I'm gonna have a little bit of a bullish perspective. Now. Can I create the exact same fib I did earlier and put it there and then put it here and go, oh, wow. So you're telling me that the 1618 extension of my bullish wave is the exact same? Almost to the penny price of the point. 628 Retracement of the bearish wave. Holy moly. What do you guys think? Would that be a good spot to sell? It's crazy. So cool. I'm getting a bunch of wows in the chat pane. Yeah, mind blowing. Indeed. Mark says that's how fibs work. I know, it's crazy. So, again, none of that actually even matters, though, if you don't take advantage of it. So you either have to know a target or you're. You have to use it for some reason. You have to use it for some rationale. You have to come up with some level and some reason why you're doing it. And then based on that plan, you, you know, attack. Cool. Deal. All right, sounds good. So again, folks, I could do this all night long on every chart out there, every company imaginable, almost. Let's do it on Netflix. Sure. The Netflix. What waves are we on Netflix? So I'm just gonna look at this chart right here, and I'm gonna go 1, 2, 3. We're in a way 4, which means wave 5 will come at some point. If that is accurate, then this wave 3 has to have subsets of 5 waves. 1, 2, 3, 4, 5. If this is accurate, it has to have a subset of five waves. 1, 2, 3, 4, 5. If that wave five is accurate, it has to have a subset of five waves. 1,2, 3, 4, 5. 1, 2, 3,4, 5. 1, 2,3, 4, 5. Oh, I'm so good at this. It's frustrating. I love it. Get jacked. So now what? I mean, what are we going to do? Well, it's like. Well, this is. This is a big wave four. So if we're in a distribution phase, what strategies have you learned that can make money and the stock went straight sideways? Or, you know, you can sell puts, do bullpen spreads, buy a lot, buy shares, buy longer term calls. Netflix will go higher. Here's a weekly chart. Weekly chart. Does it look like we just are working on breaking out of a wave four. To some magnitude? To some degree, I could argue, yes. I'm telling you like this is a wave four. And this is a breakout of a wave four. Like Netflix will be higher. Ben says Spy. Oh, spy is even easier. Spy is super easy. It's called. I have no idea what this is. I'm just kidding. The only thing that makes it the only thing that makes sense on spy. The only thing I've had many, many, many, many, many wave counts on Spy. And so far, they're all pretty close. 1, 2, 3, 4, 5. A, B, C, 1, 2, 3. So we're gonna have a. We're in a 3, which makes tons of sense to me. We'll have a four pullback, and then we'll make a five, which will mean we'll make new all time highs soon. And if that's correct, that means that each wave must have a correct wave 5 subset. 1, 2, 3, 4, 5. 1, 2, 3, four, five. 1, 2, 3, Four, five. 1, two, three, four, five. A, B, C, 1, 2, 3, 3, 4, 5. And there's a problem with that wave count. The problem with that wave count is wave three is the smallest, which means you have a 1, 2, 3. And that cannot be a four, because four cannot break the lows of two. And now I go all the way back to therefore, this has to be a one. This has to be a 1, 2, 3. Now, is it shocking that we're so bullish? Not really. I mean, call it Fed, call whatever you want. But again, this is how I. It makes me sleep better at night. It's just how I create it. My version of the world. That's the way the market looks. And I've always had some good wave counts on the markets, and the wave counts I've done very frequently until this Covid crash. This was the end of some type of wave 5 or wave 3, every one of them. So as we're just going up, up, up. I mean, guys, come on, look at this chart. We were just going up, up, up, up, up. Let me look how steep it was. You know, like, that's not natural. Like, you can't just have this crazy, crazy, crazy run up forever and ever and ever and ever and ever. Megaphone pattern. Yeah, makes sense. Lucas says, can you put a Fibonacci on the spy? I definitely can. So we're gonna have to use a current wave. And the only wave I can use right now on the SPY is the daily chart. And the best wave I can find is from here to here. Flip this around. Okay. From there to there. And There is your 2, 6, 1, 8, target. 3, 3, 4, 8, 7. Now look how well it respected it. What is 1618 extension? Look how well it extend. Extended all the fib levels on the fib. Look how perfectly it pulled back to the 618 of the 1. I mean, look at that. Look at this right here. Incredible. This is gonna be the next target. 3, 3, 4, 8, 7. We'll get hit on the spine. Wrap it up. You've heard it here first. We're getting there. We're not gonna get there tomorrow necessarily. We're gonna get there. Lucas says so cool. I. I think so. So, again, I know most of you here right now are a part of the training rooms and a part of your life training. If you have made it through the beginner, through the intermediate, and through the advanced, that's where you can or should go from here. If you want to do this as either a career, as a side hobby, as a. As a. As a side hustle, as just something you're going to play around with, you know, we have a day trading room. We have a swing training room. We have the weekly options newsletter. Go on the website reallifetraining.com and check out all of our material if you would like to. I'm gonna answer some questions, and then I will tell a story, and then we will be good to go from there. Jay says it will be a career for sure. Gorgeous, man. I mean, it's been my career for like seven years. Seven, eight years. Ish. So love to do it with you. My friend Nathaniel says thank you. All right. My pleasure, My pleasure. My pleasure. Gorgeous. Cool. Well, not. Tons and tons of questions are coming in. If you have any, just let me know. I'll wait for another 20 seconds for one to come in. Lucas says no questions. Need practice. Yeah. Chris says, this was awesome. Thanks so much. Oh, man. My pleasure. You're so welcome. My honor to be here. The reason I'm going through all this and the reason I'm bringing all this up is I want to just help enrich lives and ensure that each and every one of you gets a really good idea and understanding of how to use the markets to grow your net worth and enrich lives. Jay says, do you use fibs all the time? I use them in my mind, Jay. I use them so much. I've used them so much that I kind of know where most of the lines are going to be naturally at this point in my life. But, yeah, I do use fibs early on a lot. Yep. Matt says, can you say two words about the importance of back trading? Two words and the importance of back trading, man. Extremely valuable. Extremely valuable. Back trading is like practice in every other sport. Every sport has practice. If you play football, you're going to have practice. If you play baseball, you're going to have practice. Boxing practice, mixed martial arts, anything. If you're a chef, you. Anything to do to make you money, you've got to go put in a little bit of time and practice. It doesn't have to be 400 hours a month. Okay? It doesn't have to be an insane amount of time. It can be. It's up to you, but get in some time. Back trade. Do what I've done. If you look at me and go, man, I think Jeremy's the greatest chart technician in the world. I wish I could be like him. You're going to be better than me because I'm teaching you and you have a head start. Every one of you is going to be better than me. I'm just the person that's going to help you and assist you and guide you and mentor you and coach you. You will be better than me for sure. Just put in the time, put in the energy, put in the work. Lucas says, do you have some classes about how I can learn more about candles? Yep. Have you gone through the back trading marathon, Lucas? Have you done that? Victor says, yesterday was phenomenal. I bought some shares at market price today. No stop, loss and target. Is this the right time to set up for long term? So again, Victor, it's always the right time to start doing it. Just nibble. Right. So your next time might be a month and a half from now or four weeks from now. So, yeah, I agree with you. I think it's a great time just to slowly start nibbling. Nathaniel says, what book besides yours would you recommend? Man, there's a lot of good books out there, dude, a lot of them. I'm trying to think of which ones are actually exciting and relatively entertaining. The ones I have on my. On my bookshelf over here. How to beat Wall Street I think is good. So simply call it how to beat Wall Street. Stock market logic is a good one. Stock market logic. Anything by Dr. Van Tharp is probably a must read. So Dr. Van Tharp, quite solid. I plan on in the next five years writing a book better than Trading in the Zone. But Trading in the zone is quite solid. I think that's a good one by Mark Douglas. Pretty much a must read. Trading in his own. Very good book. I agree. Trying to think. I mean, honestly, man. Money Master of the game by Tony Robbins. Solid Book. It really is solid, solid book. Lucas says the Back train marathon. That's what you recommend, right? That is correct. Oh, do I like Thomas Bullowski for chart patterns, David? I do. If you're a statistician, math nerd. You really like the numbers of things? Absolutely. He spent his entire career doing that, and, yeah, I can respect that. So if you want a lot of stats, a lot of numbers on chart patterns, Thomas Pawlowski's encyclopedia, chart patterns, all of his books are really quite nice, if you like that kind of thing. That's your. That's your jam. Beautiful, beautiful, beautiful. All right, story time. I worked with a lady a few years ago, let's call her Diane. And Diane lives in California, and she reached out to me for some coaching and some mentorship, and she's like, jeremy, I'm actually doing okay trading. I just want to do a little bit better. I'm doing okay trading. I just want to do a little bit better. That's one of my favorite. I love. I love that one because that's a pretty easy thing. If you're making a little bit of money. You just want to, like, next level it. Optimize your performance, surge your growth, get to the next plateau. Those are always fun because then it's just a mind game and getting out of your comfort zone, that's actually a pretty easy. Pretty easy update. So I was like, okay, Diane, let's talk about it. How much are you making right now? How much do you want to make and why? She's like, well, right now, I make about somewhere between two to $3,000 a month on average. Some months a little bit better than others, but that's kind of what I'm doing. I'm like, what's your strategy? And she's like, honestly, I just kind of like, buy low, sell high. I follow you in the swing trading room, and if I see a chart pattern that I like, I'll kind of like pile into the trade. And if it's one that you suggest and one you talk about, I'll kind of go in a little bit heavy. And, you know, it's worked out. You know, you pick some good winners, you pick some losers, and I'm doing okay. Make about 2,3000amonth. I'm like, right on. Awesome. So how much do you want to make? She's like, well, I'd like to make 20,000amonth. Like, well, sure. Who wouldn't? Yeah, of course. You just want to 10x what you're doing makes sense. Why do you want to make $20,000 a month. I mean, $20,000 a month sounds awesome. And you know what she said? Diane says, well, it's because I want to own my own vineyard. And I think that's how much it would cost to operate and run one. And I was like, wow, you want to own and operate your own vineyard? As in, like, wine? And she said, yeah, I want to. I love wine. I love everything about it. I like the atmosphere. I like the experience. I like all everything. I just want to own my own vineyard. I can just see it in my dreams. I really want to achieve it. I think if I can make $20,000 a month, I can get there. I said, heck, yeah. I love that. That's amazing. When's the last time you've went to a vineyard? She's like, well, you know, not too long ago. I go to vineyards all the time. Because she lived in California, so she did the whole Wine Valley situation pretty frequently. I was like, well, that's awesome, Diane. When do you want to do this? And she's like, well, I'd like to do in the next four to five years. I was like, okay, that's a relatively realistic goal. Where's your vineyard going to be housed? She's like, I want it to be in Italy. Oh, man. Okay, Italy. You want to have your vineyard in, like, in Italy? She's like, yep. I'm like, wow, that is a dream, and I love it. Good for you. When's the last time you went to Italy? And what was her answer? Never. She had never been to Italy. So she had this beautiful, gorgeous dream, this massive, aspirational mountain that she wants to attack and she wants to trade to make money so that she can do that thing. And I gave her some advice that she did not think that she would get from me. I go, diane, it's not specifically your trading that needs to become more. More affluential so you can progress more and make more money. If that's your ultimate dream, you need to make that dream more crystal clear and more precise and more specific, and the money will come find you. She goes, well, that doesn't make any sense. What are you talking about? It's going to come find me. I go, well, when someone has a goal, when someone has a very, very specific direction, an incredibly crystal clear, they can feel it in their hands. They can taste it. They know what it looks like. They know how much it costs. They know how much it weighs. They know how it feels on their shoulders. They are in it and living in it. When that person Gets there, money is the least of their concerns. You just got to trust me. I said, keep trading. That's fine. But here's what you should do with your trading. What you should do with your trading is find ways to begin to finance your dream now. Not four years from now, but right now. She goes, what do you mean, finance my dream? I'm like, well, if you're gonna own your own vineyard, you should probably know a lot about wine. Are you a sommelier? She goes, no, I'm not. I'm like, okay, well, go become a sommelier first. I don't know how to spell sommelier, so I'm not gonna put that on the screen. She's like, okay, cool. But I can still trade. I'm like, yeah, of course. Keep trading. So two months later, we have another session, and she's now studying to begin, you know, to get her sommelier certification, I believe, or license, whatever it is. One or two. I'm like, okay, cool. How was that? She's like, good. I'm like, how was your trading? Oh, it's the same. Awesome. But you made enough money to pay for all that right now, like, you don't have any issues, and, like, that's all behind you. She's like, yep, awesome. Beautiful, beautiful, beautiful. What's next? I don't know. That's why I'm here. I was like, well, we now need to get you some experience managing a vineyard. She's like, what? Like, well, yeah, if you want to run your own vineyard, you got to know a little bit about how vineyards work. I don't know anything about how vineyards work. And the only way you're going to know anything about anything works is to be in it a little bit. And she goes, yeah, but I have a job. I can't just quit my job. Like, no, but, Diane, hello. You have a little bit extra money. Do you think that you could work 5 to 10 hours less a week? Just 5 to 10 hours or less a week. And if you do that, you can then substitute that time to maybe work part time, super part time on a vineyard as just like a. Whatever type of position. And she said, yeah, maybe I can do that. I think that makes sense. I'll get back to you. We'll have a phone call. So three weeks later, we have a phone call. She's like, yep, I can do it. Five to ten hours. My boss said that I just need to be more productive and that since I'm salary, I still got to get my work done. I still got to get everything Accomplished. So some weeks I might work a little bit more, and some weeks I might work a little bit less. So I get all my work done and still go to the vineyard. I was like, okay, awesome. Then that sounds great. Have a fantastic week. Now. What happened at her work? Any idea? Well, she became more efficient because now she has to do same amount of work in less time. What happens when employees become more efficient? Any guess? It was really cool. She got a raise. She got a little bit. Not a lot more money. She got a little bit more money. She called me randomly, like, hey, Jeremy, random thing happened. I got, like. I got a raise at work. It's the craziest thing ever. I'm like, oh, that's cool. Well, she didn't call me. She texted me that. I was like, oh, awesome, Dan. That's amazing. Why is that? She's like, you know, my boss said I was working really hard and blah, blah, blah, whatever. And boom, she got a raise. I was like, oh, that's awesome. It's really cool. So now she's working less, she made more money, and she's still trading. Well, what's starting to happen for Diane, her dreams are starting to slowly come true. The gears begin turning, and she goes, wait a minute. I think I could do this. She had to put herself in that position. Putting herself in that position required time, required work. She had to. You know, she worked with myself and other people. Wasn't just me, right? But she. She really slowly began to think about it. And then four or five months later, we had another session, and we started talking about her trip. Her trading was still doing okay. Nothing crazy, two, three thousand dollars a month. But she. Now she's making more money at work. And guess what she's doing at work was paying down her debt. And as she paid on her debt with more work, what was happening? She was becoming happier and less stressed. And when someone becomes happier and less stressed, what begins happening? Well, the week before she had a session with me. She made the most money she's ever made on a trade. Eight hours on one trade, flipping out, super excited, wanted to celebrate. She's like, how should I celebrate? What do you think? I'm like, well, I think you should go to Italy. Italy? Why? Why Italy? Well, that's where you want to have your vineyard. She goes, yeah, but I'm not ready to do that now. Like, I'm not gonna have it. Like, that's like three, four years from now. Like, well, yeah, but you. If you've never been to Italy and you want to own your own vineyard in Italy, you need to go to Italy so you can get there. Be around the experience, be around the culture, get it, understand it. She goes, okay, cool. Boom. Flies Italy. And I made her fly first class. I made her. I say made her. I was like, listen, Diane, you have to do this. You have to fly first class. You're not going to want to. You're not going to like it. It's going to be super scary. You're going to spend so much dang money on that ticket. It's going to be like $4,500. Just got to fly first class. This room. San Francisco. San Francisco. No, no, no. What's in San Francisco? Hold on. La. She lives in la. I was like, all right, she got to fly from either Burbanks or lax. Or Burbank. Lax. LAX to wherever. Boston, Boston to Rome. Wherever she flew into. I don't remember. I think it was Rome. Either Rome or Naples. Anyway, she flew first class. Did she hate it or did she love it? I mean, come on, if you fly first class, you love it. She loved was amazing. She was scared and terrified to do it, but she had never done it before. I mean, not many people fly first class. It can be pricey, it can be very premiumly priced. But she did it. She got over there and she had a blast. She loved Italy so much. Fast forward another year. At that point in time, she came back over to the States and asked for another raise at work and got it. She got a raise at work and began working even more efficiently on a project that she even liked even more and was still doing her vineyard thing at the usa. But during all that time, she was trading a little bit better. 3 to 4000amonth. Sorry, 2 to 3000amonth. Slowly started becoming 3 to $4000 a month over that year. So she start. She did she 1 1/2 x. She increased from 2 to 3 to 3 to 4. But now a year and a half has gone by. We work together from 2014ish to about 2016ish at this point in time. Two and a half years go by and she has almost no debt now. Almost no debt. I mean, very, very little debt. Like a house and like a car. You know, the normal debt. House and car. 2016. She has her job. She's very knowledgeable about wine now and she does the part that's still scary for anyone. What part is that? She does the leap. And this is the part that is never easy for anyone, regardless of how much Money you have. Sure. Quitting your job might be, I mean, if you got $100 million in the, in the lottery, great, you're going to quit your job. That's not, that's not going to be scary. The leap, if you won lottery, would be keeping it. That would be the leap. Keeping your money. Her leap was quitting a well paying job and she's only making $4,000 a month trading and she's only making X amount of dollars at her sommelier online, you know, whatever she's doing at the vineyard. I mean, small, small money. So she's living in LA, California, making, let's just say $5,000 a month. Is she terrified? Terrified. Absolutely. Mortified. Does not want to do it. Unquestionably. Could not even think of a worse idea. And I said, simply said, diane, here's the thing. You have one shot at this. The reason you have one shot is because at this stage in your life where you are and where you've been and where you want to go, if you don't do this, you will never know what happened and you will have a regret and you will have a fear and you have a what if? Because, Diane, true or false, you can always go back and get your job or get a similar job paying something similar. Am I right? And she said, well, maybe I have a very specific element. No, come on, Dan, am I right? Well, you know, come on, like, yes, okay, I could probably re. Get my job or if I really begged for it, I could probably. Okay, so your worst case scenario is you try something for a little bit and it doesn't work and you more or less do what you're doing now, that's your worst case scenario. It's a no brainer, my friends. If your worst case scenario is you're kind of doing what you're doing now, except with less money, You have to do whatever it is that you're trying to do. Just think through worst case scenario, really plan it, really figure it out. If you're absolutely. Worst case scenario is that you're doing what you're doing now, but with less money, Phenomenal. Go do that thing then. I have to remind myself of this very frequently when I'm in the market and the markets are bad, when they're just punching me in the face, when I'm in round 10 and Mike Tyson is just throwing haymakers right into my jaw and I'm just stumbling around scared, weak, feeble, losing money left and right. It's like I just have a flamethrower and I go to my bank and I'm just burning all the money in my account. There are days where it feels like I'm just taking straight up lighter fluid and pouring it all over my wallet and just lighting it on fire. Because every trade I take, I lose. I just can't feel like I'm doing anything right. And I have to remind myself of all of this. I have to go down and remind myself, what is my worst case scenario? Let's say some weird thing happens and I lose all my money. Everything. All of it, all the stocks, every liquid piece of cash to my name is gone. Now, if I lost all of my money. And let's say the physical stuff, too, okay? Not even the stuff that's on the Internet, but the physical things like the silver and the cash I have in my safe and just all the physical assets. And then let's say for some reason, I lost my house, too, okay? So I got a home equity line on my credit, on my house, and I put all that on the trade. And I lost millions just on one trade. Millions. Which, sure, I guess it could happen, but I'm losing everything. Gone, one trade out, nothing else. And my credit cards don't work either. You guys get where I'm. You see where I'm going with this? Okay, so now my credit cards also don't work. I've already maxed them out. There's no money. I have no access to anything else. What could I do? All that happens, what could I do? Joseph says I could go back to selling insurance. It's absolutely factual. I could do that. But at this point in my life, I could simply pick up the phone and call one of thousands of people and say, hey, do you think I could come stay with you, hang out with you for a week, maybe help you trade your money? Maybe just sit right beside you and just kind of hang out with you and just me and you trade together. Type in a 1 if you'd be down for that. See if there's any people out there. Joseph says, call me and I can hang out. All right? So I got one, and there we go. I got a chat full of people that I could just call on the phone right now and hang out at your house. I've lost everything. And now me and you are friends and I'm hanging out. One of the people who's very special to me is a gentleman named Johnny Guarca who lives in Hawaii. And honestly, my friends, one of my worst case scenario, One of my worst case scenarios, ladies and gentlemen, is I could just go trade with Johnny in Hawaii. I've already got a place to stay, I've already got a room. My worst case scenario is I just go over and trade with him in Hawaii. You know, like that's the worst case. That's it. So the thing is, I remind myself of that, ladies and gentlemen, because it's like we can't be afraid of our worst case scenario if we know what our worst case scenario is. Because you don't fear what you know. You fear what you don't know. Therefore, you are not afraid of your worst case scenario. You are afraid, ladies and gentlemen, that it might actually work, that what you want to achieve might actually occur. It's not our fear of failure that holds us back. It's our fear that we will become successful beyond all measure. Marianne Williamson. It's not our darkness that scares us, it is our light. Ladies and gentlemen, at this exact moment in time, Diane lives in Italy and is the manager of a phenomenal vineyard. She does not own it, but she is very high up. She works with the managers every single day. She's the happiest that she's ever been. And guess how her trading is doing? It's incredible. It's better than ever. She's making tons of money. Four to $5,000 a month, right? Which is double what she was making five or six years ago. Four to five thousand extra dollars a month by pressing buttons. And she has the job of her dreams. And in four or five years from now, she most likely could have a full on vineyard of her own because she took a certain amount of steps and asked a certain amount of questions and worked with a certain amount of people who have done and taken that leap. So, my friends, if you're at a spot where you want to leap, reach out with other people and connect with them. Connect with people who have taken that leap of faith. Because what if you fall? But, oh, what if you fly? My friends, thank you so much for being a part of this program. I absolutely appreciate it and it is incredible that each and every one of you spent so much time with me. Thank you from the bottom of my heart. I truly appreciate it. I appreciate your energy. I appreciate your time. Thank you for enriching lives with me. Thank you for being a part of this community and thank you for helping me enrich lives all across the world. Real Life Trading will become a globally household, recognized brand that helps all races, all religions, all social, economic backgrounds. We will help everyone who wants to be able to achieve financial freedom. We will give them that path. We will give them that direction, and we will give them those opportunities through knowledge, through growth, through progress and passion. My friend, it's been an honor. Have a great rest of your night or day. Wherever you're watching this, or whatever time you're watching this, you are amazing. And until next time, love life, live life, and trade it. Bye.