June 6th, 2024 Ultra Wealth = Chart review!!!
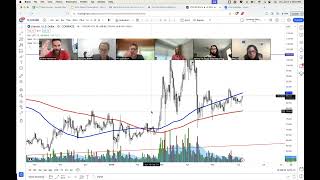
YouTube session (Jerremy Newsome, participants) reviewing live trade setups across crypto, futures, stocks and forex. Major segments: Litecoin technical walkthrough using multiple timeframes and moving averages (monthly→weekly→daily→3-hour→15-min), rationale for limit orders and holding vs trading; E-mini NASDAQ futures (NQ) tactics emphasizing trend definition on 2‑hour/3‑min charts, tick/point math, and leverage/scalping advantages versus equities/options; brief stock reviews (Palantir, Tesla) and a EUR/USD forex scan. Teaching focus: moving averages (10,20,50,100,200), timeframes for trend and entries (monthly/weekly/daily/2‑hr/3‑min), order types (GTC limit, stop entries), and practice homework (post charts, try varied timeframes).
Questions this video answers
$88.66
$87.18
$106.77
127,000 Litecoins per day
Current total ~ $2.5 trillion; prior all‑time high ~ $3 trillion (Oct–Nov 2021)
Chapters
Go look for some trade setups. That easy, that simple markets are open. And the cool news is 24, seven markets are always open. But we can look at, we can always look at stocks. Stocks are always an option. Options are always an option. And I will definitely just kind of go and review some cryptos and look at which. What my thoughts are. Let me and I really quickly share that chart that I posted at 2 in the morning. This one. So this is. You might be able to notice it, but it's the. The having chart. So generally, bitcoin having is essentially how it reduces its supply by half, because that means that half the available crypto bitcoin blocks have been mined. And so it just continually reduces the supply. So anyway, that's what this blue line is. And this pink box is generally the amount of time that it takes after the having for a move to occur. And generally what I've noticed is, at least historically, it's relatively bullish about them. Two months after the having, that's how long that pink box is. And that's kind of going back in time. And just looking at previous times that bitcoin has done this. And the expectation is that, you know, if we take out that $74,000 price point, we should have a nice little pump. But we could and very well might get one more dip. This is the most likely scenario, in my opinion. This particular one where we get just one more nice little dip and, you know, go from there.
So I like the other one better.
Me too. So here's the next one where it just keeps crushing, makes a new high, right? This is where everyone kind of fomos in and then it has like a 4 or 5% dip and then. And we just keep crushing. So that's, that's second to most likely. Obviously, that'd make it easier. But just being aware that this is still kind of my expectation, I. I still think that we can get some nice moves into 80 or 90 as the year progresses. And it can very, very likely that we hit 100 by the end of the year. I think, I think 80s, I mean, essentially guaranteed, which. Which is still a pretty good return depending on where you're getting in. You know, like if you got in at 60,000 back in May, that's still really good. So that's just kind of an explanation of that particular chart. Two of you reached out to me and told me that you really liked the. The review of how I kind of like, looked at everything. So what I'm going to do is do two things. I'M going to have one of you pick a stock. I'm gonna have one of you pick a futures. I'm gonna have one of you pick a crypto. And then when we pick a Forex, and I'm just going to kind of go through the whole process and I'll post the trade that I analyze from this little session so you can all kind of get again. Just kind of see the blending effect of everything that I do is really just a combination of everything that we've all learned together so far, either in this class or just the culmination of us spending time together in different classes. So I'm gonna have. Catherine, what time is it over there for you? Is it like four in the morning?
No, it's five. That's not too bad.
He's just getting up, getting after it. Early bird gets.
Yep.
You choose which one you want to pick, Ms. Catherine. Stock, crypto futures, or forex?
I'll pick a crypto. Can I just ask you something on that? With you saying about Bitcoin with the halving and then where you see it going, does the other bitcoins, do they move in the same way? I mean, the other cryptos, do they then move in the same way as bitcoin? Does it dictate at all?
Great, great question. Sometimes yes, sometimes no. I mean, I know it sounds kind of weird, but really, bitcoin is the granddaddy, it's like. Or the grandmother, you know, whatever does. Generally, most of the cryptos will follow. So if bitcoin starts to pump, very often what happens is bitcoin starts to.
Move.
Then Ethereum starts to move. And when Ethereum moves, the altcoins move. Altcoin stands for alternate, or alt. Yeah, alternate coins. So essentially, bitcoin moves first, then Ethereum, then everything else. If Ethereum moves first, then altcoins move, and then Bitcoin moves. So all coins all follow Ethereum because most alternate coins are on the Ethereum blockchain. But if bitcoin is strong and really pumping, it does bode well for other cryptos. Litecoin, which I know me and you have a decent position in, and it's looking good. It's not bad. Litecoin kind of does its own thing. If, if Bitcoin and Ethereum move, litecoin will eventually follow. That's. That's the good news. It's kind of like a matter of time. And so if, if you're getting a good bitcoin pump and you go look through other cryptos and they haven't moved yet. That is like almost free money. Because what's going to end up happening is people are going to start selling some bitcoin, taking some profits, taking their profits and then reinvesting it into some of the altcoins. And that's very, very likely a good, good setup for, for anyone who's looking for a good trade. Okay. Okay, cool.
Well, can we go with Litecoin then for me to how you.
Yeah, go into that one? Do it. Absolutely. So pull up crypto. And so what I'm gonna do is I'm just going to start with all and just start and just show you again kind of the process that I look through everything and I always start with the long term moving averages because I still think those are the most important averages, the 100 and 200. Now the homework that I would love some of you to do between now and Monday is just practice different time frames and post those different time frames on as a chart in crypto. So since it's truly, truly 24 7, just practice them. 16 minute chart, 33 hour chart. Right. Just have fun with it. Just pull up different, different time frames, post your chart to those different time frames. Because I always go through the three majors, monthly, weekly, daily. And then I start playing around with random time frames and I always use the five major moving averages. 100, 210, 20, 50. If I ever get really bored, I'll start making up different moving averages as well just to see if I can find anything interesting. So I'll do an example of all those on crypto. Jason, what's up buddy? All right, so here is the monthly chart on our boy Litecoin. And what you'll notice is the hundred and two hundred haven't been formed yet because it hasn't been around a hundred months. Now if I click on this little L down here for logarithmic, you'll see it really adjust the chart kind of weird and you have to kind of re click it. I think this is a fun way to look at a lot of crypto because what it does is again just kind of like it shows how crypto moved on a percentage scale basis. So the, the bigger moves percent moves are over here and then you got these moves over here. So as you'll notice is a pretty interesting little trend here on litecoin. Right? Just big picture like some type of interesting support Tom and and then really if I had to draw it out, probably some type of interesting resistance up here as well. Okay, so this is the monthly chart. Now let me pull up the 10, 20, 50, because there's no 100, 200. And what we're going to notice is we're just right smack on top of the hundred, the ten, twenty, fifty. Now, if I zoom in, what I like about this is you can see there's a decent amount of space in between the 20 and the 50. So that tells me it's going to the 50, which is 88.66, which isn't a huge move. But, you know, it's 3. $3 per. Per coin. So if you have a hundred coins and it moves three bucks and you want to pay your car payment or buy some steak for the weekend or something, you know, there you go. It's a possibility. All right, so that's the monthly chart, Tom. And again, just looking at moving averages, trying to see and determine if there's enough movement for that to. To really look good. Now we're going to go into the weekly chart, and since I'm here at the long terms, I'm just going to look at it. And again, it looks nice to me. It looks bullish to me, because right now you are above the 10, 20, 50 on the weekly. So I like that, Tom. I. I'm not noticing anything else specifically here other than we are above all the weekly moving averages. So again, if you're looking at playing something bullish, you want it to be above most of the averages. And if you're playing something bearish, you want to be below most of the averages, it's above. You're gonna have more likelihood of making money going up. Now, again, if you're looking for places, let's say you're not in litecoin at all and you're looking for places to buy a pullback. Right. You could use these weekly moving averages. Because another thing I like about crypto, mj, is it helps us practice putting in really, really low orders, crossing our fingers, and just hoping that it fills. Because crypto, yes, you can catch breakouts, and you can make really, really big money on the way up. Absolutely. But the swings that crypto has on the downside are really, really fast and kind of wild. And so it's nothing for crypto to drop 30 in, like six hours. That's. That's like a walk in the park. And so what it trains you to do if you, if you trade crypto enough is it allows you just to throw in an order just to see if it hits. This is how real estate professionals make their money. Have you ever heard of someone say, in real estate, I Put in a lot of offers. You guys ever heard anyone say that? Okay. Get a few head nods. So putting a lot of offers, Eric, tell me, tell me what that means. Putting in a lot of offers. You're a real estate professional.
It means throwing it out there in front of, say, 15 people because one of them is going to need to sell immediately, and they'll just let the house go. And you get one good one, and the others don't fill, which is fine. Just like stocks.
Yep, precisely. So it's. So with crypto, you're throwing out a number. They generally sometimes don't fill, and sometimes they do, but a lot of times they don't, and that's okay. But I always. If I have cash or if I have US Dollars, I will always have two orders. And this is very important, ladies and gentlemen, this is worth all of June for you. Always have some good till cancel limit buy orders open. And always, always, always have your good till cancel limit cells open. Who would like, really quick. I'll come back to, like, one who would like me not to listen to my own advice. So here I have some random. Whatever this is. Bounce token. It's. I don't even know what it is, but I have some of it. Jason Chase told me to buy my. Buy as much as I could afford. I'm kidding. And I bought some off of the 200 here. And I. I did. Hold on, hold on. For you guys to make my. Make fun of me. I did have a limit cell open. It was just a lot higher. It was up here, so it didn't hit. But this is a really, really great example of if I was by the computer, I don't know how I missed this day. So I'm gonna chalk it up to just insert some excuse. Really, really good pop right there. And I should have and could have absolutely. And would have sold at 32 or 30 because it would have been profitable. Right. I bought out the 200. So, you know, that's 58%. Hello. Like, that's crazy town. Now. I'm still profitable right now, but like 12%. So I'm hoping that we get another good little push up in here. Saying all that to say, yeah, it's very, very important to always have some limit cells open because you never know with crypto. You can always get a random, random move like this farm USD right here. And I did get very, very lucky with this particular one. I bought just a couple thousand worth right here and had a limit sell. And look at that candle. I mean, mean, just right really, really good pump. This is what Jason Chase lives for right here, these big pumps. And then it kind of returned back to normal. So always have limit buys open, but even if you're fully invested and you have everything there, always have your limit sales open. All right, so that's the weekly 1050, and then here's the weekly 100, 200. And again, I really just love how the hunter starting to curve on litecoin here. We're starting to get a curve up the 200 still kind of pushing higher. So it's at 10688. And then there's not a whole lot to see here just from a candlestick perspective, other than I could easily draw and make the argument for some type of double bottom here, close above the neckline. And then all of this is the retest the neckline. I can make that argument. I could also make an argument. This is a nice little hammer. And since this is on a weekly chart, if we get a close above that hammer's high on a weekly candle, which we haven't done yet, that'll be really nice. Weekly candles on crypto close on Sundays. So Sunday to Sunday at 7pm Eastern. That's also when the new day begins for crypto is at 7pm Eastern. So 7pm Eastern, new day, new week. If it's Sunday, everything starts switching over. Or is it Monday? Is it Monday to Monday or Sunday? It's Monday to Monday. Monday to Monday. Sorry. So Monday to Monday, 7pm Eastern. So, you know, if you're looking for a close on a weekly chart or something, just. You have to wait till that Monday night, Tom. But again, this, this is a nice little hammer. So if we get a close above here, it looks. It looks comfortable. Now, here's what's really fun. If I go to the daily chart, what we're gonna notice on the daily chart is obviously a beautiful hammer here. But we have the 100 on the daily is at 87.18. Do you remember, Catherine, what was also at this price, almost identically.
That was on the monthly.
Yep, exactly. So you had the other moving averages right there at that resistance. So that's going to tell me that. That, that's going to be a good. A good place for just to pause again, if you're not profitable there, we don't have to sell anything. And you're not going to be very profitable. Me either. So it's like you could sell if you want to, but there's no real reason. Just know that. And that's why I tell myself okay, well this is a place where it's going to probably pause. So if I see it pause there and I see it change, great. But if you wanted to sell some and then see if you can catch more in a pullback, you obviously could just kind of comes down to your plan. For me personally, I just think I'll hold see if it ends up breaking through this resistance. If it breaks above this resistance, there's nothing stopping it once we get above 90. And that's, that's the good news, I think. But we can also see how, how very nicely we've interacted here with the 200 on Litecoin. So that's really been a thing of beauty. And then, so there we have those. Now I'm going to pop into the three hour time frame which again as I mentioned, I, I like different unique time frames. And here's the 100, 200 on the three hour and you can see all of them converging right on top of each other. So if I was trying to get a new price to buy some litecoin, I would snag it here in the middle of those two numbers. 83, let's call it 8380 is where I would buy. And the three hour chart is a pretty popular time frame for me to go down into using the 100 and 200. I generally don't use the 10, 20, 50 EMA to actively buy or sell just because I've noticed that very, very often stocks kind of, kind of come down here and pop into these prices pretty nicely. And then obviously, you know, if you're actively trading, you can definitely use the 100, 200 on the 15 minute time frame to kind of help you determine the trend. And then you pop into a smaller time frame, 10 EMA chart and only trade in the direction of the trend and take a 10 trade. Right? There's a win right there. There's a win right there. There's a win right there. Couple wins over here. So if you're in litecoin on a 15 minute chart and again you're actively trading it, then your smaller time frame is just, you're there, you're in front of the computer, right? You're taking trades, you're buying and selling. You on average only have about 1400 coins traded though every, every 15 minutes, which is not that much if you think about it. So a thousand coins is 85 grand, right? Every 15 minutes. So it's not a huge, huge, huge market as far as like super actively trading. You can definitely buy and sell off of this. But my still preferred time frame and methodology really is zooming out into a little bit of a bigger time frame and just see if I can buy something a little bit lower, sell a little bit higher and just kind of rinse and repeat. And I'm thinking Litecoin. Yeah, we can we get above 88. That's gonna be the big battleground. Best case scenario would be a push, a retest and then a push into July. That would be really, really, really nice. There you go. So I got a question. Yep. Hit me, brother.
If you scroll over the candle, it'll show you the volume.
Yep. That day.
Is that coins or dollars?
Great question, Great question. That is coins.
Okay. So you take that times how many dollars they trade for. I'll tell you how many hundreds of thousands or millions of dollars is traded that.
Huh? Yep. So each time you're looking at a crypto. So for example, the average is 127000 Lite coin being traded per day. And so you have to take that multiply times 85 and that's how much US dollars would be interacted with. Thanks. Yep. And again, it's still pretty small. It's not a humongous market. Like the total total total market cap. Does anybody remember the chart in order to see that? We talked about that on Monday.
Foreign.
Market cap for all crypto. Just type in the word total, T O T A L and you will get all of the cryptos added together, divided by however many there are and you'll see that it's only 2.5 trillion. If we zoom out, you can see the previous all time high was 3 trillion back in November, early November, late October 2021. And then we had a crypto ice age for a little bit where me and Jason Chase just ate cheese every day. But we. We still got ripped, Jason. We still got ripped. And then. And then it came back.
So Jeremy, do you have a good till canceled limit sell order on Litecoin?
Yes, ma'.
Am.
And where's that at?
That is at the 200 simple on the weekly chart. This purple line 106. 77. Thank you. You're welcome. Unmute you Jason. Oh, okay, gotcha. Sorry. Thought you're talking to me. All good. He's just closing deals over there. Snapping X and cash and checks. All right, sweet. Any other questions family about that Litecoin review and or discussion? And Julia? Anything Steve. Anything.
I have a question, Jeremy.
Yes, ma'.
Am.
So do you hold any crypto or do you just trade it Back and forth. Like what's your mid or longer term strategy with it?
I will hold it. Yeah, I'll hold it for a period of time. The only thing I will be comfortable holding slightly forever is probably the probably Bitcoin. But I still absolutely 100% suggest actively trading it to create cash flow and then have some for long term. I still think the only two personally right now that I'm just like, I can't see why they would ever evaporate would be, would be Ethereum and Bitcoin. And so if you want to put some on a cold storage and hold that cold storage for a while, that's those would be the two. Otherwise for right now, I think it's still a very, very useful market to buy some. Hold it absolutely for a few weeks to a few months, sometimes a few days and then sell it higher. Okay, yeah, great question. All right, that was a Litecoin review. Ms. Joe.
Yes.
Which should I pick next, futures stock or forex?
Futures?
Futures. Okay, you get to pick which one. Do you want a commodity or do you want a index? Futures.
Index, I guess. I haven't dabbled with them too much. So probably getting a general breakdown on something that's a bit more familiar might be good.
Let's do it. All right, so inq, which is the E Minis NASDAQ futures, we've all heard of the NASDAQ futures. So we'll click on NASDAQ and we're going to do the exact same process. We're going to start with the monthly chart, ask ourselves what the trend is. Obviously the trend is up. We're really, really high. And again we can look at and take some note of all of the moving averages here. You want to draw them out or at least draw out some of the ones that are relevant. I think the 10 on the monthly will probably be pretty relevant. Then we'll pop into the weekly and I'm gonna draw some weekly moving averages. Here's the 10 on the weekly and here's the 20 on the weekly. Again if I zoom in, look at how beautiful, right? The NASDAQ futures have interacted with this 100 most of the year. The 100, sorry, the 10 EMA. So the 10 EMA most of the year has just been a beautiful, beautiful support level. So again, when it's trading down, when that futures is trading down to that particular price, you, you know the trend is bullish. And Eric, true or false? You'll always make more money trading in the direction of the trend. True, that is true. Yep, that is true. So daily chart, same thing is now we'll go look at the moving averages here on the daily and again you can look at the 10, 20, 50 and you can have those drawn out, draw out your, your lines just so that you know where they're at. Because again, you're still going to be focusing on primarily whatever the overall direction is in futures very, very often and or Forex and or crypto is you're just going to have some bigger time frame telling you what the overall trend is or needs to be. And it's no different with this. So again, I'll have a line drawn here and we'll have a line drawn here just so that we know where they're all at. So there's the 10, 20 and here's the 50 on the daily. So all these purple lines are going to be really, really good support levels. And for me, 97 of the time when something is at an all time high, I don't know what to do with it other than just leave it alone. If I'm in it, I'm in it. I leave it alone. If I'm not in it, I wait and I wait for some type of pullback. So right now I don't have any position on, on the NASDAQ futures, so I'd be waiting for a pullback. The time frame that I generally tell people to use for the trend.
On.
Futures is the two hour chart. Now when I say the trend, meaning you can have all of your lines still drawn and these lines for me, right, are going to act as support resistances. So if the stock is coming into them and I can use my trend to help me determine that particular direction, I will use those lines as a determination on am I going to be buying or am I going to be selling. So let me give you all an example. Now what I do is I pop into a two hour chart and the two hour chart I use, believe it or not, the 20 EMA. The 20 EMA is what helps me determine the overall trend for the NASDAQ or for any futures that I'm trading. So when I say overall trend right here, that means I'd be going bearish because you're below the 20. And here, here, here, here, here I'd be looking at bullish trades because I'm above the 20 on the two hour. And so for this exact moment right now, you'll notice that we're above the 20, which means I would be using and waiting for this particular price. I'd be waiting for this for the futures contract to trade back down to that price. I would set an alert at that price and once the futures price hits that purple line which is the 10 EMA on the daily then I would start zooming in and taking trades on the three minute chart. And the three minute chart I'm still going to be using surprise, surprise, the 10 EMA and I'll still be using this particular strategy. And as Jeremy has properly guessed, I will still only be trading in the direction of the trend. So right now at this exact moment you can see there's a really nice little double top bear titanium a play.
Is that the 20 or the 10 showing?
This is the 20. Okay. Yeah, this is this one. But there is, there is a little bit of a tenny may setup coming in here and Jeremy, why can I not or why should I not take this bearish.
Why should you not.
Always on your. Jeremy.
It's like looking a little bit bigger. Is it like a double top? But it could, I don't know, I kind of seen like a double bottom forming and then I'd probably do wave counts to like confirm.
Yeah, we're all.
But I'm not like familiar with features. Does it close at like regular?
Good question. It does. So It'll close at 4 Eastern. From 4 to 5 Eastern it's closed.
That would be why I wouldn't take it.
But yeah, that is, that is a reason. The other reason was as, as I mentioned. So we're still above the 20 EMA on the two hour. So 20 EMA on the two hour. This is going to be our trend determination. So since we're above the 20, we're only going to be taking bull trades.
Yeah.
So even though, even though one looks good, I was like hey, this is a potential setup. Anytime you're doing 247 markets you want to have some bigger time frame that says this is the direction I'm going be taking my trade.
So this would be future if you're trading futures. It would a good use case would be to use like the dual window in trading view have like your 2 hour up to remind you not to take the juicy bearish 10.
That's right. Yep, exactly. And I do want to show all of you really quick like another reason if I can, if I can convince anyone ever to trade futures. There's some really good reasons too. But have you guys ever heard the term scalping? So scalping is like getting in, getting out.
Right?
Getting in, getting out. Looking for a pattern. Oh, there's a cool pattern getting in and getting out. So very futures are very liquid, as I mentioned previously. But let's go ahead and calculate this move right here. So for those of you who might not recall, I'll pull up the our presentation from last week, and we're going to come over to the points and ticks. And The NASDAQ is $5 per point, right? $5 per point per contract. And there are four points in every dollar. So it's $20 of movement per dollar. And if you had played this 10 EMA, which you can all see, actually, really, this is the 10 EMA right there. But let's not use that one because that one's too easy. Let's use this one. Let's say, let's say this is. You got scared. You pulled a Jeremy Newsom. So you didn't. You didn't enter there because you're a chicken. And so you waited and you got that really good rip. And then you're like, okay, cool. So you set the trade up here. Would you all agree that you would be allowed to lower your entry based on all those 10 email candles? Because they all close above the 10. All right, I'm getting some head knocks. Perfect. So if your trade set up again on the NQ was enter here, stop loss below the low of that big bull candle, and there's a good little push here. This entry right there is, let's say 19, 19,068. So it's $20 a point. $20 a point. So that is 20 points times $20 is 400 bucks just with one contract. This move Right here is $400. Now, I know you're like, oh, that's not that much newsome. Well, let me show you on the cues really quick. I'm just going to give you guys a comparison because I do want a lot of you to ultimately, at some point, try out futures, even if it's in paper trading or a funded account, because Eric will. Eric will tell you guys how quick these things move. All right, so here's the cues, right? This is the nasdaq. So this is how most of you are playing the nasdaq. Right now you can see the same trade setup, right? You got your Tenny ma. I'll point to the same candle. There's the blue arrow. So you got the same candle. So your entry is here. Stop losses here. And you could have exit on that move. Now, if you were to have a 400 risk unit, this is approximately 50 cents. That's 800 shares you would have needed to have put up in capital, even though it's leveraged money, because it's a day trade. $370,000 to make 400 bucks. Okay. If you're day trading the shares, which again, I know it's all fake money if it's a margin day trade anyway, but it's still a lot of money to make 400. Right, Jeremy? And then some people are like, I don't have that kind of money. So they're going to play options. And then if you play the options on this trade, you're gonna. You got hosed. You didn't make any money. But if you played the futures, this trade here, but it cost you $35,000 of buying capital because you bought one contract and you made 400 bucks, a lot less buying power.
Why 35,000. The price is 19 grand.
Yep. So NASDAQ futures contracts, the way they trade is just like essentially one and a half times. Okay, yeah. Margin can fluctuate a little bit, but it's really not that. Ultimately not that bad. But yeah, it's usually one and a half times the Nasdaq.
So if you bought 100 grand worth, you could have made 1200 bucks.
Yeah. Very quickly.
Why does it work like that? Why? It's not a dollar a dollar. And like, it moves a dollar, it's worth 20. It's hard to keep track of all that.
It. It is. I would, I would highly encourage everyone to print out this little puppy here, Tom. And you're. If you ever want to start practicing futures. I, I don't know why other than that's just how it is, is the best answer I got. Yeah. And. And each future is different. That's the other thing. Like if you're trading avocados versus gold versus corn versus oil, they're all different. But Joe, the good news is they. They all move tick for tick. So a tick is the smallest unit of measurement. So you'll notice if I take the. My crosshair and just move it one unit of measurement, you see, it's 25 cents. The cool news is with futures is they all trade that way. So they all trade tick for tick. So it kind of like in the stocks, right? It's pennies, right, guys? But you're going to get slippage because there's 25 pennies in between.25 cents. But in futures, it's just one tick. Two and one tick. There's nothing in between a tick. So there's no slippage. Which means if you want to get filled at 10, 19, 68, you're going to get filled at 1968. It's pretty nifty.
So why is the chart exactly the same as the Q's? Because it's, it mirrors it. Right.
This actually mirrors this. Futures trades first, Q's follow futures. And so that's why. Yeah, great question, but that's why, like when you're trading futures, right, you are trading the future price of something. So you can't actually trade the nasdaq. Right. The NASDAQ is just an index. It's just a blended average of all the stocks. The futures contract is the betting price of what the NASDAQ will be in the future. And the cues follows the futures, so they don't move independently. So a lot of people betting on the futures think it's going to go down. Then the Q's is going to go down 100% of the time. Isn't that cool?
Does that happen at the same time?
Yeah.
Or is there a delay?
Yeah, it'll happen pre. Pretty, pretty much the same time, except the cues is a little bit more uncoupled, but there is a delay. So, like this right here, this right now isn't. Isn't real time. This is real time. So I, My, my NASDAQ data on this particular computer is delayed 15 minutes just because I don't want to pay for it right now because I'm not trading futures. But this, this is. Yeah, the queues will go down, this is going to go down, but it's not. That's probably why you're slightly confused. Yeah, the, the futures data is delayed on tradingview for me right now for 15 minutes.
Better.
Yeah, but they're, they're going to move when, when this moves, this will move. So it's like this moves up and then like whatever, 8 milliseconds later, this moves up and vice versa. It moves down, this moves down.
So people just only trade five days a week, right?
Yes, ma'. Am. Yeah, futures trade. So futures is 23, 5, 23 hours a day, 5 days a week. Great question, Joe, but family, what I love about them is tonight's Thursday night. Guess what you can trade tonight? Some NASDAQ futures. Yeah. And so again, what I like about crypto is that it trades just like stocks and there's no leverage. What I don't like about crypto is it's kind of hard to make money on the downside, Right? I mean, without using leverage, it's kind of hard to short crypto unless you're using like a fund account or something. But with futures, you aren't can you can do that. And I, I like to tell people my general like version of how people should trade futures. Again, just kind of my opinion is I think you should have your exact setup, your exact system. You pull it up, you look for is it there? Yes. No. If it's not, move on when. And I will tell you all this. It makes you really happy when you feel very, very, very confident with candlestick patterns and chart patterns and you can just read candles and you get, you're good on intuition. And you know you're good on intuition. Kind of like Joe, Jeremy, you're almost there. You're gonna get there soon. Imagine dude, being able to short this 10ema long. That Tenny may. Short that tenny may along that tennie may within three or four hours. Dude, like you're scalping this. I mean you're making gargantuan money. Because also Again, back to the 370, 000 example. You have to have $370,000 to make 400 bucks, which is stupid on the queues. You do that trade on futures dog. Like you made 6,000, $7,000 using 40 grand. Same movement, same strategy, same pattern, one contract. If you, if you did more than. Oh dude, you did a lot of contracts. Good grief. And that's the thing about futures is it can get a little scary because the leverage it is, it brings out the gambler in people. Right Eric? But this right here, I mean this drop right there with that 10 EMA with 10 contracts and again you can make is 10 contracts is 20 times 10 is 200 a point. So 10, 80, 50, just $20 easily times 200. So that's $4,000 with 10 contracts on that move right there. And you, none of us would have had the money to do that on the queues. And, and if you did have the money, you'd have to use the puts. And the puts as you all probably know, wouldn't have moved that nicely. Puts are kind of shitty, right? You got Greeks and you got all this rant like implied volatility and you got like a bid ask spread futures doesn't have any of that.
On the futures.
Yep, yep. Yeah. If, if I was going to tell anyone to trade something like index related, I would say trade futures because it is really, really fun. Okay, next let's do a currency pair. Currency pair. And I think all of you know stocks. Well I'll do this, I'll do a stock really quick. Is there anyone, is there a trade that anybody's in that want, wants Me to review. Anything. New? Stock position.
I'm in Palantir.
Pl here. What you doing with Palantir over there? Champion.
I got in at like 20 something.
Yes, you did. What a legend. Good for you. Good for you. That's a really nice move. I'm also in on Palantir a little bit. Three strong bull candles in a row. If you have over 100 shares. MJ, great time to do a covered call. If not, let's look at the long term moving averages. Perfect bounce off that hundred. Really nice Weekly chart looks good. And there's no moving averages above us. We're bullish on all things. So looks like one to hold or, and, and, or again. Get into either like a collar which is selling calls and buying puts or get into a cover call or just do neither of those and expect some type of retracement and pullback. Most likely. Usually three strong bull candles on most positions. You're going to get some kind of pullback afterwards before it pushes again. So this is a good push again. Here's another example. Three strong bull candles. A little bit. A little bit of a retracement. But yeah, great position, great trade legend. Well done.
Maybe I can get out and get back in on the retrace.
You can. Yes, you can. All right, let's go look at our Tesla. Is it. Has it, is it, is it coiling yet? Oh my gosh. Wow. This thing. Coil station. There's the 100. I mean it is just. I haven't seen, I haven't seen 100 do this on Tesla. I don't think in my career like it has failed a hundred. Like I failed organic chemistry. Just over and over and over waiting for that big pot. We'll see what it does. See if it's gonna go higher. I did trade this trade on. On Robin Hood that I hit a target on. And that trade, so that you guys all know was just a. Ready, ready 10ema. Katherine's been practicing her 10ama. So there's your first bear candle above the 10. Nice upper shadow. That bear candle. Also the high. That candle was almost the exact same high of that big bear candle. Looks pretty good, right, Jay? I was in a wave count. This is wave four. Had a good breakout. Yeah. So that was, that was a nice little, nice little push on Robin.
Okay, so currency pair 10am a day trade on it today.
Oh, nice. Where was that post in the ultra wealth chart or you just took what Dan took. You just cheated.
No, I, I missed that. So I took the natural 10 EMA. When it moved up there.
Oh, nice.
So he. I got in when he was at about 2R already, but still got 1.25 R on it.
So there you go, girl. Good job. Great work. Great work.
And busy with work, so I didn't get a chance to get it in there.
That's okay. Aave. Yeah, I definitely. I can look at any crypto anytime, ladies and gentlemen. That's the good news. So if you ever want me to look at a crypto, this is not only the month, but the time to do it. A v e do I have ave on my coinbase? I don't think I do. This one got added recently.
Yeah, I like that one list. My mom's portfolio.
This one.
No, I just saw it on your list.
Oh, oh, yeah, yeah, yeah, yeah. Keeping track of my mom's stocks for that. That's always fun because she doesn't sell anything ever, so I just tell her to buy it. She's in some Nvidia and she's crushing it. All right, so AAVE 100 SMA was at 8164 on the weekly. That was beautiful balancing spot. Really good pullback down there in April. It's probably where you bought it, Julia, since you're. Because you're so rich.
Actually not in it.
Not in it yet.
Okay.
You want to be. I like it. Okay. Month. So this is early on the month. But this is a bare candle above the 10. So one one price would definitely be that 8132nd price. Yep. Right like that. So that's what I'll do is 80. 8130 would be a limit order to get in on a purchase. And then a breakout would be 108.
So by breakout you mean if it closes above 108. Get in there.
No, just a stop. A stop entry. Oh, okay. Yep. Good old stop. Market purchase or stop limit? Either one.
Okay.
Yeah. All right, let's do currency pair. The good old euro USD Classic. And so I've played with this one a bunch again. We'll start with the monthly chart just to see where those moving averages are. And that's going to be the tractor beam. That's where we're going. €112 USD. Which means that the euro is going to try to gain some strength over the dollar. It's whatever currency pairs first. Notice how well we interacted with the 100 on the weekly down there just a couple days ago. And then there's the 200 on the weekly and then the daily chart. Yeah, 100. 200. Beautiful. Bounce off of that. And look, look at this too. Same, same rule that we just talked about on Palantir guys. That three bar play is no joke. Look at that. Bull, bull, bull, pullback. Bull, bull, bull, pullback. Bull, bull, bull, pullback. It's crazy. Three bar play strong. Yep, those all look nice moving averages. Above, above and we got the 50. Okay. And then again I love playing with different time frames on the euro USD. This is the two hour chart. Really nice high wave candle right there. I would probably set an alert for that price and see if the euro can break above it. I'd set an alert and I would rebuy on a pullback. And the time frame I would re buy on would probably be the three hour or one hour right there. See if I can snag some off the 50. There it goes. So I'll post that in our chart so we can kind of keep tabs on it just so we can watch it, see what it does. Anybody wants to paper trade it, they can watch it or just keep an eye on it. Again as a reminder, the futures are definitely the easiest thing to interact with. All of your brokers can trade futures, you just gotta get futures approval. But I would love some futures paper trades with a broker just to see how it works. Just log in, try it out, see if you get addicted. Worst, worst, worst case, you can use a funded account, put in a couple hundred bucks, try it that way. And again, that's only if you want to. Again, if you know your schedule doesn't allow for it, you by no means have to. But it is useful because if you want to get some more reps in trading and emotional control and discipline. Since futures trades at night, I think it can be really useful to have that practice and that emotional control just readily available. Something that you interact with on a, on a frequent basis. You good team coming back Monday? I'll be here. Great weekend. Post a bunch of charts, that's all we want to do, charts of how we all make money. So post them, study them. Crypto, forex, futures, stocks. I'm all about it. Let's go become Picasso as a price action. Go get, make some money and really start building our plan for the summer. Because again that's kind of my my opinion on why I think crypto is really going to move nicely. Love your team. Let me know if you need anything. Okay, bye.