Month 3 Elliot Wave 3 4 2024
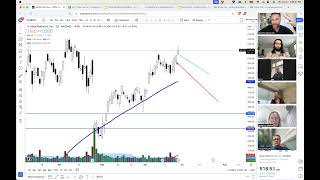
Jerremy Newsome leads a recorded, interactive Elliott Wave trading class (Mar 4, 2024). He explains wave theory (crediting Charles Dow and R.N. Elliott), states key Elliott Wave rules (impulse = 5 subwaves; corrective = 3; wave 2 may not retrace past wave 1 start; wave 3 cannot be the shortest; wave 4 should not enter wave 1 price territory; wave 5 often ends with momentum divergence), and demonstrates counting on multiple tickers (Coinbase, Bitcoin, NVIDIA, Carvana, AMD, Qualcomm, Tesla, Google). The session emphasizes fractal/multi-timeframe analysis, practical trading rules (volume, gaps, pennants for wave 4), subjectivity of counts, and a homework assignment: submit monthly, weekly, daily wave counts for one chosen stock.
Chapters
So what we're doing, boys and girls, is we are going to be crushing some Elliott Wave discussion for the next month, and we're going to be doing a lot of practice. Today is going to be a little bit of slideshow action. But even after we do this, I would love for all of you to answer or ask, sorry, ask any questions that you have. Feel free to ask them. Always here to help, and just have fun with your homework. Realize that everything the market works is not all the time. This is another one of those. But I can assure you that if you start really practicing and seeing Elliott Waves and just really understanding what they are and how they work and getting comfortable with them, your trade gonna change forever. This really is kind of my. My secret tool that I. I get and I understand is a little bit more complex, it's a little bit more advanced, but it at least helps me in kind of my analysis of what I think something's going to do. And once I have that analysis, once I have my plan in place, then I act on that plan. I act on that analysis. So I call this the matrix of the market. You're about to see into the matrix, Scott. You're gonna become Neo. Here it is. Now, this is a bunch of texts, and I broke it down just a moment, but this is right from your boy, Charles Dow himself. So Charles Dow, AKA the Dow Jones. Right, That's Charles Dow and Edward Jones. Charles Da is the grandfather. Technical analysis. And he felt that the market always moved in three movements. And these movements were very much like the waves of an ocean. You have the primary movement, secondary movement, and tertiary movement. So let's kind of break all of this down into what this actually means, step by step. So the primary movement or wave is the overall trend that the market is in. And as compared to the tide of the ocean, the primary trend may last from several months to several years. So several months to several years is going to be a primary trend. What you're going to notice is, again, the reason I'm kind of breaking it down and talking a little bit about what Charles Dallas said and how he said it was essentially so we can understand the fractal nature of the market and we can understand the organic composition of the market as well. When I say organic, I literally mean like, it's a living, breathing thing, just like the ocean. And when you can know what the trend is and, you know, up or down or sideways, and you can really zoom out on the big picture, you could start zooming into the smaller movements. Because even if the tide is out or in. You can still make really good money from it. Now, the primary, if I actually go back, what I did here is I zoomed in to this portion of the market right there where you had those primary trend changes to kind of zoom in to show you that the primary moves are consisted of secondary moves. So secondary waves. Just as the tide consists of small waves, the secondary trend usually lasts three weeks to three months. So you're noticing probably a lot of fib numbers in here, right? The number three is always a big one. So three weeks to three months. What Just means that if a stock has done something for more than that kind of period of time and you start getting a trend change, that it is okay to go the opposite direction if you feel that might necessary. And as you can start to see, you can see how these waves, these trends, they do have an ending, right? They do have a stop and an ending date, as you can kind of notice, right. So the final and most insignificant trend is the tertiary, which is the daily movement in the stock price, such as the ripples in the sea.
Tom.
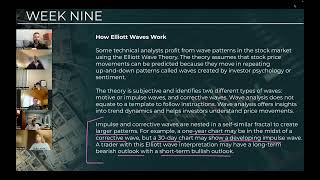
So notice how this says insignificant, right? So the. I didn't draw this one out because that is the waves that happen inside of the secondary movements that generally won't really cause much of a difference to how your trade should be. So if you're in a primary trend and you have four days where nothing happens, or three days of sideways movement, that's okay. Those are insignificant moves. You can have moves that don't really relate or compound or structure into anything fun or interesting or unique or specific or wonderful. They're just there. But I like the fact that we know that they're insignificant because that should mean that there's nothing that you should do once you kind of can determine your primary and or secondary trends. Those small, insignificant ripples in the sea, right. Don't do anything about it. So the waves that Dao kind of started noticing, right? Dao, your boy, just started realizing that that's how the market moves. Then. Then comes a guy called Ralph Nelson Elliott, which I try to get my wife to name our kid Ralph Nelson Elliott, but she said no, but Ralph Nelson Elliot. So the Elliott wave theory is a technical analysis of price patterns related to changes in investor sentiment and psychology. The theory identifies impulse waves that establish a pattern in corrective waves that oppose the larger trend. Each set of waves is within another set of waves that adhere to the same impulse or corrective pattern described as fractal approach to investing. That's the big, big Takeaway. And this is like the Investopedia definition. So really, again, it's just the way that people care about things and the way that the markets shift, how people are doing and why they're feeling that way. In the 1930s, your boy Ralph Nelson Elliott did 75 years worth of data going back in time, using yearly, monthly, weekly, daily. And then he hand drew his own hourly and 30 minute charts across various indices because this is the 1930s, so you don't have your Trading View app on your iPhone to help you. So your boy, right, was like in the the Beautiful Mind, Russell Crowe writing on the chalkboard type of weird, which is awesome. And in 1935, his theory gained notoriety when he essentially called the bottom of the market. And the thing that a lot of people don't tell you about the Great Depression is after the Great Depression happened, which sucked, right, the market went down 90%. It then went up 350%, right? So it's like if, if you were able to be in a little bit of cash or time, it kind of at least, okay, there was a really, really good wealth generation after that big crash that happened. So as long as you were able to stay solvent and keep your cash alive. So anyway, that's just, there's that. Okay, so how Elliott waves work. So again, this is a lot of text for right now, and I'm going to give you the charts in just a moment, but some technical analysts profit from wave patterns in the stock market using Elliott wave theory, which is what we're going to be doing. We're going be making a bunch of profits from this. The theory assumes that the stock price movements can be predicted because they move in repeating up and down patterns called waves created by investor psychology or sentiment. Now this is wild how this works. It's just, it still blows my mind every day, but it does, it really, really does work. Now here's the best part that I always get the haters on. The theory is subjective and identifies two different types of waves, motive or impulse waves and corrective waves. So you have impulse, these are the same motive waves, and then corrective waves. Now, when it's subjective, isn't all market subjective? And the answer is obviously right. Everyone's going to see whatever they want to see. What we're going to be doing is we're going to be, over the next month continuing to build our house of technical analysis using everything that we've learned from candlestick patterns, multiple time frame analysis and gaps. And you blend all of that together to create your subjective Identification of where you believe with a high degree of probability that the trade's likely going to go. And once you build your high level of probability, you can take a nice strong trade and make some good money. Right Eric? Yep. Yeah. All right. Now here's just a quick example. Verbally is impulse and corrective waves are nestled in self similar fractal to create larger patterns. For example, a one year chart may be in the midst of a corrective wave, but a 30 day chart may show a developing impulse wave, so on and so forth. So a trader with Elliott wave interpretation may have a long term bearish outlook with a short term bullish outlook. So you can do both. Or you could be short term bearish and long term bullish. See me do that all the time. You see me go, all right, long term you need to be making some money on whatever Tesla or Google or whatever the case may be. But short term, this short term looks like we're going to go down, or short term, it looks like we're going to be correct. So they're all, it's all fractal. And here is how this structure looks. So again, impulse waves consist of five sub waves that make the net movement in the same direction as the trend of the next largest degree. This pattern is the most common motive wave and the easiest to spot in a market. It consists of five sub waves, three of which are motive waves and two are corrective waves. Don't worry about all the jargon. I put it in there so that you would all know that it's legit. And then I'm going to show you I have the newsome wave theory in just a little bit. So this is, this is your boy Ralph Nelson getting after it, being all smart and stuff. And then I'm gonna break down because you know, that's how I learned in school. But this is the pattern. This is the pattern right here. And here's the best part. You ready? Every single market on earth will, will move in this type of pattern. That's the best part. Now it doesn't have to look exactly like this, but it will all be comprised of that type of pattern. And it is bananas. It is literally mind blowing. Now this is an important part. So go ahead and either jot this down or take some screenshots or just do your best to memorize it. This one's important. Wave two cannot retrace more than the beginning of wave one. So it can go all the way to the beginning, it just can't go lower. Great job. All right, so Wave three. A lot of people misspell this rule. A lot of people say that wave three has to be the longest. That's not true. Wave three, my friends, is usually the longest, but the rule is that it can't be the shortest. So if you're drawing your waves, if your wave 3 is the shortest of all the waves, then you know you're doing something correct or incorrect. Okay? Wave 4 does not overlap with the price territory of wave 1. So anyway, any way that you drove wave 1 every now and then, I. I have found that my wave four retest the high of wave one. That can happen. Like, where. Like, it's a couple of pennies. I don't really stress about it, but you don't really want to go too far into wave one. So again, if you're drawing it wave three, you shouldn't. It shouldn't do this, right? It shouldn't really go really much past the high of whatever you're drawing, the wave one. Okay? And then wave five needs to end with momentum divergence. So generally, all that means. And this is the least important rule that I spend my time attention on, but what it means is it has to go higher than wave three. Even if it's by a penny, it has to go higher than wave three. Okay? So I'm gonna break it down into the Newsom theory in just a second. So here's what I do, and here's what. We're gonna start practicing. And as we start looking at the charts and just drawing this out, you're gonna love this so much, it's going to change your life forever. I try to find a wave 3 in the past because wave 3 is the easiest thing to find. I go and I find a wave three that recently happened, and then I start my count from there. I try to find a recent wave three. I try to find the count. I try to go forward in time. And once I go forward in time, I then can start creating everything that I need. Wave 3 usually has tons of strong volume, candles in the trend direction, and gaps if it's a stock. Okay. Wave four is often a triangle pennant pattern or some type of consolidation. And again, like I said, wave five must go higher than wave three. But here's a rule that I've. I've started incorporating a lot is you should always find a three wave or a five wave count inside of every wave three. Every wave three that you draw, there should be at least a three or five count inside of that wave three. So now that you're properly or Confused. Now let's go look at some charts. All right, Charts. That's what we're going to spend the rest of our time on. So now let's go look at. I don't know, I'm just going to look at Coinbase. So we're going to pull up Coinbase. And the reason I'm looking at Coinbase, because I think that this is a really, really nice wave structure. I think this is pretty perfect. Pretty spot on. You might already be able to see it. Type in A1 if you can see it. Yeah, you can already see it. Oh, cool. Scott. Scott's head already exploded. All right, fantastic. So 1, 2, 3, 4, 5. 1, 2, 3, 4,. All right, so now if we know that this is the case, let's just practice with this for a little bit and let's just kind of analyze what we see here. So I mentioned that wave 3 can't be the shortest. Is wave 3 the shortest? And the answer is no, because it's longer than wave one. All right, sweet. Did wave two go lower than the start of wave one? No, it did not. All right, now, inside of wave three, can we count a five wave structure? So I didn't draw this perfectly, but wave wave two needs to start here. So let me just. Let me just kind of do this again. This is the tool that I want you guys to use for your homework, because I'm sure you already know what your homework's going to be for today, tomorrow, and Wednesday. But inside trading view, you have this little. It's the 1, 2, 3. It's the fourth one down. It will say, elliot, impulse wave. These are what we're going to be practicing a lot with. So I'm gonna start here. I'm gonna go to the top of here. I'm gonna go down to here, here, here, and then we're still in wave five right now. Now you might be saying, well, how high are we going to go? I'll show you in just a second. You can also use some Elliots to understand this as well. All right, so let me first go in and look at wave one. Let's just analyze this for a second, okay? Why do you all think that I started wave one where I started it?
Because the increased volume and the gap.
That's it. You nailed it. Because of the increased volume. Now, when would you have known that? Because, again, trust me, I realize that you're gonna be like, well, Newsom, all this is, is in the past. It doesn't matter. Trust me, once you start knowing a Wave count. And you're able to create the wave count. This stuff matters a lot because I went bullish, and so did Joe. And so a few of you. Actually, I went bullish on Coinbase at 116ish down over here. I was buying because I already knew this wave count. I already saw it. That was a very easy, very obvious wave count. So that means that you're able to make some good money into here in this little pop, right? That happened. That. That should be a good, profitable endeavor for you. Okay, so just to come back to wave one, now, we all know that huge, huge, huge bullish volume at a high is not generally a good thing, right? We've already started practicing that. So that's why that particular wave starts to get a little bit of a drop. So a question to you would be, we talked about this being fractal, right? Meaning that waves are comprised of. Waves are comprised of waves. Do you see a wave five count inside of this wave one? All right, let's practice it. 1, 2, 3, Four, five. So that when you start going smaller, the moves become smaller. That makes sense. Right now the question that I would have is, does it really matter where you would draw the four? Right? Could this be the four? Could this be the four? Or could this little pullback be the four? And the answer is yes, it certainly could. Certainly could. It doesn't generally specifically matter. Ultimately. I don't think normally. Normally. Wave four. And we're going to talk about this next week. This is the hardest wave to measure. Wave four can be the. The challenge, because wave four is big, it's ugly, it's gnarly, it's annoying, and it can be very, very hard to kind of track when you're in it, when you're in the motion. But let's go zoom into this wave three that I drew, and then I'm go into the big wave three that I drew. Okay, so let's zoom into the small way. So what do you guys remember about wave three? One of the other rules is it needs to have a 3 or a 5 wave count inside of it 95% of the time. Every wave 3 should have a very clear wave 5 count inside of it. The only time you should have and you can't find a wave 5 inside of a wave 3 is it needs to be on a pretty small time frame, like a 1 minute, 2 minute, 5 minute. It's got to be on a really small time frame for me not to be able to do a wave five count inside of a wave Three. And when I. When I say a wave count, it still needs to follow the rules. Go ahead, Ms. Sue.
And the other one is it can't be the shortest.
Correct.
Can't be the shortest wave. I. I did think it was supposed to be the longest one, so.
Yeah, it usually is, but it doesn't have to be. It oftentimes is the longest, but it just can't be the shortest. And again, when you're looking at wave threes, you're really finding all of these powerful moving averages. You're finding big candle, big volume, all those things. So if I go in and I look at the start of wave two is my wave one, two. You guys see that? Where's the wave three? All this is the wave three, wave four, and wave five. How. Dude, crazy. Crazy, crazy, crazy. It's wild. Now, if we zoom in to this wave three on, like an hourly chart or something, do you guys think we could find a way, you know, five waves, probably? Oh, yeah. Oh, yeah. You would find them. They're there. It'd be a 1, 2, 3, 4, 5. It'd be silly. It's crazy. So the reason you do this is because once you create a wave structure, you should be able to go into this type of detail, because if you can't, that means that your count is not right. But if you know that your count is right, you can go forward in time and start pre. You know, planning and preparing what a trade should do. Correct. You start knowing what wave you're in, and you start getting things, bro. You start getting really, really comfortable and like, oh, I know what wave I'm in. Well, then play it. If you're like, man, I'm in a wave four. Wave three just happened. That means wave five should be coming. That should tell you, hey, I need to be patient. I need to wait this out. I shouldn't be too aggressive. Let me let it build and then let me let it spring forth going far into the future. Okay, so now let's go look at the big wave three. And who wants to try to draw on my screen? And let's go. Let's go. Fractal this. Wave three down.
How do you draw on your screen.
At the very top? It should be a little. Oh, view options, maybe View options. And it should say annotate.
Okay, I'll try it.
Yeah, let's do it.
Wave three.
So we're going to break down wave three.
Okay, so I'm going to start here. Oops. Do I have to drag it? Okay. One, two, three. Whoop. Not very straight, but sorry. Four, five.
Hey, nice. Nicely done. All right, so keep that drawing on there for a moment. Okay, who else wants to try to draw my screen? And who can find wave count inside of Ms. Sue's wave three. Again? Remember, just look for the wave three and you'll see everything else. Just got to try to find the wave 3. Who wants to try to draw it? Hey, look how fast you are. Dang.
That'S cool.
Good job. Is that cool or is that cool?
Very cool.
All right, so we're gonna leave those drawings on the chart for me, and we're gonna have a blast. All right? One of my guys needs to step up. One of my dudes. Because now I want one of my guys to draw a five wave structure down on the four wave. The girls already see it. They already got it.
I think I can do it. Talking about the same thing here.
Good job, buddy. Well, I thought it was supposed to be abc, correct? Yes. And so an abc. You are. You are absolutely right. An ABC is generally. It can still be a wave five structure, the eight, the corrective waves, AKA the abc or a wave four. Those are always the most challenging from a theory perspective. But what I found is very, very often you're always going to get a 3 or a 5 wave. Okay? Always going to be able to have it. So if it's an ABC, if it's just a perfect 1, 2, 3, and then it just reverses and we're back to the races. Fantastic. But in your particular example, what you drew there, you'll notice that we went just a couple pennies lower right over here, right? We. We went lower than this low. And so to me, that tells me it's like, okay, well, I can't be an ABC because we. We did actually make a lower low. So therefore, it needs to be a 1, 2, 3, 4, 5. But that 1, 2, 3, 4,. What generally happens after the end of a wave 5, Eric, if you had to guess, Turns around. Turns around. So if I go, all right, cool. I can visually see a 1, 2, 3, 4, 5 here. And it fits all the rules, and it fits all of the criteria. There's nothing broken inside of it. Then I would expect that this is the end of that bear wave 5, which means that I should start to see a corrective cycle higher. A new 1, 2, 3, 4, 5. Crazy, crazy, crazy. All right, so let's keep having fun with this because Scott's over there smiling. He's having a blast. He thinks this is the coolest thing ever. All Right. Let me delete this for a second. Okay, so let's just go look at this on, I don't know, bitcoin. Bitcoin's popular. A lot of people are talking about it right now. So let's look at this on just a daily chart. And if we're looking at this on a daily chart, who wants to start the count for me? Let's just start it sometime in September. You guys are welcome. Draw my screen, whoever wants to attempt it. Was that. Is that joe?
Yeah, that was me.
Okay, sweet. I think you. I think you nailed it. I think you nailed it. So we got a 1, 2, 3, 4, 5. All right, so let's. Now what I'm gonna do is. I'mma. I'mma. Elliot, wave this thing. Okay? 1, 2, 3, 4, 5. Okay, so now what I'm gonna do is I'm just gonna go look at it and see. Is this correct? Did. Did. Are any of these rules broken? So let's go look at rule wave two. Did wave two go lower than wave one? No. So now it's like, okay, we'll put the wave one here. And wait, so wave two did not go lower than wave one. So we're good to go there. All right, wave three that she drew, does wave three have strong bull candles? And can we do a wave 5 count inside of that wave 3? And again, all I'm doing is I'm looking for wave threes, and when I'm looking for wave threes, I'm looking for big movement ups, big movement downs. Right? 1, 2, 3, 4, 5. Now this wave three, although it's not the biggest wave, depending on exactly how I drew it, it's bigger than wave five, but it's not longer than wave one. That's okay. Just doesn't. Can't be the shortest wave. And then if I draw on this down structure. Eric, Cal, do you mind answering Britney's call? If I. If I draw this down, this down section here, can we do a 1, 2, 3 wave structure down, aka an ABC? Yep. Yes, we can. And. And it makes sense. The wave structure makes sense. And then, of course, over here on wave four, or this current wave that we're in right now. You guys ready for this? This is the. Oh, I just love this so much because now this is not. This is not hindsight. We've taken the. We've taken the count that Joe gave us and said, okay, it's valid. I can find reasons for it to be valid. 1, 2, 3, 4, 5. Super nifty. Super nifty. And then we can go into this wave three and we can go, oh, cool, this wave three. I mean, here's the question. Do you think that I could have done this count or you could have done this count on bitcoin? Oh, I don't know. Over here. Two weeks ago.
Yeah.
And if you came up with the. All right, I think this is a one, this looks like a two, this looks like a three, This is a four. Any guesses, team? Could we. Can we plan for that, for that trend to continue? Thanks. Yep. And if you bought Bitcoin at 52,000 some change, would you be upset now that it's at 65,000 some change or up 28%? Would you be mad at me if I gave you that count and said, hey, you should buy bitcoin, you should be in some bitcoin.
So once it gets to the top of number five, are you expecting a pullback, typically after the fifth wave on the four up?
Yep. Yep.
So why.
Why don't we look at Nvidia and see when we can predict that's going to pull back?
Yeah. So Nvidia obviously is in a wave five now. Right. This was. This was a beautiful, beautiful pullback here. And so depending on how we structure this, if we look at. And again, we can start going back as far as we need to. But if we say we have a 1, this is a 2, this is the wave 3, and if you say a wave 3 is here, this was a 4, and this is a 5, that's fine. We can absolutely do that. And that does make sense. We just now have to make sure that we can do a white, A five wave structure inside of this wave three. And then we also have to make sure that we can do a wave structure of wave five, wave structure inside of that wave three. As long as that makes sense and we can do that, then this would be a valid count. Now, we're not going to get a ton into fibs in this particular class, but Fibonacci, all it does is. It's just a. It's a ratio. But what you're going to start to learn is you start practicing with wave structure team, is you're going to start to determine that you can measure very, very likely future waves and future patterns based on the size of a wave. Right. Wave three, again, often the strongest, often the longest. This would take wave five up into about 900, 920, give or take. But we know that this is in a bull trend. We know it's either. I mean, I Could draw it a few different ways. I could draw this as we're in a 1, 2, and all this is a wave 3, which means we're gonna, we're gonna pull back eventually and then we're gonna go higher or I draw it as a. We're in a wave five. And when we hit the top wave five, we're gonna pull back, we're gonna have a corrective wave and then we're gonna go higher.
Again.
Yeah, that's the coolest part about this. Now again, if we don't go higher and we start forming a double top and then we get a neckline reversal. You guys ready for the mental explosion? A double top is a failed 1, 2, 3, 4, 5 pattern. Because a double top like this, if you have an abc, we should just keep going, right, Eric? But if the double top turns into subbing a 1, 2, you know, an ABC, it turns into a trade down, trade up, and then we fail the neckline and we start moving lower. That was a 1, 2, 3, 4, 5 on the down movement. And so a double top is just a different structure of an Elliott Wave. That's all it is. And so the size of how big it's going to fall obviously is dependent on the size of the double top and how much the stock has moved and all those fun things. So yes, Nvidia is going to keep going higher. SMCI Super Micro Computer is gapping up right now as well to previous all time highs. So that means that if this was a strong wave three, and you guys remember how I mentioned earlier that usually wave fours are triangle patterns or like pin big pennant patterns or consolidation patterns. Here you go. Most likely a 4.
When, when would you start to count on like if it's going sideways for a long time like this one has.
Yeah. So great question. So let's go, let's go back up. So let's go to here.
Unless I'm looking when it starts to break old support or resistance and then you're starting from there.
Correct. But let's, let's go back in time, Scott, and let's go back to January before it broke out. And let's go. Okay, how can we do account now if we, if we're trading sideways like this? Here's the best news, Tom, the best news is any type of big sideways move, consolidation pattern or, you know, channel or distribution pattern is normally a wave four or a humongous wave two. It's either wave four or wave two. It has to be right if it's going to go Higher. Now I can go lower. If it's lower, that just means it's a big wave five. But, yes, you're absolutely right. You're going to have your support, you're going to have your resistance. So if I'm looking at this particular pattern. Let me kind of zoom in here for just a second so we can kind of see a little bit more granular detail. So let's say we start our wave count, and we're going to start a wave count at this point from the. The beginning of a wave, this volume. Looking in hindsight and saying, okay, we had a strong move here. That's fine. Use hindsight to your advantage. So if you're starting the wave count here and you go, all right, this was a 1, 2, 3, 4, 5. You got a big correction. All of this is some type of corrective wave. Even if you're drawing it at the time, you can probably see. And it's a little bit hard to see, maybe, but you have an A, B, C. All right, so you have that corrective cycle if you don't draw it that way. And you go, all right, I think all of this is a one, all of this is a two, all this is a three, all this is a four. You could do that. The main problem with that particular account is what notice wave one and wave four interact too much. So I don't really love that count. So that means that I wouldn't really do that one unless I zoom out a little bit and I keep putting more data on the screen. I go, all right, well, what about if I expect this is a one, all of this is a two, this whole thing is a three, this is a four, and then we have a big five. Is that a possibility? It's like, all right, well, maybe let's analyze the wave 3. So far, the structure looks correct. If all of this is wave three, then we need to make sure that we can do a wave five counts out of it. So there's your 1, 2, 3, 4, 5. Right. And does this wave three have a bunch of gaps, volume and candles? And the answer will be yes. Go ahead, Scott.
So I guess where I'm getting hung up is where the top and the bottom are. You're kind of going.
I don't know.
Because I see a different pullback than what you just drew on 1 to 2. I would have started it lower, and.
Then it would have been a small.
Three pop, which would have been nothing.
Well, you could. Exactly. It just depends on how small you want to go. Like, if you want to draw every single wave you can. But as you mentioned earlier, right wave. Wave three has to be. It can't be the shortest wave. So if you're drawing a structure and your wave three is the smallest wave, then you just know that that's not the correct wave.
Gotcha.
Yep. And again, all of these are going to be subjective, too. So as long as they meet the rules and they help you come up with what you see. So let's go look at. And we're going to be doing again, tons of this all month long. Let's just go look at Carvana. All right, so if we go look at Carvana and let's start from where we started the, you know, start our January. So we start in January. We were right about here in Carvana.
All right.
And so this is where we're at now. We can only go so far back, but this is all. This is all the data we had at the moment. So we can see that this was a. This was a move up of some kind of. And then we can see that this was a move down of some kind. This was another move up of some kind. So we can see that visually. So if we said, all right, I want to find the wave structure over here and see if I can master that wave structure, and then if I can come up with that wave structure, I should be able to build this wave structure. If I build that wave structure, I should be able to build this wave structure. If I build this wave structure, I should be able to know the future. All right, so let's practice it. Let's zoom in and let's just go. Because we're. We're going to use hindsight to our advantage. So we're going to start back over here, and I'm. I'm going to count all of Carvana until present day. So if I zoom in and I'm like, oh. And I go to myself, okay, is this a good 1, 2 wave structure? And the answer is no, because wave 2 goes lower than wave 1, so we can't start it there. So that means that we're going to have to start the wave one here. Right. We're using hindsight to help us. Okay, so let's start wave one there, which means that wave one, this is wave two, and this is a wave three. Wave fours are generally, what, ugly consolidation, pennant, triangle patterns. Right. Would you guys consider that to be one?
Yeah.
Yep. All right, so then we put wave four here, and then we have a big. We have a wave five. You're like, oh, wow. Wave five was really, really powerful. Sweet. So we had a strong wave five. Now this is fun. Wave three is not the smallest wave. That's fine. But what we're gonna notice is wave five. Notice you had a huge bull candle, massive gap up, bunch of profit taking, right? We've talked. We've talked about that bear fade. Wouldn't that be brilliant for a bear fade to come in at the top of a wave five, right? Imagine you had this count, Tom, and you were doing this count on Carvana, and you didn't see this candle yet, right? It just looked like this. And you, you thought to yourself, all right, this is a wave five. And then market opens and you see Carvana up here. You would say, all right, well, that wave count still makes sense. But if this is the end of a wave five, we should get what type of sentiment selling, right? It should. It should start to pause. It should be the top bull candle gapping up, right? 25 gap up overnight. Bunch of bulls are profitable. Those bulls are going to take profit. Same thing that we talked about last week, but now you can start seeing also another reason as to why. Okay, so now we. We fast forward over to here. So you fast forwarded. You're like, all right, sweet. So now let me see if I can count a down structure. So 1, here's my wave 2, 3, 4, 5. So that means that we shouldn't break this low on Carvana. This low should hold, and this low should start turning into a one, One, two. And what should come next? Should we get a good bull pop? Okay, eventually we do. So this is the. If I said this was the 3, 4, 5, does this wave structure work? The answer is no. 4 can't go below 2. So we would have abandoned that campaign when this resistance right here held. And we never took out that level. But we do know that this wave five kept holding. So what that tells me is you can still do the 1, 2, 3, 4, 5 wave structure. They're just going to be a lot smaller. A lot smaller, Tom, for example, 1, 2, 3, 4, 5. This guy a couple of pennies higher than the top of wave three. So it still counts. Still makes sense. If that's the top of wave 5, then we have to have a wave 5 down. 1, 2, 3, 4, 5. Which again tells me that we shouldn't go lower than this guy, which was the case. And then you would have had earnings. So earnings makes the 1, 2, 3. And now you can go, okay, we should be making a strong move at this point. Right. So here we go. So if you have a 1, 2, 3. If you're drawing this as a wave 4, does that wave 4? Would that wave 4 had made sense at that time? Absolutely. Now, to continue to refresh this drawing, we have a previous resistance here, right? Old resistance, new support. The Wave 3 has a bunch of bull candles and a bunch of bull volume. Right. Wave four is a consolidation triangle pennant pattern. And that simply means that if that was your drawing and you were aware and somewhere, somewhere over here, that you just had to kind of restructure your account like I did. Because that happens all the time. I gotta have a count here. That makes sense. There's your five. There's your one, two, three, four, five. There's your one, 2, 3, 4, 5. So we know we should have a retest and then ultimately move higher or a continuation of a move higher. Strong gap. Good. Close above resistance. So here's your resistance that we closed above. Amazing gap, right? Really, really beautiful gap. So there's the move up, which is the end of that wave five. We get the retest. We get the balance off of old resistance, new support. It was a retest gap anyway. So there's the end of your retest gap. Pull back into the moving average, and we just get this really, really nice pop out of here. Really good break on Carvana. And as we were. As you're drawing it, you're now able to see that after that really big move happens, now you can start zooming out and seeing bigger wave structures. Because we already knew that we should be looking to go bullish. We already knew based on our wave count, if this was a 1, 2, 3, this is a 4, this is a 5, we should have a really, really strong move. We should have some type of bullish continuation. Right? So our account at the time was 1, 2, 3, 4, 5. That's still valid. Even at the top of this, you gotta pull back. You got a correction. And as you're correcting, as you're pulling back and you start to notice a big triangle pattern since all waves are fractal. You're going to do what? 1, 2, 3, 4, Five. And you expect to move to go higher from there. And we go nice and high from there. And then we have a corrective cycle. 1, 2, 3, 8. Right. ABC, right. Eric, if this is the top of the wave five here, you have the abc, which there's a completion of. You have the support. It should break down that support. You start creating your patterns from there as well. And that leads us all the way to present day, where you break below of that pattern, that pattern, once that low gets taken out, new structure resumes. We break below, we retest, we start going lower. You have a gap. All of this is going to be. You're going to be able to count all of these waves very, very easily. It just takes time. And then you get to present day, then you get to where we were here. And when I'm looking at this pattern again, this was January. I see a 1, 2, 3, and I'm like, wow, this could be a wave 4, and this could be a 5. And the count makes sense, and the rules make sense. Except problem was, the big problem was wave three was the smallest. So I was like, wow, okay, never mind. This is a one, this is a two. All of this is a three. Which means what? And then you got what we. Then you got the exact trade that we took, ladies and gentlemen. You got the. Okay, wave four. And then. How cool is that? It's the greatest. I always have so much fun with this stuff. Now this is when you're starting to get. When you're nerding out and you're having fun, and you're like, I want to pick the absolute bottom of this stock, or I want to find, like, you start really diving into some waves, and then you can do daily chart. You start doing some weekly charts. Weeklies can help you see a little bit more of a composition sometimes. So if you look at a weekly chart, could you adequately do this, Eric? One, two. All of this is a wave three. That was a wave four, and this is wave five. Yep, yep, you absolutely could. And if you did that structure, and anytime you got a pullback while you were in this wave pattern over here, you would know to be kind of looking to potentially buy that. Buy that wave structure. Buy that wave structure. Dip. Think my computer's out to die. Let me see if I can get character. Yeah, I have a. Okay, cool. Does that make. Does that make sense? Family? Does anyone have any questions about that? I'm sure you do. And I'm about to do a screen share. I'm g. Might make you do some. Some Elliott waves. So the easiest time frame to start with, ladies and gentlemen, is usually the weekly chart. Sometimes the monthly, depending on if the stock's been around long enough. So really, really, really big time frames are easy to start with, and then you can start drilling down into smaller time frames. Okay. All right, so, Scott, you're up. I'm gonna have you do amd, and I want you to start with the weekly chart on amd. The good old weekly chart on amd. Let's go ahead and share your screen.
Yeah. I don't know where you went.
Hold on.
See it?
Yep, I got it.
Perfect.
Okay, so do me a favor again, just. All we're doing is practicing, right? There's no wrong answer. Start from here.
Start from here. So I would do 1, 2, 3, 4, and 5.
Hey.
Look at you, my dude. Good job again. I know it's super easy in hindsight. Like, oh, this is. So this is the easiest thing ever. But with that particular account, let's say that I made you do this exact skill set, this exact thing, like, three or four or five weeks ago. You're like, wow, we're gonna. We're in a wave five. Wave fives. When you start studying Elliott waves a little bit more, which we're gonna be doing, obviously, all month, is wave threes. And wave fives are very strong family. They can go on for an extremely long period of time. And if. Let's just say, hypothetically, if Scott did a monthly chart and realized that all of this was a wave 4 on a monthly chart, how long could wave 5 on a monthly chart last, Eric?
A long time.
A long. So many, many months.
Yeah.
Yeah. And that was my. That's my. My interpretation. AMD for a while anyways, all of this in blue was just a big, big, big wave four. So go to a monthly chart and see if you're able to kind of analyze that Scott monthly chart. Looking for the pullback that we just got as a wave 4. You might have to turn off RSI to get you some more chart room. Yeah, just click. How do you minimize that? There you go. Perfect. And then to make it even easier, do the log chart. So come over here. There should be like. Yeah, click that L right there.
Perfect.
There we go. All right, so it'll be. It'll help you see a little bit better. So now start from the bottom of 2016 and show me how that wave could be a wave four.
Let me erase this one quick. Yep. 2016. I would start in here. This would be a one, two, big three. This would be a four.
Huh?
Then the popular five.
Yep. There you go. Nice work. Now inside the wave three that you have drawn, give me a five wave count.
1, 2, 3, 4, 5.
Yep. There you go. Good job. Good job, good job. Seems easy, right? I get that. But again, we're still going to use everything that we've learned. So stay on this chart here for just a moment, because fam this works on the up and it works on the down. Right here is when I would have started being bearish on AMD in 2027. Can you all see why? Looking at the technical charts, right. Just looking at what Scott has on his screen, there's nothing stopping AMD on a monthly time frame. I'm sure if I go back in time, we'd find a really good wave count. And if I thought that this was an abc. Eric. Yes or. Yes. It should stop there.
Yes.
And that should be the low, Correct?
Right.
So what would happen if it's not the low? Down she goes.
She's got further to go down.
He's got further to go down. Which means that if, that, if, if that's the case, then that would do something like this. Which means that if you make a new low and you're like, wow, this is a really powerful move with a lot of strength, with a lot of candles breaking major support, then you can anticipate a wave four and then you get a wave five. And yes, Elliott, wave five called the bottom of the 2008 market on AMD. Fascinating. And then you get your A, B, C wave structure up.
Jeremy, can I ask you a question on this?
Yep.
Hey, buddy. So is this is kind of where Tesla is at right now, right? I mean, I'm, I'm looking at the. Okay, that's what I thought. So if it breaks above it, it should start the wave counts, you know, the first wave count. If it breaks below it, then it's. It's going to be the, the one.
You just talked about, right? Correct.
Okay.
I mean, it literally looks exactly the same as this chart currently. And so other than, you know, where you just took off your yellow marks, that's where it's at. It hasn't made the lower lows like this yet, but it's literally looks the same. So I just wanted to make sure.
Yeah, that's a good, good job spot. In that I would agree with you. That's. Yeah, it's, it's imperative that Tesla holds this level. Yep. Great call. Great question. Beautiful, beautiful work. Okay, awesome job, Scott. Scott wasn't confident he was going to nail it, but he freaking nailed it. You killed it, buddy. Just, just keep playing with you. Do an hourly chart and show me a wave count on the hourly chart really quick. Tell me what you see.
Starting here.
Oh, yeah, this is perfect. Let's just do just like that. You're about to love what you're about to see.
I see a one, small two, a three, a Very long four and a five.
Okay. Which means what?
We're looking at a reversal soon.
Yeah, we'll get a pullback. But that pullback would be most likely viable. Right? It'd be. You'd have some type of correction, and then. Now there's one tiny, tiny problem with your wave count. I'd have to measure it. But are you able to see what it might be?
I don't have a five inside the three.
And not only that, your three looks potentially smaller than wave one. I mean, we have to measure it, but it's, It's. It's pretty close.
Yeah.
So I try it. Try it a little different.
1, 2, 3, 4, 5.
Yep.
Not a steady hand.
Yeah, that one could work. That pattern could work. So again, you're getting about. About the same type of structure. You're getting the same type of feel.
Or this is the start of a three.
Hey.
Or exactly. One, two, three, three. Yeah, or five. Right. Which. Which either way just means that we're in a powerful uptrend. Yes. We should expect to pull back relatively soon. So this wouldn't be the time that we would go all in on amd. Right. We wouldn't be buying a bunch of it here. This is where we would stay in and just continue to earn our money. But if we get a pullback, should we be terrified of it?
No.
Correct. Because looking at this particular chart, that would e. It's either going to be a wave four, which means it's going to go higher, or it's just the end of a wave 5, which just means that we're gonna pull back something. That's. That's okay. Awesome job, man. That was nice. Nice work. Okay, who else wants to go next? Jeff, Scott's brother. Let's do Jeff. And let's have Jeff do man. Qualcomm.
Can you stop my screen share?
Yep.
I can't click on that button for some reason.
Good.
All right, there we go. And stop Share. So hit me with Qualcomm.
What Timeline?
Do a daily chart and I might give you a tough one. Start at. Start in 2022. Jan. Jan, 2022.
It's all a downtrend now. So you want me to do the five count going down then or the three abc?
Yep. Two, three.
It stopped drawing.
Sorry. Very good, dude.
Four, five. Does that work? No, because that's the bottom.
Huh? Yeah. Well, that's the cool thing about so about a wave five. I think you're. You're very, very close. Very close. The thing with a 5 wave is a 5 wave just is where this, the momentum kind of pauses right here.
That. That would be it.
Yep. That could be right there. We. We'd have to measure it to make sure that the wave 3 is bigger than the wave 5. But.
So you would still do this going down is what you're saying, right?
Yeah, yeah, you can still do it going down. Exactly. I just want to build people, be able. So you can. Wave structure going down or going up still definitely exists. Now, if you, if you had that drawing, let's say that we are here in the grand scheme of things, and Jeff sees this volume come in and has his wave 5 structure drawn. Could you. If this was your drawing, if this was your perspective, this is your thought process, could you be looking for a bull move?
Yes.
Yeah, yeah.
You have a. And you have high buying volume at a low, too.
Yep, exactly. I got high buying volume at a low. You got the potential end of a wave five. I really like. I, I love the top of your wave two there. I love the little, the little movement down and. Yeah, it's. It's really pretty. So after the wave five, draw either an ABC or a 1, 2, 3, higher. Or 1, 2, 3, 4, 5 or.
An ABC that goes higher. So 1, 2, 3.
Okay, there you go. So you got the 1, 2, threes. You're like, all right, that's the, that's the retracement. Because again, you drew a very, very strong downward wave five. Right. Which, when you draw a strong down five, Jeff, or on or anywhere else, up or down, if you're drawing really, really powerful wave fives, that simply means that you're going to get a retracement and then the trend will continue. Right. The trend should continue. If you're drawing super, super strong wave files on a bigger time frame. Right. If it's a five minute chart, you don't have to stress about it, but on a really big time frame, you should just get a correction and then the trend should continue. Now, in this particular drawing that Jeff has, maybe he thought that this was a 1, 2, 3, 4, and it's going to rocket to the moon and it's going to go higher. So if he thought that, where would have been the signal that maybe he's not correct in his bullish thesis and maybe you should start looking to go bearish. And my opinion would be it'd probably be around this 10ema candle here. Right. Because you had a bear gap down. We have a retest. Oh, you're good. We had a bear gap down Here, which is a retest gap. We have the retest of the move, we take out that 10 EMA candle, we break support, and we have a little bit of a reversal. And then. So. And then somewhere over here. Somewhere over here. Because if he draws this as a 1, 2, 3, 4, 5, and he wants to go higher. 4 shouldn't go into 2, correct family. So 4 shouldn't go into 2. That means he needs to abandon his bullish perspective. He then draws this bearish perspective. He has this corrective cycle drawn, and he continues to count. So go ahead and continue account starting from here as your wave one.
So. Kind of I'm going reverse. So I'm trying to think it's a 1, 2, 3.
I don't know.
Is that right? One, two. And that's your third one going down. Or would this. It would probably stop here actually. Hold on, let me redo that. I'm really looking at it. Maybe like that. 1, 2, 3, 4, 5.
Yep. Either that. Yeah, exactly. That would. That would have been it. Or once. Once this volume comes in and we trap that volume, I'll go from here to there. Exactly there. And so now start with this count as. Okay, that's the end of wave five. Start drawing up and. And tell me where this count starts to change.
So going up now where it's going to change.
Right. Well, no, pretend you're still in a bare trend and you're just counting it out.
So if you're count these waves coming down, then.
Yep. And then you're going to create one of these because you're. You're. It's going to keep going down. So you're going to have a 1, 2, 3. Yeah, just. Just like this. 1, 2, 3. Yeah. And then you would play the exact same type of pattern where you're like, all right, cool. We got a one, we got a two. And you're making some money here, right? One, two, three. Yeah, you're enjoying it. And then when four starts to come back up into where it starts breaching your 2 level right around there is when you know that the count is a little off. And something has to change, something has to shift.
Yeah.
Because no longer follows the rules. So you're like, wait a minute, look at all of this volume. Who's trapped down here? Tons of bears are trapped. We had a doe. Oh, wow. Qualcomm actually had pretty decent earnings. I think we might be reversing here a little bit. And so then instead of saying, all right, well, this was the end of a wave 5. Could this be a warning?
I'm so sorry. I gotta ask a question. Is it me, everybody, or is everybody and Jeremy? I don't know if it's my Internet or his.
I don't know.
I'm hearing him good.
I can hear okay.
All right, then it's gotta be okay. Sorry, Jeremy. Sorry to interrupt.
You're good, bro. You're good, brother. No worries. All good. So, yeah, so on this. On this count, right? One. Because that's the thing is with counts, ladies and gentlemen, obviously they're going to be changing, but they're changing based on the rules. Is that making sense, family? When you start to drawing things, you're like, well, this rule isn't holding up, so I have to be wrong. You then get a new perspective of how to shift your position. Because here's the thing. You can still have on this wave, 1, you can still have this 1, 2, 3 on the way up. And on this wave 2, you can still have a 1, 2, 3 on the Way down. What changed is that was just a corrective cycle. And so once this rotation passed that wave two and started no longer dropping and got inside the wave, you know that it can't be a 1, 2, 3, 4, 5, because it breaks the rules of wave four retracing into wave one. So now you have to go, okay, this is still valid. 1, 2, 3. Fine. Then you have a corrective cycle. A, B, C, fine. And then you have a bull move up 1, 2, 3, 4, 5. And when this 5 wave makes a new high relative to everything over here, then you have to say, this looks like a 1, 2, 3, 4. And Qualcomm should go higher into 2023. And that will begin. That will begin to begin the. The perspective shift. So go to the right a little bit, Jeff, and we should start seeing some bull moves on Qualcomm at some stage. So the. The goal really is, as you're starting to create your levels, what has to happen is you're going to create your accounts. And once you have your accounts created, you will always know what levels cannot break in order for the rules to continue to be sustained. That's really, ultimately the big takeaway is because for me, you're going to be going from monthly, weekly, daily. Those are going to be your three perspectives. And as you're on your bigger, bigger perspectives, you're going to start working on seeing where you need to be drawing your waves, what wave count you should be in, what rule structure is correct so that you do not break your rule structure. And as long as you no longer break your rule structure, you're going to have a literally a time traveling machine. Scott.
So I understand what you're saying, but how, when you're can't see the future right now, how do you know that your wave is going to get a 1, 2, 3 inside of it versus a 5 if you're already in it?
Totally. I mean, long story short is you, you don't, you don't know, but you're planning for if it's a 1, 2, 3 or a 1, 2, 3, 4, 5 inside of it. If you get a pullback, you're going to look to plan to get in on that pullback and then you just know where the wave shouldn't go. So you're going to have your stop loss there. So this, this is a great example. I mean let's look at right now, present day Qualcomm, like at this exact second. So here would be my wave structure, my particular wave count at this moment. So we have a 1, all this is a 1, this is a 2, this is a 3, this is a 4, this is a 5. We got a correction and I can see it ABC, which means this is a 1, this is A 2. So we're in a 3 wave right now. So this 3 wave, we should continue higher. And since we're in a 1, we should not be breaking this low at all because that's the wave two. So any pullback that we get is viable. Unless we break this low, if we break that load, then the wave counts off and then we have to change some things. But as long as we hold this level two, this wave two structure right there, unless that candle is taken out, this trend is going to continue to go bullish and with your wave. Go ahead, Jeff.
Sorry. So at the, at the top of wave five though, that you just counted, you didn't have an ABC on the way down though. So would that not consist of a wave, a down pattern from there? I mean, I, I guess kind, I mean.
Yep, I guess it kind of is abc. They sneak up on you, man.
The same question. Thank you.
So even if it's one candle, we count it because it's a correction.
Correct. When you're on a daily chart, when you're on a daily chart, one candle can be a wave. Yes.
Okay.
Yeah. One candle can be a way. Because it's all, because it's all fractal. Because if I draw, if I draw a bigger wave count team, if I do this as all this is a one, all of this is a two. And all this is currently a wave three. If that is my count, then that means that inside this current wave three that we have, this is the one. All of this is the two. And that means, that means that right now Qualcomm is in a three of three, which is a very, very, very strong bullish signal. That means that we're gonna go, we're gonna continue to go higher pretty forcefully. And the only way I would really be able to know that is to have done some work on the weekly or the monthly chart on Qualcomm and really start trying to identify just the general pattern. So since we're here, let's do that really quick. Let's go pop out to the weekly because again, team, keep in mind, this is day one.
I'm sorry, would you, would you say I'm sorry to hear what chart you.
Wanted me to go to?
Oh, you're good. Go to a weekly chart. Yeah, yeah. And so just keep in mind, family, this is day one. Right. Of our analysis of Elliot wave. So we're going to be practicing this all, all month. Because I can promise you, I promise you, when you start really nailing this stuff, it's going to become the coolest part of your analysis and you're going to just love it so much. So zoom out a lot. Go ahead.
Brian, what have you found to be the most effective time frame? I know you said that you use the daily and, and you don't really use this on the smaller time frames. What is your favorite time frame to see this on?
I do use this on smaller time frames. I just don't take a lot of weight to it. Like, I know that smaller time frames, like if I'm looking at, on a five minute chart, a five minute chart isn't going to impact the monthly chart or the daily chart.
Right.
Like it. So it's okay to have an Elliott wave count that's really bearish on a, on a one hour chart and be playing something bearish. So the answer is weekly. I mean, weekly is where I will spend tons and tons and tons of time doing wave counts. And once I have a lot of time doing wave counts on a weekly chart, then I'm gonna start to get a really good perspective of what I, what I expect to see.
Awesome.
Thank you.
Yeah, you're welcome, man. Absolutely. That was, that's a good count. That's good counts. You got the three, you got the four, you got the five. That means that all of this could be a corrective cycle. Right? You got your 1, 2, 3. Which means that this needs to be the low. And so far it is. And so if this is the low, that if this really is the low cycle for this particular move, then we're going to slowly be inching up. If this is a one, this is a two, this is a three, pullbacks are going to get bought. We're, we, we, we're going to hit new highs on Qualcomm. I mean that's, that's this current analysis. So now go to a monthly chart for me, Jeff, really quick and just really see if I see anything else different. So I got a monthly. So again, all I'm doing is I'm starting to look for wave threes. That's it. I'm just looking for waves. So this is a wave three of some kinds. It's super, super powerful. So that means that this is a one, this is a two, big wave three, this is a four, this is a five. So all of that was a corrective cycle. And now we're back to the, we're back to the overall bull trend, Tom. So again, buy two when you have a buy here at 145. I don't know if that's recent or not, but I would agree with that. If we pull back at all, this is a very, very viable event. And again, if you did any of this analysis previously, if we go back to the daily chart really quick from a. Jeff, if we go back to the daily and we're able to look at. All right, where was Qualcomm recently? If we did some of this analysis a month ago, Tom, right before we got this earnings, earnings report. If we do a little bit of this analysis a month ago, we're not changing a lot. We're still right here. And a month ago, if we do this Qualcomm analysis and I determined that, man, I think we're in a wave three. We just got out of a corrective cycle based on the monthly and based on the daily. Sorry. Based on the monthly, based on the weekly, would we still have the buy here analysis? Yes or yes.
Yeah, it's a good support too. That's why I did that.
Yeah, totally. And so because again, the Elliott Wave thing is something that I will spend an extra hour on if I really want to put some size into a position. If it's just a normal run of the mill, whatever, who cares? I'm not going to really do much with it. I don't have to. But if I'm like, you know what? I'd I'd like to spend some time and see if I can do account really quick and maybe spend an hour on this chart. It's like, would you spend an hour, Eric, to make an extra $100,000? You know, I would. I like that. I like that return on my investment. So for me, if I'm looking at something like on Qualcomm, you were absolutely right, Jeff, that, hey, this is just old resistance, new support. I'm going to buy it. You're 1000% correct. That's all it was. But if you're also like, well, let me also do a wave count and see, could have bought a lot more. And if you have a really good understanding of man, this is a strong trend and this is why. And this is all the information. And I am pretty confident this is a 1, 2, 3, 4, 5. And we are getting an ABC pullback. And I want to buy the dip of that ABC pullback into a bigger wave three on a weekly chart that you could have bought 20,000 shares at 145, and now you're up $20 a share and you made 400 grand. Right? It's just the math. That's what I love so much about the markets. That's what gets me just so amped. You guys ready for some homework? I want each of you to pick one of your favorite stocks. Just one, as we're going to practice it. So pick one of your stocks. Call it Apple, Tesla, Google, Amazon, whatever. I want three wave counts. I want a monthly, a weekly, and a daily. Be it. It could be any time frame. So if you want to do about this back in 1999, you can. I would. I would suggest spending time on current charts and just really seeing what you want to see on a month. Month, weekly, daily. And just make sure the rules work. That's the big piece. Because the rules have to work on, on each time frame as you scale down. The rules still have to work. And I'll be looking over your homework. I'll be seeing how you're doing. So post some charts today, post some charts tomorrow, post some charts Wednesday, and obviously on Thursday. So. And then we're just going to keep practicing it all month. We're just going to keep practicing wave counts and knowing where. Where is what and how and when and why.
So, Jeremy, you said wave four cannot retrace down into wave two.
Wave one, The. The lowest it can go is the top of wave one.
Top of wave one. Okay, I didn't finish that sentence. Thank you.
Yep. So I'll Draw it out one more time. So this is, this is wave one, this is wave two. This is wave three. Wave four shouldn't go, I mean, maybe a couple pennies, I guess it depends on the time frame, but it really shouldn't go much farther than right here.
Okay.
Yeah, but it definitely, definitely, definitely can't go lower than the low of wave two. That's a, absolutely a fact.
Okay.
And I'm sure all of you know this, but yes, this is, it is subjective. But again, once you master the rules and you spend 100 hours looking at waves over the next year and you know what? Rules cannot be broken. You guys are going to get some dirty counts and these dirty counts are going to be like, wow, I'm going to go bullish on Qualcomm. And here's 408 reasons why. Do you think you should buy two shares or 2,000?
Right.
Makes sense. Yeah. So that, that's how all this, that's what I'm building to families. Like we're going to continue because you're going to go down through all the things, multi time frame analysis, the different candlesticks, all the moving averages, the wave counts, the gaps, and you start adding all of those pieces and components to it, plus the vault. I mean you could take five trades a year and make half a million dollars. It's available, right? It's really easy. You're just gonna be studying a lot and looking at charts and planning and doing, doing some research ahead of time going, this is a really great trade. I'm gonna be, I'm gonna be in this to win this heavy. Just putting up, putting the odds and the probability in your favor. Okay, Any questions before market open? Anything that you all want to look at or review?
Yeah, I mentioned earlier. I'm sorry, go ahead, go ahead, Brian, go ahead. All right, Jeremy, if you look at the 5 minute chart and zoom out over the last week on Tesla, how concerned are you that it has had four straight days of lower lows? And this morning in pre market we made a lower. I'm sorry, hold on. The last four trading days have had lower highs and this morning we made a lower low for the first time, but it was only by about three pennies.
What?
Are you concerned about that at all or what? How are you going to play it? Because I'm not. I'm just going to go and tell you I've been buying shares at 198.50 every time it's hit that number over the last five days because I have a Strong feeling that it was going to bounce. But you know, right now I'm still green by 20 cents. But I just want to know kind of what your thoughts are on it.
Yeah, totally, man. Well, I'm glad that you saw that 198 level. I mean really, essentially Tesla's been an inside day four days in a row, which is super rare, or three days in a row, but very, very small candles. Today will not be an inside day. We will go a little bit lower today and we're sitting right on top of the 10 on the daily and the 50 on the monthly. So this is a really, really big level for me. Give it 30 minutes, don't panic. But if in the, if in 30 minutes after market we're below this level, look to protect yourself on some level of retest because if we take out all these lower shadows 30 minutes or an hour into the market, I'd probably be a little bit more bearish on Tesla. Just down into 192. I'm not, it's not. I wouldn't call for end of the world yet, but yeah, all this consolidation, we're kind of gapping out of it today. Don't, don't do anything too early in the morning because we're at such a key level again. But if after 30 to 40 minutes we're below 198, then I would probably look to protect yourself with some level of a short.
Perfect.
Thank you. Yes, sir. You got it. Scott, what you want to look at?
I just had a question about the, the whole waves and everything like that. So when you go in, you do your analysis. How do you, are you still building an hour at that point? Because you're still going to have some type of stop loss. But obviously if you know and you're confident and you. Like you said, at this point I've checked off more boxes than we ever have. Going in with some size, your, your R is going to be a lot larger than you normally play.
Yeah, exactly. You can still have a larger risk unit. I mean a risk unit is just, that's what, that's what's cool about an R and R is just an R. So it's like even if you lose that risk unit, you're like, all right, whatever. I put it out there, I tried my best and that, that's happened to me on some positions. But it's usually when I doing it, it's because I'm going counter trend and I'm, I'm doing it off of something I hope is going to Happen based on what is actually staring in front of me in the screen. Yeah. And it will still be a percentage of your account. Right. It'll still be something that you're spending time doing the actual work to know how many shares you should buy rather than just randomly getting in on. You know, if you buy 2,000 shares of Chipotle versus Square. Right. Versus Coinbase. So those are all three different trades pretty dramatically. So you still want to know a on approximation of how many shares you're going to get in based on your risk. Yep. And it could just be a little bit of a bigger R. I agree. Great question, my man. And we're going to keep building into this as we progress. Ms. Sue. Anything for me? Anything you want to look at? Yeah.
Google. Google, I would love for you to look at.
Oh, I can't wait. This sock. I'm so happy it's going lower. What a great company. This is going to be so much fun. So Google, ladies and gentlemen, having a nice small gap down 132.75 could easily be the top of a pyramid or just a spot that you start looking to get in. That's the 200 on the daily. We haven't, we haven't touched that since this time last year. So it's been a year since we've gotten down there. Really, really beautiful retest gap. Right. We had the bear kennel gapping down. We had the fade. Beautiful bull opportunity to make tons of money there. We've broken strong bear gap and go close below the 100. Retest of the 100. So I think we're going to here, personally, I think, I think we're absolutely hitting the 132.75. And again, I'm in Google. A lot of people are in Google long term. This is obviously not time to freak out about at all. And this is just a time to hope and pray that we get down to here. That would be the greatest thing ever. But this is also an ABC correction.
Okay. I was trying to do the count on it and I. Yeah.
So 1, 2, 3, 4, 5. New all time high new resistance. So we're going to get in the ABC and you can draw that as much as you want. Maybe 1, 2, 3, 4, 5. And again we can go down a little bit lower. But that one 30ish area, that's going to be a good spot to start picking some up. I got a question about that.
So I'm in some shares at 139. Should I just unload those and take up down and write it up.
I think the second one. Yeah, I think the second one because again, you're, you're getting, you're getting flush with cash over there. If you're selling your cues so you can pick up a few more shares off the 200 because. And start working on your pyramid because it looks like you just bought some off the hundred. So try to figure out what, what type of pyramid level and what type of risk you want on Google and if it's something like that. All right, 139, 133, 127 and 125 and just kind of come up with, okay, this is my risk profile. This is my R for Google and the sum of shares I want to own. And this is where. Yep, perfect.
Looks like it's going to hit 132 right now.
I know. Yep. Yay. Exactly.
So would you, would you sell a put. Would you be comfortable with 100 shares at 132 or play that game or not?
Yes. I wouldn't sell a 132 because we're right there right now. So that tells me just to do a limit buy if I want to get 100 shares because I'd absolutely get 100 shares at 132. No, no fear about that whatsoever. But the way with, with the way put sales are, just start looking for your premium and probably try to find some premium down here for this Friday, Tom. And if you want to buy a hundred shares, just put a limit order at 132. Otherwise if you sell a put, sell it somewhere around 128, 126, 27, something like that.
Nice.
And then with Apple, we already kind of went over Apple last week too. But you think like, let it try to get to the 172 range or do you think because you have a really nice gap down on Apple right now too.
Yep, I agree. So Apple, the two places that I'm buying my Apple are 175 and 165. 175 and 165. So again, Apple, Google, going down. A lot of the other semiconductor stocks and cryptocurrencies are going up and other random stocks are going up. All know that Apple and Google is going to go up over time. We just want to get them at a nice discount. Yep. 175 and 165. That's the two prices for me.
Thank you.
My pleasure, brother. You're welcome. Let's go look at my boy Eric's Q's position. Are you going to get back in the Qs or you just going to play your app on Google?
I don't have plans to get in. The queue is pretty high, so I'm just messing around.
And Tesla, Google and Apple right now. Yep. Okay. I like that plan. Okay, well team, keep me posted if you need anything else. Always here to help. Stay patient. In March, I would love a legit pullback in the market. Again, like we, we still haven't gotten one. The biggest pullback we've gotten was right here, this 4 or 5%. So I am, I will be a dip buyer, but I'm certainly waiting for more dips to come in. I'm. I know a lot of you are going to get called away on some things. Joe's going to get called away on Coinbase, Carvana. A lot of people are going to get called away on Carvana, most likely if you did the 70 or 75. So there's a lot of our positions are looking beautiful. But just keep me posted if there's anything else I can do to help you. We, we should be back on Thursday, but I'm waiting for one small thing from my wife regarding a flight, so I might have to make a tiny, tiny adjustment. But I'll keep you all posted. I'll give you as much notice as I can. Worst case scenario, we'll do it on Saturday and we'll just go a little bit longer than an hour, but I'll still be around to answer any questions that you guys have. I'm just kind of waiting back on her to give you an update on a flight thing. So keep me posted if you need anything, any trades, any charts, day trade, swing trades, investments, crypto, stocks, whatever, post it into the chat. I'm always here for you, family. And then get me your wave Counts for one stock on three time frames. Daily, weekly, monthly. Start with the monthly, then go to the weekly, then go to the daily and just kind of like zoom in and zoom out and start prepping what you think is going to happen. Thank you. Yep. You're the best family.
Thank you.
Bye everyone.