ULTRA WEALTH!!! CLASS 1 WEEK 1

Jerremy Newsome leads the first Ultra Wealth mastermind class. He outlines program goals and cadence (live sessions Mondays pre-market and Thursdays during market; WhatsApp for mid-week notes). Month one is devoted to Multiple Time Frame Analysis (MTFA): start monthly (use log scale + 100/200 simple moving averages), then weekly, then daily. He emphasizes quality over quantity of trades and studies pyramiding as a dollar-cost averaging method (4-entry pyramid example on Nike with total risk $20,000 → $5,000 per level), order settings (GTC+EXT, limit orders), stop placement after fills, and alternative approaches (DCA, put sales, collars). He reviews broader-market outlook (expects a pullback ~10%), and discusses specific tickers to watch (SPY, Qs, Tesla, Nike, Nvidia, Intel, Google, Carvana, Rivian, Walmart). The session is interactive with audience Q&A and homework to post charts to WhatsApp.
Questions this video answers
100 and 200 simple moving averages (SMA) on monthly and weekly charts.
Multiple Time Frame Analysis.
Limit orders set as GTC + EXT (Good Till Canceled + Extended Hours).
Total pyramid risk = $20,000; divided into four levels → $5,000 risk per level.
Chapters
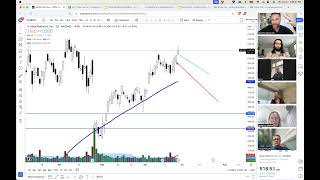
Hey, welcome team to Ultra Wealth. I promise I won't be this happy every single opening. But I'm very, very excited about not only this program, but the next two, three, four, five, six months together. To give you a quick little rundown of our goals and intentions for this class. Just for five minutes. And I do have slides, don't worry. But the goals and intentions in this class are to elevate your trading, to elevate your mind, help you really transcend your thoughts. And if you change your thoughts, you change your outer world, right? Fastest way to change your outer world is to change your inner world. What you think about, who you associate with, who you spend time with, what you talk about, what you discuss, what you think about. I know we all know this, but really, I would love to all come together in a really beautiful unit and just openly often discuss money, discuss wealth, discuss growth. So what we're going to be doing in this Mastermind together is we're going to be meeting Mondays and Thursdays live Monday during, sorry, Monday before market open to just kind of go over a course, go over our information, go over an outline and also talk about what my expectations are on the market. Just so you're all aware, kind of talk through some things and answer of course, any and all of your questions about any trade setup that you have. And then Thursdays we're going to meet during market hours to do the exact same thing. Review any trades that you're in, discuss any setups that you have discussing questions that you have. Also review some educational material as well. And during the middle of the week that Monday, Tuesday, Wednesday, Thursday, Friday, I might post some things in WhatsApp, some messages, voice memos, videos, small exercises, small homework. But I do want us all to slowly get better at every single thing that we do. Make tiny little incremental growth, make little tiny micro adjustments to our game. Because we do that over the next six months, we see massive results. Last but not least, this is this particular invent event. Mentorship is not a day trading mentorship exactly. I know none of you guys thought it was, but we can definitely take day trades. But my goal for this class is definitely quality over quantity. In fact, if I take two amazing trades a month and every single one of those trades are winners, I'm happy. So it's all about quality in this particular course. It's not about quality of reps. It's just about making sure that you all see exactly what you want to see. And you know when to do this now because there are times and sometimes when you sling the hammer down, you miss the nail and hit your thumb. It can happen but when you get it right, it also that also will happen. And that's a very, very great way to accelerate is to just really know what you're focused on, to really see it, to be in it, to be in it with some size, to be in it with some conviction and to really accelerate. So that's kind of the goal and the purpose of the course. I will have slides each class so that we can really visually see some things as well rather than just audibly. And you are also welcome to get access to the slides. All that stuff will be shared. This is really, really wonderful program and I'm very, very excited about it. Before we jump in, any questions for anyone who is here and true. I love those shades girl. Let's, let's go. Amazing. What's really cool too is everyone who is here. I, I, I know quite well and I have some great stories about every single person here and I'm sure I'll be sharing those over the the course of the program. And I know you all know this as well. But with every mastermind, with every group, it is the, the power is within the network. So we will be posting charts, we will be posting trade setups, all that stuff. Of course, all we in WhatsApp. But make sure that you all just connect with each other at some particular point in time. I will never inundate this course, this, this program, this group of people with random messages that have no meaning or relevance. But I do want us to all make a lot of money together because I love money and money is awesome. But I also want us just to grow. So make sure that you all connect with each and each, every person here outside of class. Because there's so many phenomenal, very, very wealthy, extremely talented individuals here. And it will be advantageous for you to make sure that you know everyone here, what they're about and what they're doing in life and how you can help them. Cool. So since there's no questions, let's dive in. This week will be review for 90% of you. Although these slides have never been created or shown before. But most of you, this will be a little bit of a review and then we're going to start getting into some educational content that's probably relatively new for a lot of you next week and then every single day after that. Now, I'm not going to promise that every single class you're going to learn something brand new. For those who are Here, A lot of times it might just be a little bit of a refresher, but at the end of the day, my, my goal is to help you tweak your analysis, get just a smidge better, and take five or six great trades every single month that make this course extremely financially easy for every single person involved. But most importantly, as I told Jeff, Eric and Scott, when you go through and you finalize this mentorship family, any other mentorship that you ever take in the future, well, because you, you want to, not because you're going to need it. That's the other point. I love, I love taking mentorships. I'm in five or six every year, but they are out of desire and curiosity rather than need. I am saying that it's always great to be a student. It's always great to be learning. Socrates said the thing that I know most is that I know nothing. It's always a beautiful quote. So, yes, I'm always going to continue learning. But when you go through this course and we finish it after the end of the six months, I'm teaching you everything that I know about wealth and money in this course. So when we're finished six months later, you will have known everything that I know. And so if you ever take anything else with me or with anyone else, it's not gonna be. Because it's gonna be an information gap. You will know everything you need and yes, you'll have access to the recordings for life. They'll be yours. So you can rewatch them as many times as you want. You ready? Let's do it. So month one, this is what we're going to be diving into. Multiple Time Frame Analysis. We are going to be spending a lot of time drilling down and looking at different things and really, really studying it. If you ever see the acronym mtfa, that's what that stands for, mtfa. So if you ever see that, that I posted or see it somewhere else, multiple Time Frame Analysis. That's what that means. So that's all of month one, studying these charts. We're gonna really, really master the technical analysis portion of everything. We're gonna get to the point where you eat, breathe and sleep this stuff. And then ultimately, once you get past the point where you're like, okay, cool, I know what charts are now. I know how to do this. All of this analysis that we're going to cover the entire month will take you three minutes to do. So we're going to be studying four weeks for three minutes. But that three minutes will become so efficient. You can look at anything and know exactly if you should take the trade or not. And that's kind of very similar to that TTO biologics trade that we took the other day. It was a perfect setup. It was a plus all around, high quality, gorgeous. And it was all based on the analysis that we're going to be teaching not only today, but the next couple days. So what we want to do today, week one, session one, because we were gonna have our second session on Thursday, is we're gonna talk about the analysis of the weekly, monthly and daily charts. Here's the questions to ask when you pull up a chart. We all know the phrase, if it has a chart, it has a heart. What I want to do, what I want to understand is what's the major trend on a monthly chart. That's first question I'm asking. Second question I'm asking, is this asset high or low? Basic, obvious questions, but it really helps you understand size, right? Because the assets really, really high doesn't mean you can't buy any. It probably just means you're going to be buying a little bit of a smaller amount. But if it's low, well, obviously, right, Buy low, sell high. So those are the questions that you want to ask on everything that you pull up on a big, big chart, major time frame, then Eric's favorite moving averages. You're going to use the 100, 200 simple moving averages on the monthly and weekly charts to really, really understand what everything is doing and also just know where they're at on all time frames, always. Because those two, those two moving averages on a monthly chart and a weekly chart really are extremely popular and widely used in institutional trading. Banks, hedge funds, mutual funds, money managers, they use these moving averages. I've talked to them, I've studied with them, I've interviewed with them, I've sat down with them. I've seen their charts. Some, a lot of these big, big institutions will just have those two moving averages on their screen. That's it. Because if a, if an asset pulls into that price, they buy it. Now the one thing they don't do is they don't sell it. Money managers, I'm not saying that they're all bad, but most of them, as TARU knows, they're not doing anything active with your money. They're just, they're, they're taking your money, they're buying something and they leave it alone for 36 years. And so this is where they're buying, but they're not doing anything out outside of that But I do know that they use these. And so what we can do is we can buy off of there, sell off of there, and really, really interact with it beautifully. So here's a good example of a, of a trade from top down analysis in phase energy. This was a really, really cool trade that happened over the last few months. But this is the monthly chart. Now when you're looking at this particular chart, you might not necessarily think that the assets just going straight up or you might not look, it might not look like it's going up at all. Maybe it looks like it's going down. So what I've, what I've realized is a lot of traders, they, they forget one particular part of trading is that it's all percentages. Because if you look back in 2017, the stock was like a what, $10 and then it went up to 300. So this move here, although it's very, very massive, this is a relative percentage move based on the overall trend. So check this out down at the bottom right hand side of your screen. This will be new for a couple of you. You can hover over the Y axis and select the log chart which is by clicking on the L. So big time frame, this works really, really, really well on a monthly chart. Not so well in other time frames, but it works well on a monthly chart. But if you click on the monthly chart and you click the little L down here on the Y axis going to create a log rhythm chart and then you can click A to autoscale and the next slide will show you what that does if you do that. So here's what it does. Now, totally different chart, kind of in a way a little bit. But now what you're looking at is the entire trend based on the percentage gained of the stock. Because $1 to $2, a hundred percent. Right. But a hundred to 300 isn't as explosive if you go from 1 to 4, which is that move right there, versus 100 to 300, that's that move there. So it just breaks up the chart a little bit. All it does when I look at this is it just helps you see the real, real, real big picture. Why did that happen? Not a big deal, but that's interesting. Okay, cool. I don't think there's any massive questions on that, but that's just on your monthly chart. So now when you do that, once I'm on the log rhythm scale, I will pop into the 100 and 200 simple moving averages. I want to see where they're at and then I'm going to operate from a monthly, then a weekly and just analyze everything, see where everything is at. One thing that we're going to be doing is we're going to obviously, as you all know, my main method of operations anyway is I'll teach you some stuff and then we're going to go look at it in real life. So the company's called Real Life Trading. So we're going to look at all this stuff and then we're going to drill down into the actual chart, some actual charts, actual companies, see what they're doing and see how we can kind of analyze it. But if we turn on that long term moving average, what now happens? It's like, all right, well we can see that the overall stock is an uptrend, in case you didn't know, right. You can see this is an uptrend. And then you're, you're having a pullback. Now this pullback in red. Well, let me do it a different color. Here's the overall trend right here. And this is the quote unquote pullback, which earlier looks pretty gnarly. Would you all agree? It was like, wow, the stock's going to go straight to zero. We look at this chart. You're like, ow. It's just a nice little pullback. Just, you know, little comfortable, small little pullback. And it's pulling back into the 100. We are going to study volume a lot in this, in this course in class, so just be prepared for that. But we pull back into the 100 now, letting you know, okay, cool spots to start buying. This is da. This is now a support zone for your long term trades, your day trades, your swing trades. I've had to battle this into, really slam this into my brain because my brain always wants this to happen. But if you ever write one reminder to yourself in trading, you'll never buy the exact low. Markets are just too big, they're too fluid, they're too liquid for that. So you're never going to buy the exact low. So if a stock that you're in is moving against you for a period of time, day, week, hour, month, it's okay. Okay, so 100 simple pulls right back into it. Now we know that there's that support there. Then you can go into the weekly chart. So here's the weekly. Now, ironically, I think this is the first time I've really, really, really started practicing this and being aware of it. But on the weekly chart I have, I've pretty much concluded that the 100 weekly is stronger than the 200 weekly. I don't really know exactly why that is, but I do buy off the 200 regardless. But I've noticed that the 100 on the weekly is stronger than the 200. When we get to the 200 on the weekly, I actually generally expect it to break from there, Although I still will buy off of that particular price and I will still look to go long off that particular price. I am less expecting it to just crush higher. In fact, I kind of expected to ping and pong. And I'll show you a few of those examples as well. But what we can also see is if you were taking this bearish or if you were expecting to make some money on the downside, you could have made good money between here on the downside. And then of course, if you're analyzing this blue line as a support level, you can also see how we consolidated and traded sideways at that support level for a few weeks and then we broke below it here, giving us again more opportunity to make some money on the downside. And if we know that the 100 on a monthly chart was here, Eric, true or false, we could have really easily just made some quick cash on the downside for this bear position until it got to the 100 on a monthly. True? Yes. True. Yes, yes, yes. All right. So Jeremy, what do you feel is important or interesting about this consolidation here at that support? Lots of selling pressure, the candles, not a lot of price action compared to like the previous candles as well. Yeah, but it's just consulting right on that support line. Precisely, precisely. And this, this makes, this makes for very high quality trade setups. Team is consolidation on a support, on a resistance. Whatever you're looking for. The longer something trades sideways, the more pressure that's getting built. And that's really what you want. I mean, you want a stock, especially if it's at a support or resistance line, that you're looking to go longer, to go short if it consolidates. I'm absolutely saying that you could have been buying here for sure. And we'll talk all about options and stuff later. Don't you worry that consolidation is people literally buying. They're, they're buying off that support. They're being robots and they're getting it, they're getting in there. And then once it breaks below all of that price action, again, all the buyers are trapped and obviously it goes a little bit lower. So we're going to do for the remaining of this class before we hop into some real life examples and also for Thursday's Discussion during market hours is I'm just going to walk you all through the main question that a lot of you are probably having right now, especially Jeff and Eric. How do you buy this stuff? Right? Like what are the strategies for when the market drops? Because there could not be better timing for this particular class because we are going to have a pullback in the broader markets very soon. It's going to be pretty, it's going to be pretty hefty. Also, when I say hefty, I just mean like we're going to have a fast, sharp decline because we, I don't know if you've noticed, have been going straight up since like October, which is awesome. That's cool. But we're going to have a pullback and one of these three things are going to be very useful. So we're going to discuss today for the remaining classes pyramiding. Tomorrow we're going to discuss dollar cost averaging, the different ways to do it. And then later in class we're going to talk about put sales and long term call options. Now the reason I say that this is my least favorite is because market drops, it's really, really, really hard oftentimes to time the market with options. It can be useful every now and then. But we'll talk about it later. You're just going to make a lot more money trading shares for the, for the newer trader. For somebody who's been doing this less than six years, you're going to make a lot more money on shares. Simple as that. You can, you can make faster returns, but the returns are still gonna be smaller dollar numbers. But all of you will be more comfortable with shares because they don't expire, they don't go away, they don't randomly diminish in value. It's just all, it's just all math. Eric, do you have a question, my guy? You're good? I'm good. Sweet. Beautiful. All right, so let's go talk about pyramiding. For the first time ever, I have actual legit cool slides on pyramid. So this I will break down and I'm not gonna beat around the bush. I'm gonna give you guys my pyramid on Nike. I do have one in place and I want to share it with what it is. So all the numbers that are falling on Nike are my personal numbers on my personal trade that I'm setting up because it's Nike. My wife bought every single person in my house Nike shoes for Christmas. So it's like, all right, newsome, get, get with the program, right? It's not going to go away. Have you guys ever, have you guys seen the movie air yet? Okay. Drew has a few. Is that, is that on Amazon Prime? Is it on Amazon Prime? Think so. Trying to remember where I saw it.
It's a good, it's a good show. It's on Apple.
Yeah. Yeah, it is. It's nice anyway. But that, that is a cool take on the, on the movie. When it came out. This is not exact, but it started, it started getting buzz in the theaters around here. So it had a pop. And then, you know, we pulled down to the 100 on the monthly and this is when it actually came out for people to watch. And then we had. So, you know, I don't know if it's exactly correlated, but I did have someone bring that up in class one. So I was like, oh, that's interesting. Your entire pyramid will have a risk unit associated with it. So as you're building a pyramid, your pyramid will have a total risk. What that means is again, not an investment amount, but how much you will lose if the, if the entire pyramid breaks. So if the stock crushes below the whole pyramid. So an example would be if this happens now. Again, there's ways to protect. We're going to talk all about options later, I promise. But if the whole thing breaks down, you're going to lose a certain amount of money. My particular pyramid on Nike is going to be 20 grand. So that's the top to bottom entire risk. So if Nike goes all the way below 50, which we'll talk about in just a second, that's, that is going to be my, my loss, $20,000. Usually pyramiding has larger risk values. So if you do these strategies, this particular strategy, it can be done on any time frame. We're going to talk about that in just a moment. But normally you're going to have a little bit of a larger risk unit with this particular strategy. John Alonzo, can you give me an idea or a guess as to why you think that might be why it would have larger risk values? Sorry, what was the question again? Why do you think pyramids usually have larger risk values? Well, I mean we're going to be pyramiding in on companies we know and use number one. And I'm not scared it's going to be going to zero. I'm looking to hold a little longer. Yep, that's exactly right. That's exactly right. And for me, I think also since this strategy can be implemented on any time frame, so you can do this on a 5 minute chart. If you Want to is because you have your prices spread out. That's the other thing, right? You, you have them spread out. So generally I don't get all of my pyramids filled. Because if you're doing your analysis relatively decently, right, Using the weekly, the monthly chart, the long term moving averages, piecing together, it usually will kind of go into the pyramid some and then, and then come out of it. So you. I very rarely get all four levels filled. I very, very often get the top two. So. Which means I'm going to miss a little bit on this one. So I just want to make sure I have some size into it. I break my pyramid into four sections, and this is just how I do it personally. If you want to do three, you can. If you want to do two, you also can, but I always break it into four. So let me show you the math behind it, since that's what Scott's question is. Here's the math behind the pyramid. So these are going to be the four entries essentially of your pyramid. So once you're looking at the chart, you're going to kind of. You don't necessarily have to draw this on your screen. You can, but this is where I get into it, right. I break it down. I have my four entries. You'll notice my fourth entry is just a little bit, a little bit above the bottom. It can be, it can be at the bottom, right. Engineers, there's no math formula here. This exactly. It's not like exactly 0.2573% of the pyramid will be right. So you don't have to make it that stressful. Look at your pyramid. Know that you're going to be buying more as it goes a little bit lower. So again, this is another method of dollar cost averaging. And your stop loss or your protective put will go again, a relatively cute amount below the open of the very, very bottom of your pyramid. That's your stop loss is going to go. Now, notice I said earlier, $20,000, right? We're breaking this up into four sections. So what you're going to do is you're going to have your $20,000 divided by four. Again, why four? Because that's the amount of sections that we're buying. 20,000 divided by four. Okay? That means each level that you choose is going to have a $5,000 risk unit associated with it. And you're going to do your risk calculation the exact same way you do a risk calculation now, which is your risk divided by the difference between your entry and your stop loss. And your calculation is going to look like this right here. And again, this is my personal numbers on Nike. If you want to follow them, you can will be other examples. But just letting you all know, this is my trade I'm doing on Nike that I have set up right now. So $5,000 risk divided by, you know, 9359 by 50 is my stop loss on Nike. I don't necessarily think it's going to go to 50, but it might. Anything's possible. 5,000 divided by the difference between 82, 52 and 50 and then 5,000 divided by 70 -50 and then 5,000 divided by 60 -50. Each one of these numbers on the entry column, this is where you're going to be getting in on your particular trade. So this number, this number, this number and this number, the 50. The reason it's remaining the same is this is your stop loss. So I'll pause there. Taru, any questions on that or any questions at all, gentlemen or ladies? No, I'm okay. Sweet. Quick question. If you, if you only fill the.
First two and it's starting to come up, would you re buy back in.
At the top because you didn't spend your full 20,000? Hey, great question. Great question. So yes, the, the question that Scott said is like, what if you just get filled on these top two and the stock starts to bounce? Like what, what can or could you or should you do at that point? And so very frequently what I do, Scott, if that begins to happen, is I'll take some of the money that is left from down here and I will start to throw some of that money in up here. Just recalculating everything, right? I'll recalculate my share size. I'll recalculate all of that. Because if I can sense or see or it starts to kind of bounce, what I'll do from that stage is that I'll take the stop loss also and start bringing that up as well. So instead of 50, it'll go to 55 or, or whatever the case is, and I'll start throwing some additional money at the position. That definitely happens. So for example, down here, I would have 250 shares available to buy Nike right at $70. So there's 17 grand of cash down there. Just, just chilling right on hold. I'll take that $17,000 and I'll start throwing it up around here. If Nike's in between here and I. And I feel like it's not going to reach these levels for whatever particular reason. Now with the pyramid again if you're looking at on a monthly chart, this can take a long time to fill. Right. It can take quite a while if you're looking at on a daily chart or a weekly chart. Right. The smaller the time frame, the less it's going to take to generally fill in the trade and all pyramids. For me, you're going to want to have an end date like when, when do I cancel this thing? When do I either get out of it, like I just cancel the whole order because it's not going to come down to that level. When do I exit the trade that I'm in my, you know, the actual position itself, all those things we're going to be talking about in class. But the reason I'm talking about this now and I did have to put in class concordantly is because I do feel like the market is going to have a little bit of a dip coming up and we do and likely will bounce higher. So I do not think this is the all time high of the market by any stretch. Think we're going to go higher. But this is a great little strategy especially for market, market drops, pullbacks into the market. Okay, so using all the numbers, this is an investment of $70,000. Call it 71 grand. So that's how much cash Jeff is going to be spending on buying shares of Nike. The entry orders, right, the four prices of getting in on the shares, those are all going to be GTC plus ext. That stands for good till canceled plus extended hours. And that is because you know you want to get filled. There's something moves overnight, there's some type of weird earnings gap. If there's something interesting or unique, you want to get your orders filled at those particular prices at GTC XD good till canceled extended hours. And obviously all of these prices are going to be limit orders. The good news is I probably won't be going through a bunch of order entries in this class because all of you do know how to do that. So that's the good news. Questions, thoughts? I have one, Jeremy. Yes, ma'. Am. The GTE with the extended hours, is that something that everybody can use or is that something we have to go to our broker to get permission to do extended hours? You know, that's a good question. Most brokers come with it and you shouldn't have to get permission. If you do not have it on your broker, definitely ask them why and there might be a random. I didn't know.
So.
Yeah, yeah, yeah, no, no, great question. Yeah, there's. There sometimes can Be reasons like if you have a super stingy broker like Vanguard or Fidelity, sometimes they'll be like, well, I don't know, we don't want you to. And yeah, so every now and then brokers can, but very, very rarely will they. I, I haven't heard of a recent example of that happening. Even in Robin Hood, they'll let you get filled, you know, whenever. So. Yeah. Great question. Thank you. Worse, I have a question. Hit me, Jeff.
Well, if you think the stock's going to go all the way down to 60, why wouldn't you do positions to short the stock instead of buying the stock?
Well, I mean, you can play in both ways, right? So if you have a day trading account, you could day trade on the way down and make money if it, if it's going to go down that level. But the reason that shorting for me again, this just personally, this is always how I've done it. Let me, let me do a, a whiteboard because it's a great question by my boy Jeff. So if the stock's going to go down and then do this, why not make money, you know, on the downside? And the answer is definitely make money on the downside. You certainly can. The only ways I do it is I usually buy puts or as he mentioned, short shares. But the thing is, if I want the stock to go up eventually, I definitely want to be in some type of bullish position because that's, that's how money is made. Longer term is usually by buying assets. So for me, when I'm shorting, this is just always how I've done it. The longest time frame of a short that I've done in my career was four months. Now again, I'm not saying that you, you like that's good or bad. I'm just giving you my perspective. I know that you know, the Michael Burry's out there. Robert Kiyosaki.
Right.
There's a lot of bears who always think the world's going to end. I call that fear porn. Or they're always trying to, they're trying to sell you something like the market's gonna go to zero and you need my thing. I, I usually just like to look at the world with rosy colored glasses. I don't personally think in our lifetime the US Dollar will become an irrelevant currency. I don't, we might not be number one in 70 years, but we're not going to be zero. Right. There's a lot of other countries that exist right now that have a pretty good currency that's not number one could just as you know, England as an example, or Japan. I mean, the Japanese currency works fine. So all of that being stated, I truly don't think that the whole market is going to crash and everyone's going to be bankrupt and everything's going to go zero. We're all going to turn into zombies. I have found that if I am shorting something, I'll make some money on a quicker, smaller time frame. So normally I'm day trading. The downside in a different account. In a different account, Tom. That's very, very often what I'm doing. And I'm making some money on the downside. If it is going lower, I think it's going to go lower, and then I'm still looking to purchase that particular asset. One last reason, Jeff. Stocks can only go to zero. So the downside is literally limited. The most amount of money you can make shorting stock is 100%. And then on the flip side of that, how high can something go? I mean, you know, mathematically can do whatever it wants.
And I have one more question to you. Pyramid. So instead of splitting it up 25% each column, if you really truly thought it was going to go below 93 and you were kind of skeptical, could you do like 15% entry on. On the top and then just do like 35 or 40% on the second tier? Because you really wanted to get to the 82 price, but you wanted to taste to the top.
Just want a little bit of a taste that pistachio ice cream. Just a little bit, Yeah. I don't see why not. I mean, the math would work out as long as you know what your 100% of risk is. If you want to split this up and you know that your total. It's all about total risk. You just need to know this number. If you know that number, however you break it down, as long as you're aware that it needs to eventually come out to this. And you divide by whatever number, however many columns you have, that's the biggest key. So, yeah, for example, if this right here is if you divide by four and you take 2500 bucks of that and throw it down into here. So this is 7500 and the top one's 2500. Sure. Yeah. I haven't done that way personally, but it's a really good idea. I like it. Cool concept. Nancy, when's the last trade you did with a pyramid? I'm trying to think. I know I've been pyramid into to Tesla because I had Some that I of course bought too high before I started with this company here, rlt and I was trying to dollar cost average my numbers back down so that I'll actually make some money on that. So I know I pyramid it in some on Tesla. Mm, Love it. Sweet. Cool, cool, cool. Okay, so again, this is just the chart in case you want a screenshot. This is what my Nike trade will look like. But again, going back to that GTC EXT order. And here's the one last cool little tip I think for me on this one, obviously the bigger the time frame that I'm doing my analysis on, the longer it's going to take on monthly and weekly charts. I do not actually place a stop order. Oh. Until my positions are filled. So I know that that was a big one that some of you had because I. We already know the math, right? I already know the math. I know that if something crazy happens on the stock and we open down here and like just take out everything. Well, I know, I already know my risk. So this one would get filled, this one would get filled, and this one would get filled overnight. I already know that I'm going to lose smaller and then if that happens, then once I'm filled on the position, I go place my stop orders. That's really it. That hasn't bit me yet. I won't say that it's impossible, but again, keep in mind that I'm doing these trades on daily and weekly charts. We, sorry, daily, weekly, monthly charts. I, I personally haven't pyramided into a day trade in a very long time. Not saying it can't be done, it's just why you can. I'm sure maybe I'll do that this year, start pyramiding some day trades and just have my risk. But I haven't done that in a long time for no particular reason other than it moves so quickly. You're gonna know if you're right or wrong within 40 minutes. And kind of my specialty is generally oftentimes at first two hours of market movement anyway. But you know what, I'm going to put that on my radar or something to do is a pyramid into a day trade this year just because I haven't done that in a very long time. All right, sweet. So now this is what we're going to get into next on Thursday is other ways to kind of dollar cost average into some of this stuff. This, the pyramid is also a dollar cost average way to do it obviously. But if I'm doing it, that is my pyramid's kind of My go to so here is the spy and let me give you my overall thoughts. The spy is just the S&P 500. We're gonna look at this and the Q's. We're gonna talk broader market stuff. We almost made our new all time high for the year on the spot. I said orange line. So we got very, very close. What I've done here is already done some of the work for you and this is something we're going to talk about in future classes, which is if you see something, if you're looking at a chart, ask a very good question. Has it done this before or when's the last time something like this occurred or is there anything like this in history that I can analyze and what did it do? Because history repeats itself more often than you would think. And so what I've done here is look at how quickly we've gone up and how many bull candles we've had in a row. So again, this is the weekly chart on the spy. We had 1, 2, 3, 4, 5, 6, 7, 8, 9 in a row, which is a lot literally going up almost faster than we went down here. So this green looking line is the exact size of this bear move. And what you'll notice is this is the really the last time we've got, we've moved this quickly was, was here just continuously, right? Bang, bang, bang, bang, bang, bang. This was the last one. So my thought process is whatever pullback we're going to get, it's going to be pretty gnarly. So if I zoom in, this pullback was one week, this retracement. We went from 381 to 416 in a week on the spot. That's a, let's call a 10% move in one week. So am I saying that we're going to have a 10% drop on the downside in a week on the broader markets? Probably, yeah, I am kind of saying that. So if you're looking at a broader market stock and you're looking to buy it right now, you're going to want to be looking at probably at 10% lower than where we currently are. Broader market stock being something that's in the S and P, something that's in the Q's, a bigger company, right? Something on the Dow Jones, we're likely going to get a little bit of a bigger of a pullback. Now here's the Q's, which is the NASDAQ etf and we did make a new all time high. So if you're like newsom there's no way someone bought right here. Well, they did. Someone bought right there at the highest price that this has ever been in human history. So for me I still am expecting a semblance of a pullback again, probably a 10% and I'm still going to look to buy. And on that pullback after 10%, I'll be getting in using the pyramid on a few different stocks and we're going to, we'll be searching through them together hopefully for the next two, three weeks, but we'll be getting in that pullback, Tom. And yeah, let it go, let it go higher. Now I know a lot of us here in this particular class have shares of Tesla. This is again all kind of my opinion, but what I'm gonna do is I'm gonna look at Tesla on the right hand side of the screen. I actually am slightly intrigued that the markets have made stronger all time highs and Tesla hasn't. So I'm gonna look at this on a weekly chart just kind of compared to the tech market because there's a, there's a few things to note here really just me kind of planning out my thoughts or my feelings or what I want to see on Tesla. But notice 2003. Here's the bottom, here's the bottom. Tesla's obviously up more than the broader markets because it's, you know, individual stock that usually is the case, it's up 56%. So we were up 56% last year, which is a lot. So I hope your, hope your money grew last year. And then on Tesla we're up 120ish percent, so pretty much double. But the weird part is, you know, we've, we've made new all time highs and not only have we made new all time highs, we've made new monthly highs on the broader markets. Well, we'll notice Tesla hasn't taken out of us high really since July or October. So from a chart perspective that means that we're either here. Or here. Right there. And my guesstimate is that when the market has a big pullback, Tesla needs to do one of two things. It's going to either pull back, which is fine, 20 to 30% because Tesla moves faster than the markets. So 20 to 30% of Tesla is 20%. We're going to get down to 197, that's a possibility or 30% is down here at 170. So if the broader markets pull back 10%, this is a likelihood that happens on Tesla. What I would prefer, obviously I'D prefer this. But what would make the most sense if Tesla's going to really do Anything great in 2024, is that if that pullback happens, we trade sideways and Tesla has relative strength. If Tesla has relative strength and the market doesn't drop. Sorry, apologize. The markets do drop and Tesla does not drop very strongly and Tesla kind of consolidates. My assumption is that we're creating this, this pattern here on Tesla and we just haven't broken out yet because really if you're counting the highs, we're, we're pretty close to that third high, right? We have, right? One big peak, two big peaks, and I think this is the third major peak right there. So 1, 2, and then 3. Last but not least, if we zoom out a little bit on Tesla, I will draw for you the, the trend line that this chart is kind of been battling with a little bit. And so there it is right there. So what I'm excited about is, and what I'm really, you know, cross my fingers for is that if Tesla holds strength, and this is the big part of the analysis, if Tesla holds strength when the market drops, because it's coming, it's not even, I'm just letting you all know it's going to come probably second week of January because we need one. I'm not, I'm not being a, a weirdo. I'm just saying that this is, this is a 1, 2, 3, 4, 5. We're gonna get into that stuff later. It's, it's happening. The pullback is among, is weeks away. If we get that Tesla holds and what doesn't drop a lot or really any, then I think Tesla could have a very, very strong year. And we're gonna see it up into the mid-3002. Very, very good chance that happens, which is gonna be a good money making opportunity for us, especially for those who currently have shares, you know, and all the good stuff. If Tesla does drop with the market, which is fine, you know, market drops, Tesla drops. I'm not saying that Tesla can't make money. It's just gonna take longer and it's gonna be a lot more choppy. So that if you buy some positions back down here and we trade back up to here, Tom, it's, it's going to be a little bit choppier than you're going to anticipate. So go ahead and kind of plan for that. That's my thoughts and my perspective and my take on Tesla, which I know is probably a lot of us here, like one of our bigger holdings Maybe. So that's, that's my question. Hit me, Eric. So we're probably, almost all of us probably have some Tesla, including me. Do you think it would be wise to sell before the pullback and then pyramid in? Should we sell what we currently have? Is that a strategy that you're employing? Yeah. I mean, buy low, sell high. The answer is yes. So either if I know you don't specialize in collars yet, and I'm going to get you there. For those of you who are very familiar with callers like selling calls, buying puts, I think this is the time to do it on Tesla personally for January or early February. If I go into the daily chart, earnings on this one are the 24th. So you have a full January of expiration and then you can get into another options trade. For, for those of us who have Tesla, this is the daily chart that we're looking at here. I'm very, very confident. And again, the markets are closed today. So don't, don't get stressed out at the, you know, 38 minutes. We have plenty of time. Markets are closed. I am quite confident we're going to come back to this little gap right there and fill that bad boy. And then it would be the trap of all traps. If we can pop back down to 200 or 220, which would be below this candle. And below this candle, right. We trade all the way down to here and then we bounce out of there, which is where, if you're not in Tesla, that's a great place to start a pyramid. Great place. And kind of like Jeff said earlier, if you want a pyramid up here and do something like this and just have your pyramid begin a little bit higher, you can. Or have smaller size. You certainly can. But this seems like a very great spot where everyone's having their stop losses placed. Right now. There is a place that people are placing their stop losses and right there. But yeah, Eric, if you're profitable and we know the market's going to pull back, you know, very soon, I mean, it just kind of has to. Nice little strong update on Tesla Exit some of your positions or all of your positions just depend, it can depend on a lot of things, right? Depends on your account. It can depend on, you know, taxes, it can depend on a bunch of different factors. But I never avoid a dream because of tax implications. So that's just, that's my thoughts. It's like there's, you know, there's ways around it, but you should be probably slightly profitable on Tesla depending on where you Bought it. And if you can get in and we can get out around 252, 253, 254, sell some of your positions, you know you're going to be buying, selling high. And then if we do get a breakout of this big, big trend that we're in, you can always just get back in at that stage. If the markets have a pullback and Tesla doesn't, which would be pretty rare. I think when the markets pull back, Tesla either trade salvage or they'll go down with it. I don't think that Tesla's just going to dance to its own drum, but if it does, we can always just get back in and we miss out on some of the alpha in the middle. But we always just hop back into the trade. Then we ride it up from 270 into 330, which is fine, right? Being cash and be nimble. Yeah, great question, man. Great. Would you also wait for a full day for. Oh, sorry, go ahead, Joe. Then we'll get to Jeff. Would you also wait for a bull day for getting into as well? Well, I wait for a bull day before I get in on Tesla or the caller. Oh, good. Gotcha. Gotcha. Well, you know, good question. Generally, yes. Generally, yes. I oftentimes, Joe, love to sell my options, calls or puts, whatever I'm selling at market open or at market close. Those are the two times where there's the most implied volatility. So I got into my call option caller at the Open here. So it wasn't an up day, but it was, you know, it was up at the, it was up at the open because that's a very strong bearish engulfing candle pattern. And I know a lot of you guys got that email about the candlestick ebook. This is a, this is a true story. So for some reason as we're going through the formatting, the bullish engulfing candle pattern got taken out of the ebook. I don't know how or why. So I went in and added another bullish engulfing candle. But right under bullish engulfing was bearish engulfing. And I looked at Tesla, I was like, wow, that looks a lot like the exact drawing that I have for a bearish engulfing nerds. This is stock nerds. This is what this was. And so I was like, wow, that is strong, man. Perfect bearish engulfing candle. So anyway, I got into my collar at the open on for the holidays. But normally, Joe, yes, at market open or on an update is the best time to Sell a collar, which is sell a call and buy a put. Yep. Jeff, what was your question, champ?
Seeing how you're predicting a kind of a pullback on, you know, the broader markets by Q. Q. Q. Voodoo or whatever, do you have any just straight puts on the market with like, you know, maybe limit, you know, get outs or anything like that or you do not do any puts on those, you actually still even have to go a little higher?
Yeah, good question, man. I, I don't, I don't have any straight puts just because, I mean market can, markets can stay irrational longer than you can stay solvent. That's one of the fun, fun words, fun answers. But here's what I will say regarding puts is I like this little lower shadow here that came in on Friday and I expect to have a small, maybe like an inside candle on Tuesday, which is tomorrow when market opens. But if we close below this lower shadow on the broader markets, right. We take it out. So we, we finally, we close below it. You know, one of those, I would get into some puts on a retest of that pattern. So I would buy two or three puts here and then when it retests, if it retests, buy two or three puts more and just have my stop at the all time high. Yeah, because you like this. I like this little lower shadow. But one thing I've learned, man, is again, tons of experience talking. I'm really, really bad at calling market tops like awful. Probably, probably one of the worst in the world. I'm pretty good though at trading this little portion right here. So for example, if we get this and then we get this and we get this and we get this and then we get that. That's usually when I make my money on a, on a bear move against a bull trend, that little drop. Because these, all these bull candles will get filled pretty closely. And honestly, this pink drawing is not awful. That, that's, I would give that a 30% chance anyway of happening. But that's normally when I make my money, Jeff, when it's just like, man, I, we gotta get into this. And by the way, Tom, week three, when we start talking about market tops and market bottoms, it's going to be so good, you guys are going to lose your minds. So just be strapped in for that. Yeah, we're going to talk market tops and mark bottoms a lot. Yep, great question, man. What else? We have team and then this. At this stage, I'd be happy to go through any of your positions, any of your stocks, anything that you want to look at. For your portfolio, just review, talk through my thoughts, anything like that. I got a quick question. Yes, sir.
Are you gonna. Well, depending on how many trades you do and everything like that is there when you set up your portfolio, do you allocate so much towards swing trading.
Towards day trading or.
Obviously having cash is limited on.
Well, some people, dude. Yeah, for sure, man. I, I have three. So I have long term, which is where I just buy. I don't ever do anything in that account. I will use options, I'll use collars, I'll do that. But I'm never shorting in there. I'm never predicting tops. I'm just buying long term assets to have them when, you know, I'm 97 years old or whatever. So that account for me actually is generally, I'm not stressed about it, I don't log in, I don't worry about it. I just hit the buy button. Then I have my swing trading account and then I have an entirely separate totally different day trading account. And this account, my long term account is in Interactive Brokers and my swing trading and day trading is with. Well now Charles Schwab. It was TD Ameritrade, right? Trading through thinkorswim. They got bought out by Charles Schwab. So now it's gonna be with Charles Schwab that all that got moved over. Yeah. And so there's, there's a reason I have three different ones. But the main reason is kind of like what Jeff asked earlier, Scott. So that I can do whatever I want. My day trading account, long, short day, whatever, no big deal. Because if you're long Tesla like I am in both these two accounts, I'm long Tesla. If Tesla drops and pulls back, I can make some money on it on the day trading account. And that way you don't have, you, you can have both, right? So you, but you can't have both in the same account. You can't have long shares and short shares simultaneously. You can have long shares and puts, but if you don't know what puts are, don't know how to trade puts or don't have put approval or, or whatever, then you can't do that. If you have again a bunch of shares of Tesla in an IRA or something, then you either have to be in puts. And if you can't do that because for whatever reason then you're really only option is to day trade it bearish. So that's kind of why I have it split up like that. And then I funnel any profits that I make from this account. Into this account and this account. And then usually, Scott, majority of the money goes into the swing trading account from the day trading account. I don't put a lot of my profits from the day trading into the long term because I make most of my income trading generally not last year, but oftentimes from swing trading. And that's what I'll put into there. So swing trading has your largest dollar amount? Yes, sir. Yep. Yeah. Because day trading, you don't, you don't need that much realistically. Right. Like, you have whatever. Let's just say you have $800,000 in a day trading account. It's like, that's, that's a lot, man. That's $3.2 million of day trading buying power. You're good. That's a decent little chunk. Plus, if and when you become really, really well versed, which I don't have this yet, I haven't done this yet, but I, I very well might consider it pretty soon. But once you have a decent track record, you can go get leveraged day trading funds very easily. Very easily. There's something called a proprietary trading, so you can go get 20x, 10x, 15x your money leverage. So if you have $800,000, you can take $800,000 and go get that 10x very simply at a prop firm. So now you have $8 million of buying power. Yeah. So the reason I haven't done that is because I just, I don't need to right now. It's not really. I don't need that much buying power. My current lifestyle, I'm good. If I make a million a year, life is, life is pretty okay. If I can make more than that, awesome. But a $8 million day trading accounts, like, that's, that's some serious, serious trading capital like that you have at your hands. It's going to be good for a lot of people, but it's just not. I don't need it right now. But anyway, saying all that to say, yeah, the day trading capital, you never need that much because you can always go get more. So that's why I tell people, like, money is the easiest part of the equation that you're trying to solve. I say that for a reason. Like if you're sitting down, like, I need more money in my life, it's like, no, you don't. Don't even worry about the money. You got to worry about some other part of the formula because the money is the easy part. You can go get more money. The money will happen, especially in the trading World, dude. It's crazy. Jason, any questions for you, my dude? What do you think, Jeremy? Anyone else? I'm excited. Me too. Yeah, me too man. Okay, let's go look at a few other stocks then and just kind of give you my thoughts on them. Here's Google and Google, fun fact. Let's go practice our, our analysis, log rhythm chart and then auto scale. So here's Google with a, with a log chart and auto scale. Me and Jeff had this conversation the other day. Jeff. And so just to show you for posterity purposes, Google is the only tech IPO that I've personally witnessed to not go below its IPO open. I haven't found any other ones. I'm not saying that doesn't exist, I just haven't seen it personally. So if anybody wants to do that like an actual company, not like something that got bought out and you know, whatever but, but there you go, Google, it's the only one. The reason I say that is because Jeff was asking me about SpaceX and just kind of get my opinion on it. So SpaceX is going to hit the markets probably in the next year and a half and they're doing a lot of pre orders essentially. And what a lot of companies will do, especially tech companies, is let's just go look at Meta. I mean I remember this vividly when this came out but you know, it took an absolute 60 nosedive in four months after hit the market. Everyone's saying it was overvalued and blah, blah, blah. And again all the customers that had lockups and they couldn't sell anything if they panicked and they panic soldiers at 20, you know, they, they might have taken a haircut. But it just, it depends, right? Depends on all kinds of factors like how, how early you got in when you actually bought it, all those things. So it can, it can depend on a decent amount of factors. But very, very often this is, this is what happens is it's going to end up going a little bit lower at some point. This is Meta now by the way, present day. And what I really like about this particular chart, a lot of things. But number one, I mean all time high is pennies away from here and that's going to happen in 2024. And you're above all moving averages on all time frames. This right here was a beautiful, beautiful earnings squeeze that we're going to learn about in a few weeks right there. Big ball, big earnings, big bear candle and just trapped it immediately. So anyone who shorted there just got absolutely train wrecked and I Again, I would not have shorted there personally because all trends were bullish on all time frames. Great spot for a pyramid. Great spot to get in. You know, adding some of your positions here. Really nice run up. Even if you just caught that, that's the only thing you caught on that move right here. If you did it with decent amount of size, that could have made your year. I mean, that's, you know, 35, $40 a share. It's really good. It's a nice little, nice little move. This is on Meta on the daily chart. This is an evening star reversal right here. It's a pretty nice one. Pretty nice little evening star reversal. Again, total trend is bullish for sure on Meta. So it's always a little scary for me to go bearish unless I'm day trading and we could day trade a bearish down into, you know, 335 and then I would expect it to go higher some stage. But what I would really, really like for us to do is if we get a pullback on Meta again, since we're gonna be together six months, we're gonna have tons of time. But if we can get it back at 300, it's gonna be a really, really nice spot to buy some Meta, especially if it hasn't made a new all time high yet. Coming into a very big one. That's extremely important to watch because there's tons of times to go until earnings is Nvidia. So Nvidia is a big one because what's happening with Nvidia right now, team, is we're getting really unique, bearish volume spikes towards this resistance. So you have this bear volume spike. You have this big bear volume spike here on this candle. You have this big bear volume spike also up there on that candle. And you keep getting bear volume spikes at that resistance. But simultaneously we are also getting higher lows for the most part. So this is creating one of my more favorite chart patterns, which is an ascending triangle. We're essentially getting higher lows and relative highs. Hold on. Yes, sir. With Nvidia, do you.
With the news coming out, like intel.
Announcing that they're going to have competition.
Against them now because they were kind.
Of like a standalone company for a while, now they're gonna have all this competition. You think it's gonna change how their.
Patterns look and everything or bit too strong?
Yep. Too strong. I don't think it's gonna matter. Not gonna matter. I mean, it's good. It's gonna be good for Intel. So we'll go look At Intel. We'll go look at intel next. Yeah, I ultimately don't think it's gonna matter personally. So I'll put this chart in WhatsApp. And the reason that I'm really, I really, really want us to focus on, on Nvidia a little bit team this year is because we haven't had a good close above 500 and there is consolidation here. Let's go into this weekly chart. Weekly chart. Right. We're getting consolidation. Upper shadow, upper shadow, upper shadow. Indecision inside candle decreasing volume. This is big John Alonzo. What is stopping Nvidia once it clears? 505. Absolutely nothing. Nothing up there. Nothing. Clear sky. Sure, totally. So obviously I know Nvidia is a little bit of a pricier stock. I get that. Right. So we don't all have money like Joe. So it's going to be hard to just, you know, buy as much as you can possibly want. But you could have 10 shares, you could have 20 shares, you could have one share. For those of you in a funded account, if you have hold over the weekend capacities, you could buy 20 shares and just leave it alone for a little bit. Because at some point if we, I think it's more if than when we kind of break out of that resistance up here. It's my inclination that we're going to go higher. Nice and higher. Most likely. Worst case scenario. Oh, wrong, wrong thing. Worst case scenario, we're going to go here to here, clone this. So that's going to take us to 600. So that's a decent amount of money to be made. And again, we don't have to be all up in all kinds of crazy shares. But the more research you do, kind of like Scott was talking about, like, hey, there's, there's competition now. It's like the More you study CEOs, marketing officers, technology officers, what are they trying to do, read their earnings. They murdered the last two earnings and went down, but they kept getting bought back up. So we have a ceiling, both of them with earnings when they absolutely slayed it, both of them and they went down 500. So a close above that. I think it's going to be a short squeeze. I think, I think 600 is going to happen in weeks. So we're, we're probably going to want to, to really, you know, square on that chart. That's one of the better breakout charts opportunities in my opinion of 2024 is Nvidia now Intel. I would love. So you're going to love this, Scott, again, just Good application of the stuff we talked about today. That's what I want to, that's what I want to talk about for a second. Here's the monthly chart and we're going to pull up the long terms and we're going to go into the log and just kind of zoom out here for a second. And what you'll notice is we had some really, really interesting, you know, price action movement around intel on this long term, you know, it's long term moving averages. One thing I did mention in that, in that charting screenshot stuff is if you know the company pays dividends or you don't know if the company pays dividends, you want to find out. This little ADJ down there stands for the adjusted for dividends chart. I like clicking that because it's free. If it cost me $20 every time I clicked it, I probably wouldn't click it. But since it doesn't cost anything, I like to click it. And sometimes if the stock does pay dividends, it'll give me a different picture. And my girl Nancy was asking me about this a couple days ago. But check out now how differently intel interacts with its 200 moving average. And look at this scrumdillium pattern down in 2011-2013. It's like if you were buying intel, what an amazing brick wall that would have been. So Intel. I mean as far as I can see they're also just any pullback will be eventually get bought up. They they had its big pullback. We've had a great move up. We can pull back into 41, 39. Anything in that general area but them competing with Nvidia. Great competition is good for everyone. But I do think they're going to get bought if you adjust the chart for dividends. Here's the previous all time high in 2000. Right. That's the tech bubble. And don't you worry we're going to be studying intel when we're talking about market tops, market bottoms. But this is the zone of buying that I would probably have on intel. Call it 41. If I zoom into a weekly chart and this is why just I just love multiple time frame analysis is my jam. Looking at the weekly the two moving averages that I just drew. Look at that bang right there right at that very first level. And then so here's another one. So if I was going to do a pyramid on intel, which I'm not personally just because I can't be in everything, I'd probably start it at 42. I would take it down to 32. And that's what my pyramid would look like right there. 42 and a 32. Knowing that I'm probably going to get two, maybe three of those. I doubt that I would get four then. Yeah. So that's intel. We went over to Google and then I saw the squirrel. So Google does not pay dividends. So you can adjust the chart as much as you want. Doesn't do anything. Google is right here pretty much at these all time highs. It's definitely going to make a new all time high this year without question. Just letting you all know that now. And this is the resistance that it's facing presently. So if I zoom out from a monthly chart to this monthly, we haven't even hit these moving averages on Google. Incredible. Never even come down there. So that is just mythical, which just tells me how strong that is. Now I know that this is all in the past, but look at what a great buying opportunity Google was in 2022 towards the end of the year. So I know we're studying this now, but hey, if it works now, will it work in the future? Yeah. That's why I want you to be able to kind of understand if you see something and you learn something, you're able to know the repetition and the direction and the, and the way to approach all of this. You're going to be able to, to do all this analysis again whenever you want. So then zooming into the daily chart. So the daily chart, my big buy purchase would be 125 on Google. I don't necessarily know if we're going to get there or not, but that's where that'd be a great spot to buy some. And otherwise this little area right here is just again, it's just a matter of time before we get back up and get to that previous all time high of that 150 price point on Google. Our girl Joe, just slaying Google with her option selling. Good job, Joe. It's a fun one to sell options on, right? It is, yep. Super cool. Super cool. Okay, so now let's go look at some stocks that are down for a second. Looking at the exact same process that we've kind of analyzed so far. I'm not going to do anything new or unique, but Carvana I think needs to be one that we watch pretty closely, maybe for the first part of the year. And here's why. So I'm gonna zoom out to a monthly chart. This one doesn't have monthly moving averages, but if we're asking the questions lower, is it high. What would you all say? Look. Yeah, looks a little on the low side. Agreed. I mean, we've been down here before. We were up at 350 somehow. I'm definitely not saying we're going to get up there again, but I am saying that anything is possible. Another thing that I'm noticing on Carvana is that this is the biggest buying volume in human history. And that occurred not that many months ago. You know, I mean, was that. That is June. So June and then you had July. And then we've really kind of consolidated and we're back at July's high. And volume again did increase last month relatively. So. That's interesting. Just some. Some of my takes, but then if I pop into a weekly chart. Eric, check this out. The weekly chart. One of the few stocks that I found that the volume increased the whole month of December. So bang, bang, bang, bang, bang. And I think this is the only week that didn't increase was Christmas week. But what you got on Christmas week is you got an inside candle on the weekly chart. Lot of pressure building there for those of you. And we're going to talk about again, market bottoms. The stock is going to be in our market bottom list for sure. But that is a inverted head and shoulders pattern. And it's a perfect one, too, in this textbook. So we have that, and you're above the 100 on the weekly. So we have cleared that resistance. That was that trade that some of us took together two, three weeks ago. A little 50% pump right there was when it broke above the 100 on the weekly. Remember that, Eric? The little. A little squeeze right off that 100. So now we're back at that resistance. So then if I pop into the daily chart, this is where we're at. And this is. This is what I'm watching for. Carvana is a volatile little cookie monster. Meaning, like, this thing moves a lot, which is, you know, always fun. So for me, I will plan on pyramiding into this 48, down to 30. And if that doesn't happen on Carvana and we just kind of trade sideways for a few weeks and then we start to that. That consolidation that we talked about. We can. The longer we consolidate this resistance, if we start getting any actual good clearing candles, good closing candles, good candles that close above previous resistances, that type of thing, then I'll buy some. So I'm keeping Carvon on our list. I'm going to build a watch list that I'm going to keep adding to. And I want anyone who wants to Remind me. Hey, Newsom, like, let's pull up our ultra wealth watch list. I'm going to do my best to keep a nice little watch list of stocks that I think we should all be watching very closely. And I'll share those with you guys as often as possible. So I got a few other stocks I want to look at. Jeff, with your hand up. What you got for my dog? Do you ever.
Do you ever do any stop limits as it's going up? So if you say, like, if this breaks above the low, I want to get in and as. Because I know it's going to keep going up from there. Or do you only buy pyramids going down and retesting?
Oh, dude, I do stop limits. Those are those. I almost got, like a stop limit tattoo the other day, but John Alonzo talked me out of it. Yeah, dude, for sure. So the stop limit right now on Carvana is going to be above this little resistance area right here. So call it 57. Yeah, stop limits is how I play 10 MA strategies, in fact, on swing, trade, stop limit, stop stop buys those, you know, stop, buy or stop limit. So right here, when we could. When you took the little breakout, you might remember that's exactly the order that we used on Carvana last time. So, yeah, the longer this builds pressure, we always want to buy low as possible. But again, maybe it doesn't pull back that far. Maybe it doesn't pull back all the way to 50 where we can start getting filled on our pyramid 48.50. This. This little area. All right, so we talked to Tesla, talked Wal.
One more question. Do brokers allow you to do stop limits and like, all different orders on one screen so it will hit as it's going or lower all that stuff. Like, can you put multiple. Can you do it pyramid, then do stop limits and have like 50 different scenarios on Carvarna?
Yes, sir.
I've never done it, so I don't know.
Oh, yeah. Oh, yeah, you can have it. You can have it. All right. Yep, you can have it all Chewy. This is one doesn't require a whole lot of talking about yet. We haven't discussed marketing bottoms yet in depth, but we will. So just throwing it out there, that's a perfect double bottom with increasing volume. So if Chewy makes it back to 2157, I'm gonna buy at least a thousand shares, but I'm probably gonna add a zero to that pretty soon. The reason I'm buying at least a thousand shares is because it moves pretty quickly. I mean, this stock moves a dollar or two pretty, pretty often and you know, thousand shares moves two bucks is two grand. Sell it. Cool. So watch that one closely. I mean that is a perfect double bottom. That one's really, really on our list. Rivian. We're not doing anything with it yet together as a team. But note that I am watching this stock very, very closely. You guys remember that little channel looking thing that Tesla hasn't broken out of? It looks like Rivian has to me now the only thing in its way. Eric, what's the number one thing in Rivian's way right now? I have no idea. This little blue line. Yeah, that's the 100 on the weekly. Yep, that's and that's a big one. So Rivian, not a very expensive stock. But here's the thing guys, they are coming out with, with trucks, people are buying them and this thing has a long way to go if it starts to really, really break out. So I know my girl sue has a couple hundred shares of this one. I, I don't have any yet, but my current plan is to continue a little bit more research on Rivian. I want to, I want to learn a little bit more from them. I think if the market pulls back, this one will pull back pretty nicely down into 20, 20, 17, 18, something like that. And I'm look to pick up probably just a couple hundred shares and then see how it does and then maybe add to it later. This is one of those where we're going to talk about tomorrow, which is I'm going to do an absolute zero. So we'll talk about more about what that means tomorrow. But absolute zero on my stop loss is gonna be kind of how I'm gonna play Rivian for a bit and then we're gonna see how we interact above the 100. Walmart, very, very boring. And this is the last one on the list. But I want to show you this. This was a recent pyramid that I did on Walmart. Just using the analysis. I more or less wanted to show you this one. Same thing that we kind of went through and talked about previously, right. Overall, strong trend. I didn't want a ton of Walmart but I got two pyramids filled. And if Walmart hits 160 this is where I will get into an options collar, right? Selling calls, buying puts and then create an unlosable trade on Walmart. And I'll just kind of wait around, just see what Walmart does. But it's, you know, Walmart. We all, we all know Walmart does, but that's it. Like, I'm. We're not going to have tons and tons and tons of stocks on our watch list. I will review if anything looks amazing myself or John Alonzo will post a trade in. In Slack or, sorry, in our WhatsApp group. And if anyone has any questions about any particular trade ever, please let me know. That's what we're here for. I want to learn together, and I want to earn together and just study, you know, meet great people, do great things, connect with awesome individuals, get great ideas, do a little bit of work, a little bit of research, set some trades up, make some money, be awesome. It's a good life. Eric, last question. Did you actually take down that deer behind you? I did. Well done, man. With a. With a hatchet, right? No, that one. I used a gun, but I switched to bow hunting. And the beauty is I bow hunt right in my backyard. It's so fun. Very cool. Very, very cool. Well, team, I will be posting some voice memos and some stuff tomorrow. You know, when the market's open on Tuesday. Your easy, easy homework for today. Any chart that you want, any chart I want you to post into our WhatsApp group. Where would have been an amazing time to buy based on the monthly or weekly chart, using the 100, 200 moving average should be super, super easy homework. But where would you have loved to have bought that stock? And now while you're posting the chart, the only thing you need to do is just ask yourself, why. Why didn't you. There's tons of valid answers that know anything. Wasn't around, wasn't trading. But then take that information, take that stock, take that awareness that you had, and apply it to future stocks. There's gonna be more companies out there than we can ever handle. There's gonna be more trading opportunities than we can ever handle. But the ultra wealthy, which I'll be sharing some more information on that soon, you guys are really like that. The ultra wealthy, they do have beautiful stock positions. They have beautiful real estate positions, and they have beautiful business positions. So they always have both. And, well, they. They have all three. And so those are all three things we're going to be covering in class for the next six months. Thank you for being here for Class 1. And I will see you all on Thursday, midday. Three to four Eastern markets are open. Let's go have a blast. See you, family. You rock. Thank you. Thanks, everybody.