Ultra Wealth February 12th, 2024
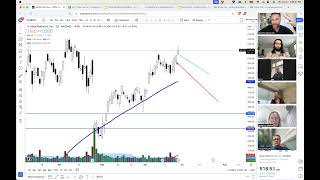
Recorded coaching session (YouTube) led by Jerremy Newsome with participants Eric, Scott, Sue focused on identifying and trading "fades"—especially bull fades after gap downs. The session defines bull fades, lists practical evidence that increases fade probability (e.g., blue-chip gap down into moving averages, gap >=10%, shaved-bottom bear candles), walks through multiple live-chart examples (Google, Amazon, Intel, Snapchat, others), discusses option/collar strategies and risk management, and assigns homework to find current bull fades.
Chapters
And beautiful. We got more gaps. All February, we're talking gaps just to learn them, study them, practice them, learn about them, analyze them, and make some money from Eric. Make some gains, baby. Well, we are going to be working on predicting and working on fades. Session one, predicting bull and bear fades. Techniques for thinking through and anticipating and maybe even trading the fade. First and foremost, what is a fade? Well, let's talk about bull fades for a second. Bull fades mean that you are bullish while the trade. Bullish. The candle's bullish. The price action is bullish. And you're expecting bulls to fade the gap to fill the gap, to trade up after an initial move down. So specifically, when a stock is gapping or has gapped down and based on evidence or trend or candlesticks or something of some nature, you feel it will trade higher, it will trade up from open. And as I mentioned, the third bullet point, this could be considered the retest point portion of the retest gap. So I say the retest gap.
Right.
The retest gap is bare candle. So let's talk about this one over here.
Right.
Bear candle gapping down. And I mean, just what a great fade this one was. So you had up here we have a double top. Bear candle, bear candle, bear candle. And we gapped down Tom in the morning. And are you able to notice that, Ms. Nancy, how we fade higher? Right, so we have bear, bear, bear, Boom. We gapped down at open, pretending that none of these candles are here. Right at open. We have made a new low. The position, the trend, everything is. Is looking. And it has. It has made a new low. And on that particular day, what's amazing about that particular trade is it really is just that day. It's just this. This is the. That was it that day faded and then, boom, we went lower. Two days after that, then we went up again, and then we went lower. We made a new low. And then we had a. Then we had a really big retest. And what did that retest do? Well, if you notice right here, it came in to fill that gap. And once that gap filled, Jeremy, we went back down. So that's what the bull fade is. The bull fade is those price movements where you're expecting the gap, as we talked about yesterday, to probably fill some or a portion of it to get filled. And the bulls are buying. A lot of times a fade can be a good blend. And Eric, I know you asked a fantastic question over the weekend. How do you really know who is who? Like, is it bulls buying to cover or is it new bulls getting into a position sometimes it can, it's usually both normally, but you never can tell for 100% certainty. And really what you're doing is you're essentially just making your best estimation based on a few different factors, you know, moving averages, trends, things that did in the past, so and so forth. And we're gonna, you know, we'll look at Google and kind of come up with some of those examples. But that's, that's a great example. So just some more pictures of bull fades now. To reiterate, you can look to definitely take these as day trades. Now I know that we're not specifically designed and focusing on spending a bunch of time on, on day trading in this class, although we can day trade, obviously. I'm just saying that that's not going to be our primary goal. But you can definitely look to play a good bull fade as a day trade. You could do it as a, as a quick bullish swing trade. Another really cool one is if the overall trend is bearish and you get these retests, these bull fades, you can use the bull nature of that candle to sell high, right, so that you can end up shorting. So it helps you get in at a better price. So let's just talk about, you know, this, this bull fade right here when it gapped down. Notice how we opened lower than just essentially this, this little move there. We did end up filling the gap, but how much more profitable could you have been if you shorted up here versus shorting lower right down here? It just helps you with the timing. If you're looking at a chart, you're like, oh, I think this is going to retest. I think that I have reasons and rationales to consider that this is probably going to pull back into this level and then start to roll down some more. Just gives you the ability to set up different type of orders, different types of trades. It can help you really well with your options. You know, as we get into those, this is going to be a, a good summation of how you can start practicing some of your timing for getting into new option orders and things of that nature. When what we'll also notice is this big, big, big, big candle there. You had 1, 2, 3, 4, 5 be candles in a row. And we had a big gap down overnight. The bear candle gapped down and we opened lower. And on that day, after the day finished, we have a huge, huge, huge bull fade. Massive bull fade with really big volume. So, Eric, does it look like that candle and that location Marked the bottom of the bear trend.
Does.
Yeah, think so. And so on that day, you could have simply said to yourself, I guess, like, all right, hey, this is a really, really strong support. I don't think that this ever breaks. Maybe it does. If it breaks, we're going to go lower. But if this level holds, this very well could be the low of this trend for a while, if not forever. Could you have said that at that point in time?
Yeah.
Yep. And again, that, that's just one of those things that will help you and your trading if you go, all right, here's my line in the sand. Maybe it works, maybe it doesn't. But based on this, this piece of information, this piece of evidence, this is what I can, what I can tell. And then it helps you come up with some plans for yourself. Scott, what's the difference in your opinion between this bull volume down here and this bull volume up here?
One would be price action. If they're a bunch of bulls that coming in at a low price, chances are the trend is going to go more bullish. If a lot of bulls are at a higher price, most likely it's. They're fighting to keep that position.
Yeah, fighting to keep that position. The higher the, the higher the price action, the more the bull volume. Is that a good sign or not a good sign?
I read it as both sometimes. So it, sometimes I think of it as it, it's not going to drop because they have such good volume in it that it. They're able to maintain their, their ground and the bears are losing. But then also I think at such a big run up, even with all that volume, people are going to start to short it. Yeah, they're going to start losing traction.
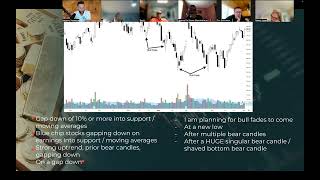
Yeah, I like that. I like that. It's a really good perspective. U. I like the how like, hey, this is a really good battleground. And so, you know, a few candles later, we can see how we pretty much take out that volume. We close, blow that candle pretty quickly. So that battle didn't last very long. Right. Nancy, you had, you had a good battleground, you had a good volume, you had it, it was all there. And then just three or four days later, poof, that volume gets taken out by the bears. So that's again a good warning sign when we're just looking at pure volume. But I really do like fades a lot. It's a interesting, very, very interesting price action for me that I look for. And here's some more pieces of evidence that you can start building for your. Is this thing Going to do a gap down fade. So number one, gap down of 10% or more into support and into some moving averages. That's probably going to be a gap down fade. You're going to love this one, fam. Blue chip stocks gapping down on earnings into a support or into moving averages. You, you, you generally don't want to short a blue chip gapping down into a bunch of moving averages. We're going to practice this in just a second. Don't you worry. Strong uptrend prior bear candles gapping down.
Right.
Because those bears are probably going to buy to cover when they're profitable. So we're going to look through some of those obviously just on a gap down in general.
Right.
I mean that's, that's is going to increase the likelihood of a fade. But these are going from stronger stronger to less stronger. So when the stock is gapping down 10%.
This.
It's probably going to fade again. Doesn't have to. But you're like, no. And then if you have a blue chip gapping down 10% or more, that's when you're like, okay, okay, there's a good chance this is going to start bouncing. I personally begin to plan for bull fades to come in at a new low. So a new low, especially if you start adding these together. New low. And after multiple bear candles. And then after a huge bear candle or a shaved bottom bear candle. Oh, those are really, really good items to look for if you are planning for a bull fade. Let's look at this one on the chart here to the. There's two or three here. Let me get my arrows out. I know you can see them on the screen, but right here, would you agree that that is a huge singular bear candle that almost, it almost has a perfect shaped bottom. And then over here you. Do you have a pretty big bear candle? That's a shaved bottom. Here's a pretty big candle. That's a shaved bottom. And so that just simply means that after those candles come in and you start to see these gap downs, you can start planning for a bull fade. Scott.
So with that being said, when would you get in on that if you're going to go do a swing trade on that or would that just be a day trade type situation or would you wait?
Yeah, no, good question. I mean, so it's gonna, it's gonna depend a little bit. It's gonna depend on. Yeah. Your time frame if you are day trading. Man, I love, I get into fades early, dude. First 10, 15 minutes of market open.
We'Ll talk at that point in time.
Well, you should know. That's what I'm saying. You should gap down, correct? Yeah. You should know before the market even opens that you're looking and you're expecting a fade. Exactly. And you are going to be doing that using really, essentially everything that we're going to be going through today and this week as we practice our fades. And I'll start giving you some more details and some data on day trades for these things. But you should already know before the market even opens. 30 minutes, an hour before a market open. As you're doing any pre market research, this is. There's a likelihood that this is going to fade. And if that's the case, you're going to be getting in early first 15 minutes. Because these things move, dude. Like, because you. It's like a. It's like a cannon goes off, market opens and poof, everyone starts buying. Shorts are buying to cover dip, buyers are buying, all people are buying, all kinds of buying. So it's really, really good to recognize this price action as early as possible in the morning because it allows you for, you know, for really good option sales. Right. Put sales if you're bullish, call sales if you're bearish. You know, all kinds of different approaches here. But then, of course, also it allows you to set up, like you said earlier, your swing trades. If. Let's use. Let's use this chart over here as an example. Big bear candle. And let's say on that day, on the pink arrow day, you at that stage are planning to do a bear swing. So your trend is bearish. You're anticipating some bearishness. The main anticipation of bearishness is coming in because we closed below that volume. Here's your strong bull candle. And when the bull fade came in. So let's point to this guy. So when this candle starts coming in, you go, all right, it looks to me like we're about to retest this old support as what new resistance. And you're expecting that to essentially fade back higher. So instead of you shorting again, this is the difference between you getting embarrass here, Scott, or you getting embarrass up here. And that's a world of difference, man. That's five, six, seven dollars a difference. And then you don't have to wait as long to be profitable either. So to kind of redraw this line, I'm drawing this line based on this volume. Everyone able to see that. And this candle here, once you have that support line drawn on that chart. And right here, when this candle starts coming in and you're expecting. And you're. You're able to see after the fact markets closed, you're able to see that giant candle like, man, this is about to fade. This is about to fill the gap. You could then if. If your analysis was, hey, I'm looking to go. Looking to go short. You're shorting on a retest of that green line. And so you're getting in bearish somewhere up here versus. Versus waiting to get embarrassed down here. Because what happens and what I notice a lot of times in traders is they're just waiting too long to get in. They're not shorting up here, they're shorting there. Right? They're shorting after it makes the new low. And it's usually too late because overnight you're going to get a gap down fade, and they're not going to. They're not going to know that it fades and they're going to exit somewhere on this candle and they're not going to make as much money as they could have when they could have just exited at open, capturing their profits because they knew it was going to fade. Because they. They say to themselves, okay, well, we got multiple bear candles. One, two, three, four bear candles. We're having a strong gap down, and we're at a new low. New low relative to here and to here. Four bear candles, strong gap down overnight, we're opening at a new low. This is going to fade. And then, Jeremy, are we able to notice how the price that we faded out here was the exact same price we fade out again? Crazy, crazy, crazy town, dude. Strong bear movement. Were there a bunch of bears profitable at that point? Definitely, yeah. And then we gapped down the same price. We gapped down, we opened there again and got even more buyers off of that price. Isn't that cool? And what makes that fade so likely is again, the fact that you have a good profitable amount of bears here, the fact that you were gapping down overnight, opening out of support, and then the fact that you had a singular shaved bottom bear candle before the gap, that shaved bottom that just. I mean, that is a prolific shorting candle that just says everyone that day is short, short, shorty McShorter to no one's riding the roller coaster. They're too short to ride it. Everyone in that candle is bears. And so when the next candle opens at a new low, are the bears profitable? And there's a bunch of bears that are profitable because it's a shaved bottom Candle. No buyers to be found anywhere. Any questions about this so far?
Yeah, Jeremy, you said that should be a single, single shave bottom. Bear candle. What if there's more bear candles before that? And it's a shave bottom?
Even better.
Okay.
Yeah, even better. So really, it's just like this is before, before the gap down, if you're able to see. I mean, here's a great example of that. Misu right there is you have two bear candles before it, right? So you got this one and this one. I guess you could make the argument that you got these two maybe.
Yeah.
But then the next one. So I'll point to with a red. So this guy. That's a big bear candle, right? Big singular bear candle. And it's a shaved bottom essentially. So that when that open occurs, you're not really expecting a short to continue. You're probably expecting some type of retest, some type of gap down bull fade. Yes, yes, yes, yes. Beautiful. All right, time to review. Let's go look at a bunch of these puppies. Give me three seconds. Where is my.
There it is.
Beautiful. Okay, so we're just looking at this on the daily chart and obviously we're going to go to the one that a few of you are already in Google. And let's just, let's just walk through some of the, some of the slides that we talked about for these gap downs. Okay, here we go. So pull that up. All right, so now did we have a fade that that day? No. Right. Not that day, but check it out. So we zoom in here. On this day you have a bear candle followed by a bear candle followed by a bear candle. So you have multiple bear candles in a row. And we gapped down that morning. Okay, so that's a, that's a maybe of a fade. Right? Get multiple bear candles in a row. Coming back over here. Is the stock in a strong uptrend? Yes or yes, It's Google, right. I mean it was just an all time high before earnings. Would you consider Google to be a blue chip stock? Probably. It doesn't pay a dividend. But you, I mean, it's, it's Google. We don't have to overthink it too much. Okay, so big company gapping down on earnings into moving averages. Did that happen? Yes or yes? Well, if we come over here to the daily chart, let's just turn some moving averages on. Jeremy, what do you think? Do we gap down into some moving averages?
Yes.
Mm. Yes, we did. Gapped down into some moving averages. So you have stock in a Strong uptrend gap down on earnings. Multiple bear candles into moving averages. Is this a bull fade candidate? Yep. And so that's pretty much on this day here. You can begin planning the fade. You can begin. All right. What does that look like? How long is it going to take? Did it happen before looking back in history, kind of analyzing previous movements? Right. Just really interpreting previous movements. But anywhere in this general vicinity, you probably could have started looking at or building into a position of some type of bull fade opportunity.
Okay.
Now let's go look at the last earnings on Google just for a moment. So last earnings, it was a little bit different because you had some bull candles that came in before the gap down. Miss, let's go with. Oh, hard to pick from just greatness. All I see is greatness. All right, let's go. Ms. Joe, if your Internet's good, if it's not, it's okay. It's half and a half. All right, we got half an hour. So why. Why was that gap down, in your opinion? Probably not a super strong candidate for a fade. Oh, you're muted. Let me unmute you.
Oh, there we go.
Yep.
It wasn't in his resistance or anything.
Yeah, it was. Yeah.
This one at the wrong spot. Oh, that one. Sorry.
You're good.
You're good.
So that was the gap down. Yeah, because it wasn't. It kind of. It gapped below the resistance.
Yeah.
Or the support, but not into any other resistance. So it could have kept going.
Yep. That was definitely one. Absolutely. You nailed it. What else, Jeremy, that you see on this one?
Bullet free test gap into a bearish gap and go.
Yeah, I mean, well, that's a big one, though. That's a bear. It's a gap and go. So you have a bunch. You have some bulls that are trapped. So those bulls are going to be a little more like. Right. You got more people selling, Tom, versus a lot of profit taking. You able to see that, Eric? So on this one, like, you know, there's going to be people who are going to be selling because they're scared because you got some strong bull candles before the gap down. Now, the big question on this one that I would like. Let's. Let's have Ms. Sue answer for me. Even though I can look at this chart in hindsight and go, well, I wouldn't been a huge fan of a fade. Wouldn't have been like, oh, this is going to fade higher. Just buy it, buy it, buy it. When would I or you or whoever begin to start taking that stance at what point. Would it make sense to consider that this is going to continue to be a bull fade?
You mean on this day that you're pointing at the.
Yeah, yeah.
Bear candle or on.
Yeah, exactly. From going forward from that candle, the gap down. At what point would a bull fade have begun to become more likely? And why?
Well, I think, you know, the further price action goes down. If I'm looking to the left, we filled that gap there. Got a. Got a lot of. Lot of bare volume right there in that one. That goes up into the 200.
Yep.
Trying to think why would I think it's going to go up? Mostly because it's Google. It's not going to keep going down.
That's a good answer. I'll take that. I really. I really like that you found this one. I like that. So. So, sue, notice to the left, it's a. It's filling a gap. So is that a good thing or a good thing? Like. Yeah, it's a good thing. So that.
That.
That's a check off the list. Like, oh, cool. It filled a gap, so that gap needed to fill. So therefore we filled the gap. For me on this one, what I'm. What I'm looking for really, is when this. When we close above that volume, let's say on one of these further. Exactly. When we get above there and we closed above not only the volume, but also the 100, that's when you can go, I'm pretty sure this is going to start fading. Yeah. Because it closed above all of the bare volume. And like you said, and you had the gap fill over here, you did have a pretty cute little hammer.
Yeah, it's not a hammer, but it wasn't on a resist or, you know, it wasn't on support, so.
Yep. So cute little hammer. Nothing too insane. This candle right here is a pretty nice gap. Right. Are you guys able to see how we open above the high of that previous bear hammer? So that's really nice. There's some people that are trapped on that. But going back into hindsight, not. Not only hindsight, but at the time, I simply waited. And once this candle came in on Google, I was like, all right, guys, this is going to fade. It's going to fill a gap. Play it bullish. So you have that day or you have this day as the retest of the 100. Right family. Four bull candles in a row. Boom, boom, boom, boom, boom. You get the selling event down back into the hundred old resistance becoming what? New support. And that's. You're buying here. And what's really fun with this, with today's discussion. True or false, Scott? That candle is a bull fade.
True, true.
Yep. You nailed it, my dude.
Also, it's also an engulfing bowl, right?
Yeah. Yep, you're exactly right. So it's a bullish engulfing candle. It's a bull fade. It's off the hundred. It's off a previous resistance, which is the volume level there. And so that sentiment is more bullish than bearish. And what happens? Well, Google continues higher. Some good profits to be made right there on that little run up. Any questions on that, Rockstars?
Okay, what does an engulfing candle generally mean or signal?
I feel like, for me, it just. It signals the fact that all of the bears are losing. Yeah, the full candle got taken out. Like, all of it got engulfed. I'm trying to think of, like, an example, though. It's. It's really just like, since the super bowl is yesterday, to talk super bowl terms, it's really as if the other team was doing okay and they made it to the end zone, red zone, and then they threw a pick six and they just. They ran it all. And then after that next play, they get a safety. You know, it's like, wow, dude. Like, is the team even showing up? It's just a continuous punishment.
Is it the body that has to engulf completely or does that just make it stronger?
Correct. Yeah, it has to be the body. The body has to engulf the body.
Oh, so not necessarily the wicks of the previous one, but the body engulfing the body.
Body engulfing body. That makes it even stronger. Yeah, the wicks. I don't even count wicks as engulfing. It just needs to be body on body.
Okay.
Yeah. It makes it even stronger. And that's. That's an example of that right there. Yeah, good call. Good call.
Sweet.
I love it. All right, well, let's go look for some more examples. I'm going to do a quick favor, Eric. I wanted to have you. Can you share your screen, Eric, and go find us some examples of some bull fades. Any asset class that you want.
All right. Is my screen sharing?
There you go.
See it?
Rivian.
Yep.
Yep.
All right, let's look for some bull fades. Let's look for some blue chip stuff here. Something that looks like it. This one's close, isn't it? There's the shaved bottom candle. Here we go. Right here. Can you guys hear me?
Yep.
There you go. Yep. You got one there. That's nice. It's A pretty one.
What would you say about this one? We got a shape bottom candle. It looks like it opened maybe a couple bucks or a couple cents. That one looks like a good fade. It is not at a new recent low though. But it's. There's not a ton of volume. We got one good volume right here. That would get taken out.
Yeah. Okay, so when did that candle get taken out? Exactly Right there. Boom. So on this candle, right? That's your ex. That's your go, go bullish candle.
Yeah.
This one. This one would probably have been like, hey, we might. We might bounce here. We have a shade. We have a shave bottom gap down into a bull engulfing fade.
Yeah.
Right. The body of that candle fully engulfs the pot, the prior bodies, and we're talking about engulfing candles. And then you have all that bare volume. And that bare volume got taken out. Got a close above by the candle with the red arrow.
Yeah.
So the candle in the red arrow, that's when you got to be looking to take that trade. Bullish. Right at essentially at close on that day. You need to have already been planning on buying Amazon.
Just like the last 15 minutes. When you see that it is absolutely higher.
Okay.
Yep. Nice.
For sure. Do you also see a chart pattern there at all?
This could be a double bottom, maybe. Tick, tick, tick, tick.
There you go. That's what I see at least. Yep. Nice little double bottom.
This. This is telling right here. All this volume.
Agreed.
Look at how much more it is than anything that happened after it.
Agreed. Totally, totally agree. What about this bull fade? What's your thoughts on.
Look at how it comes across right through this gap here.
Yeah. Fills the gap, right?
Yeah, yeah. It could have been a day trade thing, but it didn't close above. I gotta X out of one of these other tabs because I actually have more than one screen up. So that's why that happens.
Oh, you're good.
Okay.
All right.
So at what point would you have said yourself, all right, I need to be looking for bull trades.
On this candle right here?
Or. Or either that or either after the candle. Either one.
Well, got. Here's this big one here. So anything after that, this is like way later, right? This candle here. Yeah, that across over here. So this isn't a bad one either because. Well, once you take out the close above, this right here is a good spot to get in.
Totally.
But down here. Well, once it closes above this guy, you still don't know if you're in chop zone down here, do you? How do you eliminate knowing that. That this is just going to keep going like this?
Yeah, totally. I mean, I don't think you necessarily do for sure. But once you get this one, this one, this one, and then this one, right. Four strong bull candles in a row, you close, you've got. You got back above the hundred. So now, you know, this is your support level. And again, you're able to kind of determine and read. All right, well, we got a good bull fade here. So that that level should hold. That's the thing about bull fades, right? Bull fades. These levels should hold a period of time. And so you're saying yourself, all right, this, this should be a good line in the sand for a period of, you know, for a little bit. And then back to our basic 10 EMA. This bear candle is going to be closing above the 10, and this bear candle is going to be closing above the 10. So both of those bear candles will also be closing above the 10 exponential moving average. And that would be giving you a bull signal to probably go bullish above this hammer and then stop loss can be anywhere down here below the 100. And that really wouldn't have been that awful of a trade. Right. Just expecting to trade up maybe into earnings, but more importantly to trade up into the 200 simple. Which you have on your screen. And that's really what acted as a perfect resistance. And then you're correct after earnings and everything kind of plays out once we get back above the 200 and once we get out of all that bear volume. So we take out this earnings and we take out this earnings and we clear all that resistance, then for sure you have another really good bull signal over here.
It's amazing how much earnings plays in these gaps. Like earnings comes up thing just tanks overnight in the first five minutes, really.
Agreed. So why. Why would you not have been looking for a bull fade on this gap, Eric?
Oh, well, the next day. Oh, I see. You mean if we played it the day that. My cursor is on the previous.
Either that day or the next day. But yeah. Why. Why weren't we.
Really.
Yeah. Why did it not go up? Why did it not have a bull fade?
Well, it's high. It's higher than everything else.
Huh.
We have. So you're saying that we're looking at it this day, right?
Yep.
And then we don't know what's happening from here on.
Correct.
So, yeah, right here.
So, yeah. So why did it not. Why did we not do that? Why did we not fade up on Amazon?
You have to close above. Well, there's a ton of volume right here, so there's a pretty good resistance on line right here. Like, you gotta break above this. I don't know why. Well, it should have bounced off this.
Yeah. And that. And that's what I want to figure out. It's like, why did it not bounce off that A hundred. And it kind of did. It tried to, but, like, why did it really get crushed? Sue, what you got for us?
I don't know. I'm. I'm agreeing with Eric. It's like. Yeah. Why did it keep going down? Because I would have expected it to bounce off of the 100 also, except that it was earnings. But what did it do? The last earnings and the one before that.
Sure. So, first of all, your initial instinct was correct, Eric. Is like, it's really high, Right? So we. We've had a big bounce. We went from 85 to 112 in a month. You know, I mean, that's $25 a share. A little bit more, but, yeah, 25 bucks a share on Amazon. So 25 to 30% growth in a month. So you have a lot of bulls in this one. And you can see the bulls. Big bull volume. We hit. We were hitting the 200 up there. So we have. We have some people who are selling off the 200. We have big, big, big bull volumes. There's a lot of bulls that are trapped. Again, it's high. So you're gonna have some people selling to take profits anyway. And then this is a pretty small gap. So what's the value of a small gap? Well, the value of a small gap, if we think about it from a psychological standpoint, it means if. And I know none of us would have bought there. But imagine you did buy on this candle because someone had to, right? His name was Jeremy 2010. Okay. That's where I'm buying. So someone bought there. And so the next day, when we gap down, they're losing. But how much are they losing? The answer is not a bunch. And what do a lot of traders do when they begin to lose, but just not a lot. They hold double down. They. They begin to pray. Like, it. It'll bounce. It'll recover. It'll. It'll go.
It'll.
Well, on that day, didn't it basically fade and almost fill that gap anyway? So still had kind of just feel free to keep going down then?
Precisely. Yeah, precisely. And so really, it was just. It was a few different things, right? It was a bounce off. It was a good failure. Of resistance right here. It was a small gap, but a powerful gap because it trapped a lot of bulls. The. The. The trend was already high, so a good pullback was needed, essentially.
And.
And we did attempt to fade off the 100. We really did, but it just never really quite held. And you got the hammer off the 100 and then. And then the hammer with good volume that failed. And once that failed. Right. We kind of, at that point, you should have known, okay, this. This bull trend is not going to hang. We retest the a hundred, we fail the 100. So this is a shorting spot right here. Short off the hundred based on this gap sentiment, the volume, all the things, and then, you know, you get that nice little press lower. So it. It's really just looking at the story and just thinking through it for a few minutes of, yeah, who's. Who's really losing money on this trade? And is it a lot of money? Are they terrified? Are they kind of scared? Are they a little scared? Maybe they are, maybe they're not. How high did it go? But, yeah, this was a nice bear gap and go.
Right.
Bull candle, gap and down those. Doesn't mean they can't fade. It's just a little bit less likely. Right on strong gap and goes. I generally don't expect a fade unless it's a very unique circumstance called Apple. And if it's Apple and it's gapping down on earnings, then maybe, maybe it'll fade. It doesn't really matter what it's going to do because it's Apple, and that's kind of like the last, you know, last earnings that Apple had.
Right.
It was a gap and go, but it faded instantly. So there can be very, very usual examples of that. But let's go back to. Let's time travel, Eric. Let's go back. Let's go look at Caterpillar 2018. So fastest way to do that is click on this little calendar right here. Yep. And just type in, you know, whatever, 2018, February is fine.
Okay.
All right. Perfect. And let's just study this chart. Let's see if we can find any gap down fades.
There's one right here. Right? Well, no, that's a shape bottom. But didn't gap lower.
Yeah, it didn't gap lower. But. But did it bounce off the hundred?
Yeah.
Yep. So it was. It wasn't a bull fade, but you could have. Again, I love the fact that you found the shave bottom. What about this guy right here? Yeah, that one's nice, huh?
Yeah. Yeah, because it's this resistance line here, kind of right here?
Yep. And are you able to notice, like, four strong bear candles came in, gapped down, and then you had the. The bullish engulfing fade, as Scott called it, which I like that term, but, yeah, we can see it's strong. Strong bullish engulfing candle came in, held the 100 again, giving you put again. If you're trading that day on the red line, maybe you're day trading it or maybe at open, you thought to yourself, man, this is really going to fade. So you played some option strategies down here somewhere, as Joe knows, Right. Selling puts or doing something of that nature, taking advantage of some of the implied volatility, expecting it to kind of go higher. And then once it starts to pop higher and you get a bunch of bull candles in a row, and then we retrace back down to 100. Maybe you're doing some swing trades in there. There's all kinds of things that you can do. But I really like the fact that you saw that level of price that we just kind of kept bouncing off and holding, holding lower.
That's why you wouldn't have maybe played this one, because this is the same thing, right? You would have said. You could have said, hey, I'm jumping in right here. This is going to fade higher. But it was too dangerous to do that because you wanted to really be down in this level, right?
Correct. That is correct. However, you can notice if you did play that day bullish, it actually did go higher from open. So we did open and we did trade up. So you could have. You could have played some. Some fade action that morning. But that would have been a day trade, most likely, right?
Yeah.
Yeah. Because you still have ways to go into the 100. And so that probably would have been a day trade. It most likely would have been a swing trade because there's like, as you said, there's nothing really there saying, hey, we should be swing trading this at this particular level. Or at least there's nothing that. That I see based on what we're learning. Yeah, good one. Beautiful. Beautiful. Okay, let me do a quick screen share. We'll look at a few other ones. We'll go through some stuff. All right, so bull fades, what we're practicing. So intel, let's go look at intel for my boy Scott. And this is going to be a very fun bull fade that's going to happen. Right? So again, this is just one of those more when than if, because you do have some bear candles. The reason, in my opinion, if we're just looking at this particular chart. The reason that we did go a little bit lower on intel initially is just because the steepness of this angle here and the fact that we opened below every one of these candles. So like a whole two and a half months. So there's definitely a lot of bulls in here. And the steepness of this angle just instantly trapping everyone at open. Although you do have bear candles coming in. And yes, intel is a blue chip stock and yes, it did gap down into some moving averages. Right. So there's the hundred right here. So we're gapping down. It just took a little bit longer for it to recover, or it will take a little bit longer for it to recover just because of the amount of people that it was trapping at open.
Right.
Opening below, essentially two months worth of price action, you got yourself a potential little ugly double top looking thing here. So it's going to take a little bit longer for it to fade, in my opinion, just because of the steepness of that little angle right there that just got immediately cut in half. But we can go back to some previous full fades on intel and look at it. So let's look at this one. So this is an interesting bull fade here. So you have bull candle, a bunch of bull candles, you have a double top. We gapped down and we immediately faded higher. So if we're just analyzing it, I don't think I would have expected that. So this would have been one that probably would have been pretty unique to me. However, let's just analyze this question. If intel would have opened here, would you have expected it to fade? And the answer is most likely right because there's a huge gap down and it's gapping down into a support where it opened. I, I probably wouldn't have necessarily expected it to fade, but it did. So we had a gap down, we opened and we just faded higher. We came in contact with the hundred simple moving average. We closed above it once we close above that 100 simple at that point in time. Again, if we know that this bull fade should kind of be the line in the sand for a little period of time based on volume. And we have good volume there. Right. So you could draw a line and go, okay, we should hold this level and if we do something like this, we should bounce and continue to fill the gap and this volume should hold. If this volume doesn't hold, then we're going to have some bear problems and the overall stock's likely going to drop. Scott.
Would you consider that a bullshit as well, it's two bulls.
Yeah.
Previous day was a bowl.
Yes, sir. You got it. Bullshit pattern that it's going to go.
Up at that point with the fade on top of it.
You got it, dude. Nailed it. Well done. Good eyes. Good eyes. And so the question is, did we? And the answer is yes. Right in this. In this vicinity. You again could have said yourself, all right, bullshit pattern. Right. Bull candle gapping down into a bull candle. Good volume. I wouldn't have expected a fade on that day, but it still happened great. You got that compression. 2. Two days of sideways movement. You got the big breakout here. So this is a really, really good, super high probability trade. And then after you get all these bear all the bull candles in a row, right? Bull, bull, bull, bull, bull. Price action fades. Or so we fill the gap entirely. Would we be expecting team, or should we be expecting something like this and then something like this? And that's what our. That's what our analysis at that stage should probably be. Yeah. Considering or expecting. So we come over here. Sorry, sorry, I pressed the play. So at what point in here do we know that something's up?
Yeah.
Huh. Pretty much that candle right there. So once that candle comes in, that not only does the open of that candle show some really, really powerful. I mean, it's just a brilliant, brilliant open, trapping so many people at open. But what's also fantastically interesting about that is check out the next day's wick. I mean, notice how it is literally just failing that volume price. And that's a really good trade opportunity. I mean, that's a good day trade opportunity. If you're in shares, you could have sold some covered calls on that day just to capture some extra profit. Profit. Some extra upside. It's a really, really good, again, in my opinion, pretty solid opportunity there for some downside action. Because again, you have that. All right, well, hey, here's all the volume. Here's everything that I see. Here's all of it shaping up in front of me. And then you get the candle that says, nope. Everything you thought was wrong, you're like, all right, sweet. Everything I thought was wrong line in the sand has been torched. We are now at more of a selling event. And we sold on that particular stock on that particular day until we got back down to the overall support area. Got your little doji. And then we started rallying, rallying off of it again. Plus, it's intel, right. The definition of blue chip. So it's going to be hard to hold that one for a long Period of time short. And the way that I know all about the blue chips and how they fade and how they move and how they act is because I went back and back, traded a lot of blue chips and just kind of, like looked at it and kind of started feeling and learning and understanding until one thing I can tell you is do not short blue chip stocks at new lows. Whatever the new low is, whatever a new relative low is. So, for example, this was the previous low right there. Guess what you don't want to be doing right here? You do not want to be shorting these blue chips at new lows. That's not the time to get in. Because people buy blue chips at new lows because they're getting a good. They're getting good price. So I'm not saying you can't make money as a blue chip goes down. What I'm saying is you don't want to do it at a new low. You want to sell a blue chip as high as possible. When day trading or when swing trading. Okay, cool. Let's just keep going back a little bit and just look at another gap down. Big gap down. All right, so this one. What an. Another. Another remarkable, remarkable piece of intel here. Check this out. How cool is this? Just so awesome. Bear candle. Huge gap down on earnings, right? Boom. Massive gap down. Where did it open? It opened with a new low. We are, we are lower than this price here. Would everyone agree? We're. We're lower just by a few pennies, but it's a blue chip stock, AKA intel, gapping down. How much does that gap? Ten and a half percent. So we're going through the checklist, right? Is it a blue chip? Yes, yes. Yes, it is. Is it gapping down 10%? Yes, it is. Is it making a new low? Yes, it is. What's going to happen? You should be expecting to fade now. The expectation of a fade that's going to come down to you and your time frame. Let's say that you, you don't want to day trade ever. Because you're looking through your results and you lose every day trade that you take, but you win every swing trade. And you've noticed that over the last year. Well, what should you probably stop doing? Probably stop day trading then, right? So if you, if you look at this and you go, okay, I'm not gonna day trade this. Cause I literally can't day trade my way out of a paper bag. So you don't take any day trades on this. And then you start swing trading, you buy either buying shares, selling puts, or you're doing something that has some type of general bull strategy. At what point do you go, oh, this isn't good. This guy. When that guy comes in, you go, oh, this isn't good. And you don't necessarily have to short immediately on that day because you don't short blue chips on new lows. So on the candle that I'm pointing to, the red arrow, that's when you begin to plan your bear position. That's all I'm saying. You could have still taken a bear position and you would have had to hold through a little bit of heat. But if you. Instead of shorting, and there's a big difference between shorting here and shorting here, you know, you still get filled on the next candle. But you could have gotten a much better price if you're buying puts or if you're shorting shares. You could have captured an extra 50, 60, 70 cents on the upside, knowing that you shouldn't short a blue chip at a new low, even though that candle is a very, very strong close and it's trapping all types of bulls. And you can have a pretty good estimation that's going to go lower. Same evidence that we get here. Okay. If you definitely. If you don't know it's going to short now, you do. I mean, you have to know it's going to go short now. I hope so. And again, bear candle gapping down into this candle was a bearish. You have that gap up there. You know, it's a retest gap. And you shouldn't short blue chips at a new low. So what do you do? You create some type of limit sell order, and that limit cell gets filled on the retest and then it goes down. And you make more money by shorting higher. Yes or yes. Family. And this is all, again, from experience, which is what I'm here to try to teach you and just help you and help all the, all the insights that, that I've learned over time and all the good things and all that jazz. Okay, coming back into. All right. Another great example of this is probably not going to fade. It's good to know when something's going to fade. It's good to know when something probably isn't. Bunch of bull candles. Look at the steepness of it. Right?
Really.
And look at the open murdered. Right? Tough, tough, tough, tough, tough, tough. Now, if you're like, well, Newsom, what about don't short intel at new lows? That is correct. That means that I probably guess what would have missed all of this bear money. But what would I have played.
Well.
Once the bounce off the 200. What? The bounce off the tuner on the weekly. That's crazy. Yep, probably would have, right? So even though I'm missing the bear money, I'm allowing myself to start planning when. When I would have gotten into the trade. Because as, as Brian said, there's the tuner on the weekly. I know not to go long at open, but I know I'm not shorting a blue chip stock. So as it goes down and I wait for a lower price, that too is an awesome, awesome spot to go long. And if not there, when we close above this volume. Right. So when we close above that bare volume somewhere over here, I'm still able to get in bullish, and I'm still able to capture some good profits. And then we get the fade that we're going to talk about on Thursday, which is the bear fade. I love bear fades, dude. Oh, man, those are so cool. Bear fades are awesome. Especially for day trades. All fades are cool. Okay, so let's just keep looking at a few more. We don't have to go to Intel.
So basically, on intel, every time there's earnings, just short it because it's never going off.
You know, it's funny that you say that, but intel generally does have a bare bias on earnings. Yep, you are correct. So does Snapchat. Snapchat's usually bearish on earnings, too. Speaking of Snapchat, let's go look at it. So why. Why did Snapchat not fade? Well, bunch of reasons. As a bull candle gapping down, it did gap into some moving averages, kind of. But it was also down 30%. So when a stock is down 30%, are people like, oh, whoa, I should. I should buy. What a great discount. I mean, 30% overnight is a lot, right? That's, that's, that takes some stones to start buying something that's down 30%. Also, again, just practicing from, from previous experience, if we said, all right, when's the last time Snapchat gap down 30% and what did it do? Because, because again, if you're, if you're by yourself, you don't have me, and you're like, all right, well, what's something going to do? Always just ask that question, well, what did it do last time? Because that's all I'm going to do. And you can go and find most likely a time that Snapchat gapped down 30%. Oh, here you go. Like this one. Look at that. 32% right on the nose. And what did it do? Sold off, consolidates for a few days, has a pop and look how long it takes to really recover. Took a while. Right. So are, do you think that this is coming on Snapchat?
Yep.
The answer is yes. Do you want to play that? It's up to you. It's coming, Tom. That's the next move that's going to happen on Snapchat. And you can take the bar replay and you can copy it over and you can plan for one of these and you can capture a few points to the upside, knowing this is going to get obliterated at some point and it's going to chop back down. In fact, since we're here, might as well do it. Doesn't cost us anything. Let's go to, let's go to this gap down.
Okay.
This was Nancy's favorite part of class, the bar replay.
Oh, it's fun.
It is super fun. And so this was FedEx, this little blue, this one. So that's. But it shows something pretty similar. Both of them show that we should start bouncing I would say by February. So if we're looking at this, I mean again today I'm looking at, you know, pre market right now. Friday was an inside day. Bear inside hot candle, a little bit of a hammer type of candle. And it looks like we're trying to open above the high. It's again for a day trade. Probably the only thing I'll do with it. You have room from here to here. 40 whole cents could be a pretty good day trade to plan for. And again, looking at the bar replay and get just kind of practicing that, we know that we could definitely get a bounce. But the bar replay is literally copied from the exact last time that Snapchat gap down 30%. And if we did the drawing according to the bar replay. Look at this little puppy. That's where we're going friends. By mid March we're gonna go fill that gap right there.
Now I don't think it's gonna continue to drop back to the all time low again.
It will at some point. Yeah, most likely at some point. But that before we do that we'll be at 13 and a half. So we'll be at 13 and a half before we get to 950. But again, now that we're looking at this, is there a lot of money to be made with this move? It's like, I mean theoretically kind of. But we're really only talking about a dollar two. That's two and a Half dollars. Best case scenario, if you bought today, it's all right. Is it the highest probability, $2 you've ever seen? Probably not. Got a lot of stuff in the way, but that makes. It just makes sense that we can kind of analyze again. All we're doing is analyzing. What did Snapchat do the last time? It gapped down 30%. And there we go. Weekly chart. Yeah, you're below the 100 simple on the weekly. So that's at 1323 right now. So that's going to be a big, a big to do. Be a lot of resistance there. All right, so we're coming up into prime time market open. Let's go review some of our positions and our socks. I know a few of you are in and happy to answer any questions and review anything specifically.
Where are we?
I have, I have a stock to look at, if you don't mind.
All right, brother.
Hit me arm. I don't know if that was already talked about in all the chats, but.
We have, we've talked about this one a lot.
I'm looking to get into on maybe today. I know it might retest a little.
Bit, but it will. Yeah, it will retest. But I, I did mention I don't think this gap ever fills. Talked about this one. Yeah, I think, I think ultimately you're going to have some pullbacks because it's just so flipping high. So today, I mean, you know, we could trade up into 125. We even do 130. 135. But we'll have, we'll have relatively sharp pullbacks just because it's up so much in the last two or three days. My only opinion on this one is buy as low as you can, sell as high as you can. I wouldn't be super, super aggressive on breakouts and I'd probably try to pop into smaller time frames maybe like let's go look at the hourly chart. And so if we're looking at the hourly chart, we can see some support resistance. This is the pre market high from the earnings gap. Here's a nice little hammer right there on the hourly. So I'd love to get the. I'd love to buy it around 110. Want to pull back to 110 if we got that today or tomorrow. But yeah, I wouldn't be overly massively aggressive on arms because it's already up so much over the last three days.
Would this be a good for a caller then to buy it and just do a caller at like 1:35 ish.
Or 132 even. Yeah, yeah. This would be a good caller opportunity. I agree. Because the options are going to have big volatility. You know, sell some calls, buy some puts, protect your downside. Yep. Especially if you can buy low enough. Because again, a good time to buy would have been, you know, Friday because it on Friday. Really from Thursday's high of 125, we opened 15% lower than Friday, than Thursday's high Friday morning. So you already got a little bit of a discount on Friday. And I think that you'll probably get an opportunity that today. But I agree. Great. Super strong, unquestionable trend. And it seems to me like this would go higher over time.
Yep.
And then Amazon looks very bullish too.
Amazon. I haven't studied Amazon a bunch. Yeah, nice compression trade sideways where I was at four or five days. And we're coming up into the all time high. All time high is 188. So we'll hit that this year, the new all time high. This is just a resistance, this little 176 price. It's just a small little level of thing to watch. Yeah. Beautiful compression for four whole days. Right. Good gap up on earnings. We know the trend is bullish. Not to worry about that. Sideways, sideways, sideways, sideways. So what does sideways allow? Right, team. It allows the stock to rest, allows the moving averages to catch up. You got a really good little pop into there. So same thing as I would just buy some type of little small retracement, little pullback and then 17681 would be target one. And then ultimately the all time high by the end of April, 188.17. Oh, you're. You're muted, Jeff.
I bought 40 shares in that compression. I didn't go crazy because I didn't. We was just still like kind of unsure. But should I buy more today? Seeing how it just broke above that gap, what do you think it. It might retest back down to the gap. But just if I'm just going bullish on it anyway. Just get in again.
Yep. Are you still in your 40 shares?
Yeah, yeah. I didn't exit them. I'm holding longer. So I was thinking of trying to get to 100 and maybe doing a caller on it.
Yeah, I like that plan. I like that plan. Yes, yes, yes. Thumbs up for me, dude. Thumbs up. Our girl sue is all excited about Carvana. So was my answer, Ms. Sue, helpful on Carvana?
Yeah, perfectly helpful. Thank you.
My pleasure. Yeah, my pleasure. Because that's what's really awesome about options. And really, once you start studying the collar and you practice it a little bit more and you really have that depth of knowledge. Just super cool. Because it's so easy. It's hard to mess up. Right. It all comes down to equity. Like, do you have positive equity in that position? And if you do, you can create unlosable trades for the rest of your. Rest of your natural born life.
Yeah, I liked your answer. It made it a lot more simple. It's like, yeah, don't overthink it. You know. Hey, can you. Can you look at its ticker symbol? S YM Sim was just doing a scan and it looks like a gap down and possibly fading up coming off the 200.
Yeah, that was you. You nailed it. That was Good job. That was a good gap down. Good gap fade. Yeah. Right off the 200. So this is when again, I'm not in this position, but this is how I would have probably looked to play that. Once you had that gap down, that was probably on earnings, so that that didn't fade. So again, I wouldn't have been like, oh, sweet. I could have maybe considered it to fade that morning. It just simply didn't. But when this candle comes in, tell me the sentiment of that candle compared to the previous candles.
Well, it took out the bare volume there, that big volume bar. Took that out, took the one below. It closed above the 100. It's like I'm going up.
Trapping all that bare volume, trapping the indecision closing above. Like you said, you nailed it. Both the 100 and 200. Yeah. It's a pretty chart. And what's cool about this chart, too, is today, let's just. Let's just say if we're all right. Aren't you Somehow we. How are we going to come up with this trade? Well, this gap is about to fill and it's gotten. It got very close on Friday. So we were just talking about gaps filling. But then if we were. If we needed to take a trade on this, if it pulled back into here, that would be our buy spot. And then we just hope at that point. Right. We have our risk, we have our plan, and then the market does whatever the market does. Yeah. Jeremy, would you set up a short where that gap fill would happen? You. This is. It's a very, very popular strategy. Yep. Very popular strategy. I would look at. Let me go look at the weekly, see if there's any other reason up why I would short up there if it's high or. Yep, it is high. So this the stock hasn't been around very long. Hmm. Interesting little move. Wow. This thing just kind of came out of nowhere. Popped on the scene. Probably want to do a little bit more research on this company. It looks kind of cool. Yeah, Yeah, I agree, Nancy. I mean this could absolutely be one of those that you. You take. And, and here is probably my thought process as to why.
Right.
You got a little bit of a double top looking thing here. You got a pretty good drop. You got again, the gap down fade. Gap is filling. Also potentially retesting that neckline. So if I was going to short the gap fill, which again is absolutely. It's a strategy I've seen people do. And that's the, that's all they do to just play gap fills, both up or down. So short something like that. So I would set that piece up. Yes, ma'. Am. Okay, the big winner for us, Mongo DB. So y. Well done. It's opening at 50388 pre market. I did trim a little bit off Ono on Friday because it's getting. I mean, 5, 14, 15 is my ultimate target. But I mean it was at 507. And to let, to let you all know, just so that you kind of have context and trades like this, what I will do and what I am doing is I'm taking the profits from this and I'm reinvesting it into other assets. So I have a few business deals that I'm working on right now. And so I'm taking this and I'm buying equity into some other business deals that may or may not work. We all know how those happen, but it's just all profit. So if it doesn't work, could have. But if it does, how awesome. And just from a trend perspective, both Mongo Database and Nvidia, for me, I really could shut down 2024 at this stage and be pretty good. Just like, all right, sweet. But that's what's amazing is it doesn't take. It doesn't take that much to take a lot. You can trade, you can be in and out, you can day trade, you can do all the things. But as, and if, as we've been talking about really this whole last three weeks, if you're going to be studying something and you put in enough size into it and you get into the right amount of risk and you have the right amount of planning, you can make really good money. And it doesn't mean that you have to. You can, you can live off that money, although you obviously could, or you could use it for your bills for the next five or six months. You don't have to work as hard. There's a bunch of different ways to think through how you can create that income for yourself. For me, since it's so early in the year, I'm just putting it on. I'm just putting it on some flyers. Meaning, like, I'm investing into some companies that may or may or may not blow up, right? If some do, awesome. If they don't, whatever.
All good.
But you're still buying tickets into the room in situations like that. I know we're all, you know, a bunch of us are in Tesla. So Tesla's finally starting to increase a little bit, mostly because we got that close above that hammer. So it's still going to take some time to really, really get out of here. But this yesterday, which is Friday, was the first time that we actually closed above all this bear volume. So there's definitely some hope. So I'm in. I bought my Tesla. I got pretty much, at this point, as much as I want. And I'm just gonna leave it alone for a few days, few weeks, few months, and just see what it does. The higher it goes, obviously the better. But I am in my Tesla shares at this point. I've got as much as I want. And now we. I would just wait it out. Jeremy, can you give me some analysis on Zillow? Zillow, I can. So Zillow, I think it's just going to be relatively choppy until earnings. I know earnings are this week, so it's going to be a big week for you. The interesting part about Zillow is we do have a very, very small possible double top forming here. It's tiny, so that wouldn't be a huge, drastic selling event that could just get us back down, like 52. Is that going to happen before earnings? No, I don't. I don't think so. So I think on earnings, I think today we'll have a small inside candle. And what's really interesting about Zillow, Brian, if we think about it, if we zoom out to a monthly chart, is we just have double insides. So you had an inside month. All of last month was an inside month, which is just patient, patient, patient, patient, patient. And so far in February, we're having an inside month. So the two key levels that you will need to know and you can start planning for, for your Zillow position is what happens if we here and what happens if we open here. Obviously, you want to have answers for both, and then you want to have answer of what does it do if neither one of those happens? So if it doesn't open above or it doesn't open below but it opens really anywhere in between and how much, how much longer are you willing to just to hold and just to kind of chill out Because I know you know how earnings impacts option prices. You have tons and tons and tons of time on your option. All it has to do is start moving in your favor and everything's back to, back to being good for you. So I will tell you when, when it got really high a couple of weeks ago, like a week and a half ago before it started dumping, I did resell those call options. So I, I have not been stressed down about it going down because thankfully I did tick the top and resell those call options. Cool, that's, that's awesome. Yeah, so that's, and that's, that's, that's the benefit, right? Buy low, sell high. That's what's cool about the trading world is you're able to take those positions and, and capture some profits and do the things. So yeah is that those are the only two prices that I would really be concerned with if anything else doesn't happen. I think that's just going to be another inside month and just keep holding for longer.
Appreciate it.
Yes sir. Joe is asking questions about Mongo database in the chat pane. So Joe said on Mongo database, is this a candidate for buying long term dated out of the money calls with profits? Yes, absolutely. I mean realistically you can always do that which is the good news any, anytime you're profitable on a position but this one is a candidate for it because the all time high is 570 and you know there's some resistance here but why not? So the answer is absolutely because the cool news is that can always kind of be a strategy. The only thing that I personally and this is just opinion at this point as far as like timing and trying to be like a market timer is let's say you had $6,000 of profit. I would buy 600 and above call options and if I had $6,000 of profit that I wanted to put into longer term dated out of the money call options, I would do half now and half on a big down day because and the reason I'm trying to like leg into some stuff right now and when I say leg in means just like I'm, I'm being a little bit more cautious for the next probably two or three weeks. It's been too easy making money since January and February, essentially everything is more or less just going straight up unless it's Tesla. So everything, I mean, Nvidia went straight up. AMD is going straight up. The markets are at all time highs. Q. Q. Q. I mean, we're the highest we've ever been. S p just hit 5,000. Tom, we need some kind of pullback. So I'm, I'm gonna be a little bit cautious for the next two or three weeks on most big name companies until we get some kind of selling event. Even if it's just one or two days like we got right here, January 31st, we need something. So it's been too easy and we're a little bit too high for me to be buying a bunch right now. Scott says, I heard that some EV companies are going out of business. Do you know which ones? Yep. Lucid, lcid elusive is going to go to zero.
Would you put a, put on that.
And just let it ride you? You can, but you should have asked that question a year ago. There's not a lot left on them is the thing. So that news that you're getting. Yeah, the news that you're getting is a little too late, buddy. Again, by the time the news hits, it's already happened.
What was the question?
It bleeped out which EV companies are going out of business and would you buy puts?
Oh, okay.
So the, the answer is sure, you could always buy puts. There's just not a lot of room left for them to go right lucid at 350 and then you have Fisker FSR, it's not much better. Right? 78 cents. So all I would say is that news. That is old news, my bro. Unfortunately, first time I heard, it's all good.
They're saying that's going to help push Tesla higher though, because the options are getting less.
Yeah, that I agree with. That I do agree with. That's correct. So I'm in my Tesla, man. I'm in. As much as I want to be at this price, I am in, in, in. So now we'll just see how it slowly starts to fade higher, does its thing. Any other stock that you guys want me to review for you? Any other positions that you want me to review? Let me know.
If no one else has anything. Can you look at that one that we looked at previous? M I n M.
M I M.
We talked about it.
Yeah, it's.
It looks like it's holding the support line of the big bull candle that came in at that price point of 4.74 and it's retest. It's going up from there.
Yep. So this is the. Yeah, this is still very, very, very valid to watch. I do agree. So this is the big. The big one to watch on this one, Scott. Just this weekly. This weekly chart. So you have huge volume spikes. And again, I'm not saying this is going to do anything crazy, but talk about Eric, a 50% mover. I mean, this is very, very, very possible to start if things starts to pop. Because next week we're talking short floats anyway. Yes, absolutely. Continue to watch this.
This one you could just do with. Could you do an absolute zero on it or would you wait a little bit on that?
Oh, yes, I would. It still needs to get above the high of this. Of the 100. So it still needs to take out the 100. Once it gets above. Let's call it six and six and a half. Eric, you could do an absolute zero. If you want to take an absolute 0 now at 455 again with a. With a risk unit and go, all right, if it goes to zero, whatever, I lose an R. Me and Nancy have made some money on some trades that way. We've done that a few times. And then when slash if. Because this is probably more of an if than a win. If it breaks above last week's high, Scott, then you can add to your position and increase your stop loss from being zero. Maybe it's at 1:55. And then, you know, if it breaks above the high of last week, it could. And this thing could see 14 in a day. Literally. Like, it's.
It's just.
Could just get squeezed out so quickly. So, yeah, it's still definitely worth watching, man. Absolutely. Good question, my brother. Hey, Lunar. All right. L U N R. Very nice. Very nice out on lunar at open. Thanks. John Alonzo, welcome, man. Yeah, appreciate you, bro.
That's what.
But that's why. That's why it's. It's all about being in the room, right? Family be in the room. You be in the room, you get the deals. Like that was. That was a John Alonzo gift. As soon as I saw that chart, I was like, easiest trade setup I've ever seen. Yep. Easiest trade. It was pretty well, family, let me know if you have any questions. Your homework until Thursday is just simply find current bull fades. Right. We can go back in time all you want. That's awesome. But see if you can find any that are happening now. This is earnings season, so that's what we're doing is we're going to keep talking about earnings gaps, we're going to be talking about earning strategies, we're going to be talking about earning sentiment. We're going to continue to talk about how we can predict and plan and come up with ahead of time, what something might do, when, where and how. All those fun pieces. And in general, that's really going to be our opportunity for growth, is just to practice, practice, practice. And so go look for your fades. Currently, things that are either fading now or might fade and why and, and then Thursday, we're going to talk about bear fades, which is what's happening on intuitive machines right now. Love you all so much. Thanks for being here. I'll see you on Thursday.
Bye.
See ya.