Ultra Wealth Jan 18th, 2024
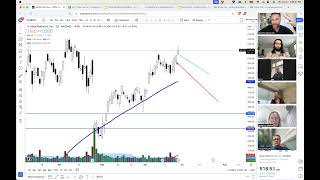
Live trading/mentorship session (Ultra Wealth, Jan 18, 2024) led by Jerremy Newsome reviewing student homework and multiple stock charts. Jerremy critiques price-action patterns (double tops/bottoms, neckline retests, shaved candles, hammer, inside candles), moving-average interactions (10/20/100/200 EMA/SMA), and volume signals across timeframes, gives trade examples (protective puts, pyramiding), and assigns weekend homework to study historical market bottoms. The call includes live market commentary on specific tickers (Nvidia, Tesla, Chewy, Carvana, Rivian, Intel, Silver, Boeing, Shopify, FedEx, McDonald’s, Keurig) and practical trade-management advice.
Chapters
Yeah, same, same.
All right, welcome to Ultra Wealth. We are back at it again. It's January 18th. Got so many fun things to talk about. Thank you for your request. This is so much fun. I love looking at socks that you all want me to review. I just enjoy it. It's exciting. So I'll definitely review those. Kind of the discussion today is I'm reviewing some of your homework and I plan on making another longer video for going over all of your homework that I'll post in our WhatsApp group a little bit later. Probably right after this. I'll kind of go through it just to spend some time on it. So you can kind of see that my perspective of your homework as well. And then, of course, ultimately, let's make sure this is set up right. Yes, of course. Ultimately, review the live markets while it's open, and then, of course, review our discussion for today, our homework for the weekend until we meet again on Monday and just answer any questions that you all have. So we will start with the homework because we still got plenty of time before market close. And we're going to come in here and we're going to start with. Jason's not here right now, so we're going to start with Joe and look at her chart on the cues. So, Joe, what was one of your initial takeaways? Kind of reviewing the cues from the monthly, weekly, and daily perspective?
Well, the first thing that popped in my head was I surprised that it hadn't been going for that long. It just seemed like it's been around forever. So just a few months before the two year 2000 that I was supposed to do, so.
Yep.
And obviously in 20 or in year 2000, it made a big double top throughout the year, Tom.
Yeah, and the double tops are one of those big patterns that you'll see a lot. It's, it's really unique. But the big, nice, gnarly double tops, those are the ones that are generally going to reverse a trend. And again, team, a lot of times they're going to come after the momentum has already kind of waned off. Everyone's been all excited. Buying, buying, buying, buying, buying. We go higher and higher and higher and higher and higher. And everyone thinks the. The world's gonna keep doubling every day. Everyone's just gonna make constant money. And then eventually you kind of get that sentiment that just allows the pullback and the selling. So this is really cool. I like how you, how you noticed here on the cues that increasing bear volume that test the new 20 EMA and close below there, I mean good, really good volume increase, which was nice. And then of course also looking at this particular chart, this right here being that very, very, very powerful shaved top candle there, creating that resistance. And this candle also, you kind of got that spike of hey, maybe, maybe something's up. You'll see that a lot team. When things are getting a little shaky towards the top, you have this really, really big crash pretty fast. And then it consolidates back up and it generally doesn't take out the high of that candle. And then we roll over. And again, this can depend on a lot of different factors. It doesn't have to roll over, but if it starts really the big one was taking out that candle right there. That's the one where you can start to know that something's up on a big reversals. When that bull candle gets taken out, you have that lower high and you have all that support getting broken by this candle. That's kind of when you can know something's up. So that's the monthly on the Q's and then here's the weekly. And again we zoom, we zoom in here for just a little bit. You can see there you go. There's that immediate take out of that hammer candle. So that was a big deal. A lot of people trapped on that. And what you'll notice is the low of that candle. Not perfectly, but to an extent does become an old support, new resistance. Fascinating piece of technical evidence, but that will happen so often, my friends. Gorgeous selling event retest into that old support, new resistance and then that ultimate failure, which is great. And this was cool for you to notice, Joe. Four bear candles in a row. And that was the first time that that hat that had happened on a weekly chart. I mean looking at that particular chart, right. We had as it hadn't occurred before, we had three, but we hadn't had four. So once those four bear candles come in and we make a new low, this is often when it feels most comfortable too short. So when it feels really, really comfortable and super easy and super obvious to short, that's usually a good time not to. And then you got the lightsaber one white soldier candle. The really strong gap that came in trapping a bunch of bears. We did end up continuing higher and then we eventually broke down. Now the breakdown that will zoom in and next week we're going to talk a bit more about advanced 10 EMA stuff. But we can check out right here really, really pretty Tennyma candle. So you have this bull high wave indecision candle that's below both the 10 and the 20. And then the next week, you had that inside candle, and then you had the breakdown. So really gorgeous stuff back there on the Q's. Any. Any cool revelations on the weekly chart that you had, Joe?
Well, just noticing how it was respecting the 10 and the. And the.
All.
The 50 pretty well. The 20, not as much, but.
Yep. Yeah, it did. It did it. Respected it. Well, I mean, you can. Right. Right in here. Like, if we zoom in, there's. There's. It was a support, support, support, support, support, support, support, support for like two week or, sorry, two months. Then it broke through it right here, then acted as a resistance. Perfect. Yeah, those. Those two moving averages were really, really clutch at that. At that moment. And then here's the daily breakdown, which is always fun. And again, this is an analysis to just really, really analyze and study. And here's this double top. I like this double top a lot because a lot of people will be afraid to draw it if the second peak is higher. But if you think about it, if a second peak is higher on the double top, that just means more people are probably trapped. Right. Because you got a bunch of people that bought up there that were buying the breakout and the candles that came in, that is very, very common. The candles that came in right before this really, you know, took a tumble was your high wave, indecision, doji type of candle. So right there was a big one. Right there was a nice one. So those was a really, really beautiful reversal. Good stuff. Huge volume hammer followed by inside candles. Retesting the double top neckline.
Yeah.
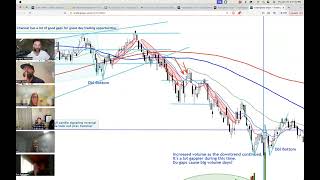
Let'S zoom into here for a little bit. So again, that same shape, you're gonna see them. You're gonna see that shape over and over and over. As we go through this program and just go through some of the trades that you guys are looking at. Good drop. And there's the neckline. Retest that neckline being all up in that general bottom of the M of the double top. So this right here is the neckline. Now, it's never just a penny, right? It's never an exact price. It's never an exact dollar. Just like your neck isn't a singular thing. It's like all of this. It's not just what? It's not like a singular bone. We have all the whole neck. And so it can come into an area where it's a zone. It doesn't have to be an exact, precise, infinitesimally tiny location. It really is a zone that you can start shorting or watching to short on the retest. And once this big humongous bear candle came in right there after the retest and was a big, bearish, engulfing candle. That's when you know, yeah, we can look to absolutely play some bear positions. And that was a really, really good Drake trade and breakdown. I also liked how you had, the channel had a lot of good gaps for day trading opportunities. So this is the, the big channel that you had drawn. And then much later in the day, much later in the chart, this blue line that you have here, that's, that's something that you drew. And this is really fun for me. This is the part where again, I can play things bearish. But if I'm ever going to call out a market to just crumble, you really, really need to start having evidences that look like this over here. It took time. Yes, all this was good, selling all, all kinds of fun stuff. But really it's right here where things start to shift, where the 100 and 200 cross. So you guys can see that, right? The daily 100 is below the 200. The moving averages, you're below all of them. This was your last, last ditch effort bull candle here. And we held that for a couple days and then once that broke out, once that broke down, that was it. You're now below every moving average on every time frame on that particular chart. And you know to only be looking at bear trades. Great chart. Jode. Let me answer this question for you. Increase volume as the downtrend continued, it's a lot gap year during this time. Do gaps cause big volume days? Great question. And the answer is yes, yes, yes, yes. One thing that you're going to notice, and this is fun to practice or just fun to see or understand is in bear markets, you're going to have some of the biggest bull days. That's what's crazy about bear markets. You still have huge, huge, huge bull days. And the reason I think is because, well, I think it's twofold. I think reason number one is because you're going to have bears that are covering more often than not to also to be buying along with other people. Number two, you're going to have dip buyers and people who, you know, are investing who think it's a good time to purchase. But number three, it's easier to have a bigger percentage when the stock is cheaper. So as something's going down, you know, something goes from 20 to 10, that's a 50% drop. But from 10 to 15 is a 50% gain. So the math is just, it feels a lot bigger Even though from 10 to 15 you're still $5 below 20. So in bear markets you have really, really big up days. And if you can confirm you're like yep, I'm in a bear trend, like there's no reason to be bullish here. You don't buy on those days. You short on those days. Right? That those are something to practice is like on that huge, huge update here or these massive updates here, you're taking the downside position. Those are not times to go long. It's really, really challenging to start buying into bear markets. But when you're doing it, you're doing it really, really low, really slow, really methodical and you're waiting for great breakouts eventually. But it takes a long time for them to reverse. And so today we're going to be reviewing and practicing and studying some market bottoms after I go over a couple more pieces of homework. Great work on that one, Joe. Let's go look at three seconds. Eric's charts. Okay, so Eric was looking at umbrella on the monthly. So monthly, two big bull candles, highest volume ever, massive run up, never fell below the 10 until it fell from the top. And that is the indication that the trend may be changing. Big move up happened so fast in the stock market on the monthly chart doesn't show much detail on the weekly and the daily. Yeah, it was very quick. So this big, big, big, huge volume spike encompasses all of this candle. Right Eric, Isn't it amazing that you can see now how awful of a signal that is? Right? All that buying occurring at the highest price ever. Not a good sign. And granted now we might know that but a lot of people think that that's a great sign. Like oh, this is going to break out. We're going to continue to go higher. It's very rarely the case. Very rarely. So awesome, awesome understanding. Beautiful job spotting that volume. That's amazing. Here's the weekly. So the weekly. Let's see what we got. Holy cannoli. A perfect double top. Yep, perfect. That's the big takeaway. I'm glad that you found on this one. I mean this, look at this, this is thing, this is what Brian Jones dreams about at night. Look at this double top. And then look at the retest. The retest comes right into the hundred, right off the 200. The 100 on the daily is the neckline of the double top along with a gap along with the 10 EMA. I mean like what are you, what are you doing? You know if you're not shorting, there's after all of this drop in this huge up candle right into that level. Like you got to start looking to go short. You have to pin it. Tons of inside candles. Pressure and battles between buyers and sellers. Yep. Do you find it interesting and what's your thoughts, Eric, that that pennant pattern broke bullish?
Well, I, I'm wondering if that long bear candle there had something to do with it. And once it started to go, then those people had to buy the COVID and they were scared. So that's why it went. That's why I think it went bullish off of the pennant pattern.
Yeah. Makes sense, right? Yeah, I would agree.
What would you say besides.
Tom. Yeah, I think you're absolutely right, man. I mean you, you had this huge run up. So again this run up, let's just say it's from 75 to 1:30. So 1:30 down to. Let's just call it 130% pullback in essentially two days. So some people are like okay, great, we can start buying again because we know that pullbacks are fast and fierce. And so other people are going to think that that's a great opportunity. And you had all the bear volume, which this is also a huge signal. It's like, hey, something's happening up here. Be watching it. Right. A lot of volume came in there. And then as we went up, people were thinking that this is a great opportunity to. Exactly. You bought the dip. You had to pull back. Let's go Bullish. There are some ways to make money on the way up. And then we just like you said, perfect double top. I mean just stunning. And then you had some tennyma patterns in here. Beautiful waterfall right down to the 200 retest failure. Perfect. And then over here, I love that you have the a hundred SMA on the weekly. Interesting that it's at the exact price today. It is. That is cool. Bounce off that lines a couple times. So here it is in 2014, 2015. And then ultimately right when we broke below that moving average. Crazy as it sounds, that's still a really good short opportunity. Right. Pretty easy to identify as well. That that strong support just eventually broke down and cracked. And then here is your weekly chart. Weekly charts. Profit takers from the run up causing the pullback. Yep, got it. This is exactly what you told us happens. A hammer candle and the next candle takes out the bottom of it. And it's a short opportunity. Yes, sir. So there it is. There's your little hammer. And then the very next candle Perfect. Close. So good job finding that. Really good job spotting that. And then again, perfect break, perfect neckline retest. Awesome short. I really do love this pattern. I'm so happy you spotted it. I mean, look at this. Look at that 100 on the weekly and then that pressure from the top. So you have a big moving average and just all that consolidation like that's imagine for a moment you don't catch any of this downside action. None of it. Do you think after everything has happened you'd be able to analyze and still play this move down? The answer is absolutely. I mean that's still 20, 25, $30 a share. Which with options or with short shares or a little bit of, you know, some margin sprinkled in there. That's a really great trade. Any big takeaways or revelations for you, Mr. Eric?
No, I just, I just, I just like that hammer candle that gets taken out. Yeah. At the top and that. I've seen that so many times just studying back trading now that you said it and can just go look at it and it, it's a, it's a thing that should be. That we should seek and figure out because it's very predictable once it does that.
I agree. Yeah, I agree. Perfect. All right, so let's go pop out of here. And then so it's. Here's Sue, Jeff, Nancy. Jeff. Nancy, Jeff and Jeff. All right, we'll go look at some of those. Nancy, did you have fun with the Dow Jones? Like cool for you. It was interesting. Like I said, the hardest part was there was no volume to look at, so I had to only use candles.
So.
Yeah. Yep. Makes it fun, fun, fun. All right. Intel 2000. Let me go look at. So Intel. Sue, on that particular chart, you are correct. It's going to help a lot. And it probably looked different on your chart. I'm, I'm sure best the monthly. But if you zoom out a little bit, it'll give you some more. Essentially just some more detail because that this, that's how we make our money. Right. So just a big zoom out. So if you go all the way back to 2000 on intel, come over here. So kind of see it like this big, big zoomed out version. It just allows you to see a lot more uniqueness there. But I like what you have right here where it says price drop 45% in a month. That's a signal. It's not supposed to do that. Right. That is not good for the bulls. Yep. September, huge bear candle. Amount of selling in September is The second largest of the year. Blew right through all the moving averages. Shave top, shave bottom. That is a bearish Maru candle. And. Yeah, fascinating to see, right? Strongest candle that can happen. And once that occurs, just like you said, it blew through all the moving averages, even just in one day. And so once that happened, man, what a. What a strong breakdown, right? Marbozu candles, if you're taking notes, they almost always retest. And by always, I mean 99.9% of it. 99.99% of the time it. It retests. So what I mean by retest, I literally mean, like, you're gonna have a move and then some type, some level of play pull back into it. Because the whole candle is shorts, right? The whole thing is shorts. There's no. There's not. There's no buyers anywhere to be found. So if the whole candle is shorting, then that actually and literally means that at some point, all those shorts gotta buy, and it's gonna cause the stock to retest a little bit. So very, very, very, very common for that to happen. All right, let me get Jeff's. So good job, sue on intel. All right. Oh, so this is. This is the extra credit. So this is the current chart of silver, and I actually agree with your chart. Oh, you're muted, Jeff. Let me unmute you.
I said I actually got in on that trade today. Actually went right to that line, and it just retested back up today.
Nice, dude.
It actually reused the old supports from when you had me look at it. 2010. It's weird.
Oh, man. Like crazy. Like crazy. Silver is. Yeah, 20. Call it 2050. Down to 2020. Like, that price point is a great spot to buy silver. 2.0.50. Down to 2.0.00. Because here's the thing, man. Zero. Silver is never going to zero. Duh. Right? So it's like if you buy sil, silver, steel, aluminum, gold, if you buy them low enough and just leave them along long enough, shouldn't be. Shouldn't be a problem. So anyway, yeah, great purchase, man. I love that awesome chart. Good job putting all that together. Okay, so we're going to go look at. Here's the daily chart. Big buying volume candle becomes nice resistance line and happens to be a nice gap candle. Yep, agreed. And you can see that big volume candle down there kind of acting as a support. Big shaved bottom bull candles. Yes. And yes. So as glad. I'm glad that you're seeing the shaved bottom candles and you can also see where they're occurring because that's again, a strong buying signal. Right. When a shave bottom comes in, ladies and gentlemen, that really says, hey, the bottom, the floor should be in. Floor should be in. We really shouldn't take out this price. And if slash, when that happens to be at a really good support, right, like this moving average. And you can see he has literally a support line drawn in there. And then here, when this shape bottom comes in, you'll notice that it's a higher low. It's not a lot higher than the last one, but it is a little bit higher than the last one. That creates a very, very strong, obvious buying signal. In fact, you know what's cool about this chart? Who? I will send you a hundred dollars worth of silver for anyone who gets this question correct. What chart does this chart remind me of? And I'll give you a hint. What's that?
Nvidia.
Joe wins a hundred dollars in silver. Nice job, Joe. All right. She is correct. She is correct. This one reminds me of Nvidia. So why did you say that, Joe?
Just because of the consolidation it had right at 500, and then it's just been taken off since it broke through there.
Precisely. Now, here's what's cool, is if you go back to Nvidia and compare the two charts, because again, team, here's what we're going to practice and what we're going to become ninjas at over the next six months. Blending all the time frames together to see, feel, know, and understand the patterns that's happening right in front of us all. Because once we can see it, we're like, oh, I've seen this 40 times. You're gonna know how to trade it. You have higher lows. The orange line, I think, is the. The 200. Simple moving average. You have a big moving average you're bouncing off of, but notice how strong the resistance is. So you have this resistance from the top that's, like, not going higher, not going higher. But the lows are like, I don't know, dude. You sure? And we keep making higher lows. Highs are the same. Lows continue to get higher. And then if we zoom in just a little bit on Jeff's chart, which is really a beautiful chart, and we zoom into right here. Jeff, walk us through the sentiment that occurs right there before the breakout.
Am I on mute now? A bunch of indecisive candles came in. And then once it broke above that resistance line, it was just basically off to the races. Pressure was building. Well, pressure was building on that gap.
Yep, yep. Is that a Morning star reversal it is. Yeah. Evening star. Evening star reversal, yes. Evening star. That just never goes lower, right? We never took out the. The low of the evening star. We built a bunch of pressure at resistance. We. We broke above resistance and just scorched higher. You. Yes, yes, and yes. So then here's the monthly chart. And Jeff's chart here is, you know, you see the consolidation. So there. There's the consolidation I was just drawing. Same exact consolidation that Nvidia did. Same pattern and everything, right, Joe? And then half. There she goes. And this is what happens when you get a big consolidation that breaks out. It runs forever. And you get the pullback, which is normal. And then you get the big move. Big buying volume at the top of a run usually means stock is reversing soon. Next month. Big selling volume confirmed the reversal. Yes, yes, yes. Good job, Jeff. Awesome. I love that. Love that you spotted it. And, and yes, I know again, people will say, well, if you study this, like, how is this going to help you in the. In the future? It's like, well, that's what everything is like.
All of.
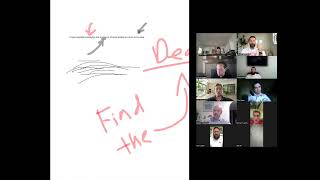
All of life is doing things a little bit to prepare you for the future. When you see this type of volume on your next. Oh, wow, I'm in a trade and I see a huge amount of volume. And then let's say you see a big bear candle confirming the reversal, you will then know and check it out. Inside candle. We've seen that before, right? Have we not? Big bull run up. And again, this is a totally different asset class, totally different time of the year. And this is 2010. So this is totally different than all the other reversals we're looking at. But you get the big selling the big volume inside candle. So, Eric, back to yours. That would have been the pennant pattern, right? And then the pennant pattern does what? It breaks to the upside. Would you agree? Same as amber. And then poof goes the weasel close below the neckline. Let's do a quick trivia question. I'm going to draw four candle arrows. Those are probably hard to see. All right, give me three seconds. Let me make this a little bit bigger. Okay, I want you guys to type into the chat pane which candle, which arrow color represents the neckline for that double top? Let's go ahead and type into the chat pane which color arrow represents the neckline. All right, well done. You all typed in red. That is the correct answer. Beautiful work. Now, I know it's obvious now, but what a great spot to short at. I mean, as it's hitting that price point. You're doing one of two things, Jeremy. You're either going short or you're not going long. Those are two different things. Right? Going short, taking an active position, buying puts, shorting shares, selling calls, doing something that makes money as it goes down. That's a position. Not getting in is also a position because you're not going to lose money if you're not in a position. So if you're just straight up in cash, Brian will tell you, liquid cash is awesome. It just sits there and just meows and doesn't do anything awesome to be awesome as well. It just sits there in a corner hanging out, ready for you to use it. Also a position. And notice how many times we failed that neckline. Three times. Three times. Well, really, I mean, it depends on, I guess, your definition of failure. But it hit it here and failed. It hit it here and failed there, there, there, there, and there. So a bunch of different times. It interacts with that price ultimately to go lower. Now, are you ready for this one? So, again, random fact, I'm sure you've already pieced this together. I will be doing another video going through some people's homeworks that didn't go over, but I would love for all of you to spend a little bit of time looking at all of your other charts, looking at other people's charts to see what they see, studying other people's charts to find out where are the similarities from the homework that you did. Because what you'll notice is if we go back to Joe's right, 2000s NASDAQ, we had a double top, and look what happened. How many bear candles in a row on the monthly? 4 bear candles. And then we had the big pop. Isn't that wild? Like, that's crazy. It's the exact same pattern. It's nutty. It even made a new low right here by, like, a couple of pennies. But make a new low. Four bears in a row. And that had a good pop. Which just simply means if you're ever playing a bear move and you're like, all right, I want to short the market so hard. Go spend 10 hours studying previous market failures. Go spend 10 hours on the weekend practicing reversals and looking for patterns and letting it help you come up with a plan. Because what it will do is it will allow you to not go bearish here and go bearish here or here or here, which will just give you so much more profit potential. All right, awesome work. And then here's the weekly chart of Jeff's and for all of you who need to know, right there, you guys. See how that hammer has a little bit of an upper shadow? See that upper shadow? That's me. That was created those created by your boy. And it was a thing of beauty. Eric will also see how that was a nice hammer type of candle. And we closed below that hammer and we took out that hammer low. In fact, really, we didn't even close blow it. We actually did one better. We opened below it. Now a close is cool. Closes are awesome. But an open. Come on, an. Oh. I mean, it didn't even wait. It doesn't even wait the whole week. It does it the next Monday, right. Because Friday's close and you have a weekly candle. And then on Monday you open below the low. That last week made good heavens. When it can't even wait five days to take it out, that's even worse. So that's why you just get absolutely stoned to death. And that was. That's how I lost a million dollars right there. Goodbye. Yep. Cyan. Sayonara. But you. But you learn your losses are always your best teachers. All right, and then into the Dow Jones. This is really cool chart. So this is the Dow Jones. This is your one day. So each one of these bars is a day. The weekly, you're going to get candles. So the bars are, you know, a little bit challenging, but you still did a great job. Nancy just kind of see everything that was happening other than then, other than just having fun with it. What was your big takeaway revelation from looking at the Dow Jones? Just that history continues to repeat itself. Yep. Yes, it does. Like Covid right there.
Boom.
Yeah, right? Yeah, totally, totally. I agree with that a lot. So this is. If we zoom in here a little bit, you have a Tenny Mae candle right there. You have one of my favorite reversal patterns, Tweezer top. So two bear can, you know, two candles, bull candle, followed by a bear candle. The exact same high. 1, 2, 3, 4, 5 bear candles in a row. Got the retest. And what's cool. And again, Obviously this is 1928, but a lot of people would call this some type of double bottom, which, you know, call whatever you want. That's fine. Truth of the matter is, here's the neckline. Did we trade down to the neckline and bounce off of it? Yeah, we did. And then once the bounce didn't hold and we really took it out exactly like Nancy said, pull to Covid. And then 200 SMA acts as a support with a nice hammer. What's amazing is I have seen markets do exactly this so often. So often. I mean, there's so many countless examples of big crash into the 200 simple on a weekly. And then what does it do? This doesn't seem like a lot, but this is almost a 60% gain in the market. That's huge. I mean, a bounce from 220 to 280, by the way, for some of you. I know some of you are in the RLT community when this happened. But last year, when the big drop happened in late 2021, and then we started retesting on the Q's, and. And we ran into that big price that I shorted everything at. This was the chart that I used to help me do that. It was this one right here. So if I go show you in reference what I'm referring to, go to a weekly chart, pull up some long terms. And I was just studying market drops. I was just doing everything that we're doing right now. And right here. Here we go. So this is what I was studying. Just. Just doing exactly what we're doing now that I wanted to bring that home to let you all know. And you're like, how does Newsom get so good? I'm. I'm showing you. I'm giving you the secrets. It's nothing crazy. I just study old patterns a lot, and that's what I spend the majority of my time doing. I do trade. Yes. Obviously, everyone here trades, but when I'm already in a trade and my money's at play, what am I doing on the weekends or at night? Or what am I spending a decent chunk of my analysis time doing is going back in time and looking for patterns that are trying. Like, what's happening now. And check it out. You had the absolute scorching drop down into almost. Well, if you turn on the adjusted for dividends chart, right, you get very, very close to the 200 simple on a weekly. So you have the boom, boom, boom. You already know where this is going, Jeremy, but it's cool. And then we retrace. And look. We retrace into what? Moving average, the 100 from the bottom. Notice how many bull candles are in a row. And check out that with the fact that we're retesting the low of that prior bounce pivot. You guys ready for this? Check this out. Spooky. Same chart. I just. I just move the drawing over. So if I delete the drawing now and do it in a different color. Let's do it in green. So you got the Big drop. Huge drop down into the 200. We retest. What do we retest? The 100 period. Moving average from the bottom, right. You got the same pattern. Boom, boom, boom, boom. Same exact pattern. And we're retesting what the previous. A previous support pivot. Previous support pivot right into the 100. Simple bang. So I went short August of 2022 on everything that I own at all threes. 333.33. The high was 33442. Got it within a dollar. It's good to be lucky. Could have gone higher. I was planning on it going higher, but it didn't go a lot higher. When a dollar, a dollar higher, that was it. And all of that analysis stemmed from what we just reviewed, just looking at previous charts. And then as this chart will show you, when we made a new low, which wasn't until here, right. Essentially make a new low, what happened? We got a bounce. So that whole make a new low, don't short the new low thing. We got a new low here, right? Came up, came down, came all the way down, Made a new low relative to here, and then started bouncing a little bit. And this is the spot that needed to hold and eventually did. And then we're going to get to what we want to talk about today and. All right, you guys already know the homework, I'm sure. But there's the run up. And then that creates the double bottom. The retest comes into the neckline. The retest is off the 200. Simple moving average. And look at what happened right there, Eric. Some of the biggest volume on the chart happened at the neckline Weekly double bottom on the 200. So can I ask you a question?
Jeremy?
Hit me, bro. So is the reason that that big volume spike on buying is a good sign instead of a bad sign of.
Newbies getting in is because the price.
Is actually lower compared to what it was at the end of 2022.
Is that right?
That's it, brother. You got it. And. And that volume held. That's the other part of the answer. Because there's two pieces, because this one, this big volume didn't hold, we took it out within two weeks. This volume held. And so at that time, back in March of 2023, so essentially a year ago, I was like, all right, guys, this is probably the low. Could we go lower? Of course, dude. Anything is possible. But this is the line in our. This is the line in the sand. If we take this thing out, things can get problematic. Otherwise, I'm bullish into the 100. And if we break out of the 100, then I'm really bullish because there's nothing stopping it. So your homework before we go into live market stuff and live market research is if you had to guess, we're studying market tops and bottoms. So here's your bottoms to study. Same exact process. Feel free to put a little bit of time into the daily, weekly, and monthly. And check out Jeff, what's on here now. I'll give you that one. Silver now is working on bottoming formations. So this is happening as we speak. It's not 14 years from now. This is. This is happening at this exact moment. Schwab of 2023. I'm gonna give this one to Nancy because she's already playing some Schwab, so she might as well study her face off on it. All right, Germ, you get The Dow Jones 2009. Really fun bottom to study. Q. Q. Q. 2003 and 2010 is going to be Jason. All right. And Eric, you get Bitcoin 2019. It's a real. It's a real party. It's a lot of fun. Scott, you're going to get one of the coolest reversals of all time. I'm really interested to see how you analyze it. Tesla 2017. This is when your boy made it. So Tesla 2017. All right, Joe's going to get AMD since she's made a bunch of money on AMD. That's you, Joe. 2017. All right, Brian, you are going to get. Since you love banks, bank of America 2009-2020. That's how long it took to reverse 11 years, essentially. That whole time is going to be really interesting just to see, just to study, just to analyze. Because all big drops always take longer to recover. I think we can probably all kind of understand and see why. And then, Sue, I'm going to give you first solar 2012 to 2020. And I think that's everybody that's here. And I will be reviewing Qualcomm and Intel as well. So I'll put myself on those. I'll post some charts. How you guys feeling before we go into live markets? We got 15 minutes before it closes. Good, Cool.
Great.
So everyone's got your homework. All right, sweet. Because again, really, that's. I mean, that's, that's really it as far as slidesh for this week is, it's just like they take longer, you know, obviously 99 of the time accumulations of reversals are going to take longer than bear markets take to form. My Favorite pastime. The thing I love to do when I'm just really, really bored, like Ultra board is go to the Dow Jones from the beginning and just backtrack the whole thing every day. Go back to Eric's birthday, Jeff's birthday, and look at what the Dow Jones is doing. See what did in World War I, Vietnam, World War II. Just, it's a blast. It's really fun to do. Okay, so present market, present day, my thoughts. So I don't exactly know what we're getting such a strong bull move for. That's fine though. It's okay. This is actually something that I'm going to be talking about sometime next week, which is the 10 EMA reversal. Brand new strategy that I haven't talked about anywhere before. And I'm still really trying to dial it in a little bit. But essentially it's when the Tennyma doesn't trigger, it's when it's like, oh, this is the perfect 10 EMA opposite direction. So it's like you don't lose anything. But look at this gap. I mean, this is the spy we opened above the high of yesterday's candle. I mean, we, we essentially trapped anyone who shorted. I didn't get triggered in bearish on the spy at all, as you can see. But I am in some bull positions, and that's because we just keep on crushing. So we're going to kind of talk through a little bit about the Tenny May reversal because all of you know the Tenny may pretty obviously well at this point. But it's just one of additional features that I've been spending a little bit of time on. So broader markets look like they're going to continue to go up. I still do have a pretty large position in Nvidia that I'm. That I'm nursing at this point into 600, which is my big target for it. And Joe, I already got. I'm pretty sure I got your address, Joe, but just text it to me just in case and I'll send you your 100 bucks because yes, it is the same exact set up. All right. To review Chewy. So Chewy, I have protective put ready to go on Chewy when we broke below those two bull candles or sorry, three bull candles, all below the 10 EMA I got filled on my third pyramid. So I am in shares of Chewy with a long put that expires in February for $20. Remember, I don't want to use that put. I don't want you to continue to go down. It's okay if it does. But I got filled on my third pyramid at 1850. So at this stage I'm looking for Chewy to do this. If it does that, which is awesome, which is kind of my ultimate thought and goal and what it's going to do, then we're going to lose on the protective put. But we have a whole month to see what Chewy's doing up until that time. So if Chewy's 23, 22, 50, something like that. Right. A little bit of a bigger pyramid. Pretty, pretty large. I have no problem waiting this one out. We've literally been in a week and a half to two weeks. So I'm not stressed about it, just letting it do its thing. Based on that volume, it looks really beautiful to me. I'm pretty excited to see what it's going to do. Carvana. I have protective puts ready to go. If we break below yesterday's low on Carvana. I don't think we do, but this is still a. This is technically a morning star reversal and I am filled on two out of four levels on Carvana for a pyramid. So if we break the low of yesterday, I will buy $40 February puts if you're in Carvana. If we break below 40, 32. Again, I don't necessarily want us to do that. I don't think we will, but I'll be prepared just in case. Because like Jeff and Scott said a while ago, it's like if we think something's going to go down, even though you're buying it, you might as well make some money on the downside. Right? So Carvana nicely can move. We're in the second pyramid of Carvana. I got two more to go. So if it goes all the way down to 31. Sorry, $30. Beautiful. Rivian is just selling off in direct, direct comparison with Tesla. So I have now purchased as of today, I. Cause we got back down to all these, this strong low here. I now have 400 shares of Rivian personally and I'm gonna wait a couple weeks, see what Tesla's earnings do, see if any kind of cool cybertruck news comes out, kind of go from there. But again, buying it pretty low, buying it pretty slow. Just because I do think even almost worst case scenario, it can either get bought out or eventually kind of pump back up to 28 or 32 or something because it is making revenue and revenue is increasing on earnings. So even though the trade's going down, I'm buying it low. I'm not being aggressive on this One, this is one that is essentially I'm planning for it to take a long time before it goes a lot higher. But all that can change with a good Tesla earnings. So into our stock that's going a lot lower, which is Tesla. This was a really, really beautiful day trade opportunity. If anyone was day trading on Tesla today, it had some cool, cool, cool moves. Earnings right around the corner and we're just hanging out. So presently to me it looks like we're going to keep dipping and I think we're gonna keep dipping into next week if Tesla gets to 200 again. It's a big if. But if we get down here, this is where I'm going in pretty heavy on Tesla. I'll be buying some shares. I would like it to happen after earnings. And again, if I go out here to a monthly chart which is that really, really big long term timeframe, the reason I'm buying it is because that monthly level is a strong support. Just hide all my lines here for a second and do the logarithm chart. So the 100 on the month is obviously 114, so that's forever away. But it's going to be very, very good risk reward in my opinion. Because if we break through and close below 194.67, which we failed to do over here, but we've only done it once before, which was right here. If we do that, we can play the downside pretty aggressively. That's going to give us good risk reward ratio. And again, anything is possible. I don't necessarily think that's going to happen. Also, you have had four bear candles in a row on a weekly chart and for Tesla that's kind of rare, especially at the 200. Simple. So earnings are next week and we'll get to see how earnings play out. And if we get a good gap up on earnings, everyone will be quite pleased on Tesla and it'll all be good to go. And if it gaps down, I'll kind of give you guys some advice and thoughts. Just a few more. Walmart.
I have a question, I have a question on Tesla.
Real quick before you go.
Sorry. Do you think all this crazy news coming out, how people are stranded and they can't move their cars anywhere and you know, all the electric vehicles are basically failing around the world. Do you, do you think this thing could go down to $190 a share because people are losing faith in the electric industry and don't put much money or faith into it.
So I was, who was. I was that You, Scott, that asked me that.
I said Rivian's going to zero.
Oh, gotcha.
That's just some bank just cut their funding and the supply chain just fell out.
So this, this winter is gonna be tough on electric vehicles. My Tesla's sitting at the bottom of the driveway right now because it can't make it up the driveway because it's too icy. Not that, I mean you need a four wheel drive to get up my driveway. But what I can say, at least for me, is Jeff, that's a very, very good question. And I do think that's a strong reason why Tesla and other electric vehicles are getting so pummeled right now is because the winter is already tough and it is really hurting electric vehicles. So like if you're driving a Tesla, you know you have 300 miles on it and you put on the heat and it's less than 20 degrees outside, that battery gets murdered. It goes, it drops so fast.
They're doing big news stories during the.
Minus 40 for sure.
It's not going to work in negative 40. I don't even know what it would. Negative 40. It was just, it's just going to become a brick.
They got news stories with them at the charging stations. It's so cold they won't even charge. So they're getting them towed away to Tesla facilities. And people are like, I don't have a car, like, I can't drive my car. So I think, like, I don't think that the stock's gonna see in the threes or high twos for a very long time until they fix that issue. It's my theory.
Yeah, I like the theory, man. I like the theory. And, and when I agree, I agree with you. The issue will be fixed. They'll figure out a workaround for it. But yes, the superchargers are very slow right now because of the cold. And seriously, if you're up in where Joe's at, I don't even know what happens to the Tesla. It just, it turns into a brick at negative 40 degrees. So, but on the flip side of that, I think it recovers. They'll fix the problem, but go look for some gas powered, diesel powered either companies or stocks or charts right, to start doing well. Because remember, there's three sides every coin. And so if one, one side's not doing well, the other one might. Caterpillar. That looks like a double top to me. So that one might not be that one might not be one that's gonna work out super well for whatever reason. Let's go look at Cummings cmi, see if they're doing anything. That's a big diesel company, see how they're doing, man. It just looks like the auto industry in general could be kind of a little shaky. Look at Cummings. I mean if we take out that support, that's going to go straight down. Interesting. So Caterpillar and Cummings both have interesting little double top candles. Well, I don't know man, but I agree with you. Like if you are in shares of Tesla, I agree absolutely with the freezing and the cold and, and that causing issues to, to tell yourself, all right, looks like I'm have to be in this a little bit longer than I might have thought or wanted. So I know me and Nancy are buying some shares. It's like, hey, but if you're buying it, just tell yourself, I don't think I'm gonna come out of this until June or July. Because if you're buying for the long term and you buy low enough and long enough and you do enough research, it probably is gonna work out in your favor. But do research because as you do research once you're already in a position that will help your conviction on the overall position. Awesome. Boeing up 4.3% today, had that huge, huge drop. And again, what's fascinating about this is we're already going to close above this candle and I'm gonna go look at Shopify. So in my opinion personally for Boeing, I think as we interact with the 200 and 100, I didn't even get filled at the top of my pyramid. I know some of you are already in a little bit, but if we do this, this and this, I think that's still viable. I know a few of you sold some puts on Boeing, so great job. Those puts are probably a lot less valuable than you sold them today, so that's really cool. And yeah, I didn't get filled at a pyramid, but we know that Boeing is going to bounce. I can guarantee you that this gap will eventually fill over here and it can go lower. It can, and I do believe it will. But don't be too aggressive just realizing that your long term moving averages are right there. Let them get like, get above those moving averages and then retest all the bear volume that's getting trapped. Scott, for Shopify. I agree. I think that this is probably one that you're going to want to snag a put or two on to protect yourself. On the downside, it looks like a very, very nice hammer. Looks you, looks like you have like eight bull candles in A row. And it looks like we're closing below, taking out the low of that hammer candle pretty much immediately. So the risk reward is good because this purple line is the 200 simple weekly moving average. If you're shorting here on some puts with a stop there, I think that looks nice. And what I will do is I will track that as a bear swing trade as well, because it, it does look pretty good, man. Trigger is now. I mean, that, that's. The trigger is like you, you. Yeah.
Below the hammer, right?
Yep. Because we're there. Yep, that would be it. So good, good find, Scott. Again, taking out the hammer at the 200 simple on a weekly. I mean, that's a pretty big deal. There's the 200 simple. So the risk rewards good. And also for any of us here, we can start planning, you know, since the overall market's kind of bullish. Tomorrow is Friday, Right. So we could allow maybe a little bit of a retest to come in. Maybe we get in on some puts today slash pretty much now because you got three minutes short, a little bit of shares and. Or tomorrow, which is Friday, look to short on a small pullback if we get it and have a stop a little bit higher. Just comes down to how much you're planning or looking at it. Right. You never want to forcefully or out of fear get into a position. Just all comes down to planning. So this is one that Scott was looking at for a little bit and then I don't, I don't know. The ticker to Airbus. Is it Airbus? I believe I got a scheduled call.
I got to take off, guys. I'll look at the recording. Thanks so much.
Yeah, got it, brother. Is this one right here, Scott, down.
Scroll down. There's one on the nasdaq.
Oh, is there? Okay.
There.
Let me see if I can find it on mine because I think I saved it.
I haven't. I don't think I've looked at airbus on the nasdaq in a long time.
It's airbus. Airbus, yeah.
Se.
After it.
Se.
The ticker is e, a, d, s, f.
Interesting. Okay. Oh, it's over the counter. I see. That's interesting that we don't have better exposure to this one. Yeah, that's an over the counter. So I guess, long story short, the answer is I wouldn't play with it unless you want to buy a much lower because the only way you can get it is OTC stands for over the counter. So think about, like when you're doing over the counter transactions, you're you know, in the stock market, you're literally going to a guy in a gas station handing him your money and go, please give me some stock. He's like, sure, I will. Yeah. Over the counter is always pretty sketchy, unfortunately. So it doesn't look like a big competitor. Yeah. But it looks like you can get it on some foreign exchanges if you want to pay a bunch of, you know, pay a little bit additional exchange commission. So I probably wouldn't, probably wouldn't worry about it, man. I mean, yeah, that's what's cool about options, Right. If you want to make money as it goes down by puts, if you want to protect yourself, you can easily do that with some options. Yep. And then I did post Keurig, Dr. Pepper and the WhatsApp group. We did get triggered into that today. So I'm in Keurig with you guys and we'll see if that ends up going lower or not. Good old Keurig. Any other questions as we're wrapping up this afternoon? Anything else you want to look at? Any other stocks you want to review? Anything I can do to help each and every one of you? Can you look at FedEx? Yep, FedEx. And then what were you, what were you looking at, Jeff?
I'm good.
I.
Once, once we're done this, I have a, I have a non stock related question for you later on.
Sure. So FedEx, go ahead. Sorry. You're good. So FedEx, sue, ultimately 220, I mean, if we can get down there, that's going to be your awesome little spot to buy it. It's going to take some time for it to get down there, but that would be the optimal spot. This is the daily chart and the daily chart. So you have tons and tons of bear volume that came in here on earnings. And it looks like you're kind of getting that little double top action as well. So my thought process is if FedEx comes back up into here, it's probably more of a be a little bit more bearish than bullish perspective. And we're going to slowly trickle down over time into 220. It might take three or four months, which tells me that if you want to buy some FedEx, buy it on down days and buy just very small size. Ultimately it probably can go lower. This is a really, really strong gap with really, really strong volume. And it looks like to me that it could, it could experience some more downside action. Scott, what you got for me? Dude.
I've been watching McDonald's, but it just doesn't ever really seem to drop a lot.
Never. Crazy, man. McDonald's get in on a position like.
That, just buy it and you just know it's just going to go up.
Yeah, well, I mean, it, you know, it depends. It did have a good drop in October. So it's like, how would we get into it now? Probably a few different ways. I mean, one thing to do is, you know, buy a block of shares that you have some number one, number two, buy some call options. Because if the stock goes higher, right. Call options are the ability to buy the stock at a lower price. So if you buy three or four contracts at 290 for March and come March it's at 305, you can exercise those call options, right. You literally do it. What, do what they're created to do, which is give you the right to buy the stock at a lower price. So then you cash in your chips and you buy your McDonald's when it's at 3 or 5, at 285. And then last but not least, as we talk more about it in the future, some option sales. So start selling some puts around 280. And if you sell those over, earnings, so come, you know, expiration into February, you'll get paid about a dollar, dollar and a half for those. And if McDonald's does drop and go back down to that price, you will get put some shares and you'll buy some shares a lower price. And then of course, if it continues to go up or sideways or down just a little bit, you still make your premium from the put sale. You get paid to wait, get paid to be patient, and then come into February, you can do it again.
When the stock pays dividends, how would you see, does it tell you what they paid per share?
Yep.
Or is there like a standard?
Yep.
So if you, you, you have two ways, really the easiest thing to do is probably just click on the in trading view. Just click on that little D right there. Yeah, yeah. So it's a $67. That was a $52. That's per share. Yeah, $52. Yes, sir. And the easiest way that I have found to find the yield, I'm sure there's probably an easier way. I just, you know, this one's pretty easy. Yahoo. Finance. And then just throw that ticker in and it'll tell you the actual, the actual yield. So if I go into McDonald's, go to Yahoo. Finance, click on McDonald and Dividend. So 2.29% annually. Makes sense, right? Because so let's say it's $300. So 2%. $300 is 6 bucks. Yep. What. What was your non stock question, Jeff?
It's about a. It's about a business I'm. I'm starting. It's. I don't want to tie up anyone else's time.
Okay, cool. Yeah, yeah, just reach out individually, man. Yep, just reach out. I'll help you in providing insight that I can.
Cool.
Sue, Jason. How you two feeling? You guys good? Great. All right. Good day. Yeah, I agree. Okay, we got your homework. Go study those market bottoms and see what you see there. Feel free to share any revelations, takeaways, ideas, thoughts. We will review that homework on Monday morning. We will review the markets, we'll talk about some setups, and of course we will dive into the advanced 10 EMA information which is coming out next week. So have fun. Thanks for being here, team. You rock.