Ultra Wealth January 4th, 2023
Live mentorship session (Ultra Wealth, Session 2) led by Jerremy Newsome focusing on strategies to buy market drops. Core methods explained: (1) Absolute Zero — allocate a fixed risk amount and buy shares such that a zero price equals the pre-defined loss; (2) Recurring purchases — fixed-dollar buys on a schedule (weekly/biweekly/monthly or DRIP); (3) Buy-on-down-days / pyramiding — accumulate small shares on red/‘down’ days and add larger positions when technical strength appears. Instructor uses chart walkthroughs (monthly/weekly/daily) and examples (Apple, FedEx, Exxon, WW, Tilray, Rivian, Nvidia, Square, Hawaiian Airlines, Carvana, Chewy) and assigns homework to paper-backtest the buy-on-down-days approach using TradingView's paper trading quantity feature.
Chapters
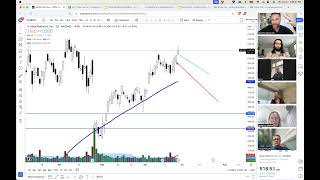
Okay. Markets are wide open. I'm very excited about this. We have a lot of things to review and a lot of things to talk about. But what we're going to do for today's session, the second session ever of Ultra wealth, is we're just going to review the broader markets, kind of talk a little bit about what we discuss and then hop into some of your questions and hop into our material for today, which is really just a little bit of an expansion from Monday. All right, so pop over to here. Beautiful. So the two questions that we got initially today, we have ExxonMobil, we have WW and we have Apple. So we're going to start with Apple and talk a little bit about what that, you know, why, why here, why this area? What's interesting about 182, why this is a pretty good spot to start picking up some Apple. And as you all probably know, based on Monday's class, you can start with monthly, monthly, weekly, daily and start drilling down into those long term averages. Right. Just to see where everything is at. So here's your monthly look on Apple and we all know it's going up. So bullish. Tom, again, just taking this at face value, right? Just looking at what we have here, then the weekly chart. We can see the weekly, really, really interesting move. But overall general trend again is bullish on the weekly perspective. And then hopping into the daily and check it out, we have a cool little convergence of both long term averages on the daily chart. They're starting to come together. So that's a pretty nice little showing of strength for both moving averages. And if we look at it from a perspective of. And I know we haven't dived a whole lot into chart patterns in this mentorship, but all of you are very familiar with the chart pattern, the double bottom like that. So you have the double bottom. This would be the neckline of that double bottom 182. And it's the 100 and 200 something moving average on the daily chart. One of the biggest things to remember and the reason that we talked about the pyramid and the reason we're talking about dollar cost averaging today is you're never going to buy the bottom number one and number two. I still haven't found a way to not be scared when I'm buying a stock that's going down, even if it's for like a microsecond, I'm not saying I'm afraid all day, but if you are planning on buying a stock, a crypto, a foreign currency pair, a commodities Anything. If it's going down, you're buying it. Your brain's going to feel like you're wrong. Your brain's going to feel like you're an idiot. Because again, in life we don't generally see the price. We might see the number, but that's really about it. And everything else that we buy in life oftentimes is tangible or linear as far as the price is concerned. It doesn't have these crazy fluctuations. So When Apple hits 182 today and goes down to 181, you're like, what an idiot. Oh my gosh, it's a whole dollar lower. I'm the worst trader ever. You might feel that way for like an hour or two. But that's why you can start to leg into positions using multiple price points. Right? Multiple areas of entry. And so if I'm just looking at this on the daily chart, you know, the 100 and 200 could both have been spots to pick up some shares. And then here is the weekly perspective. Right, the weekly perspective. If you're trading all the way down here, you have to imagine the possibility that Apple could come all the way back down to 163. But maybe that's the spot where you have a lot larger of a position. Maybe your pyramid goes all the way down into there. But that's really a lot about what we're discussing today regarding how to kind of leg into some positions. So let's go ahead and talk about it. And then as I'm talking about it, we'll go through the other pieces of the cla, the other stocks that you were all requesting that we kind of look at. So session two, week one, which is where we're at, strategies for buying market drops. And again, this system does work on pretty much anything. It doesn't translate extremely well to forex, just because forex is kind of a different animal, but it has the same propensities oftentimes. But here, there's hundreds of ways to do dollar cost averaging. Here's probably my 3 favorite. I know we talked about the pyramid, right? We've already discussed that. But here's what we're going to be discussing today is the absolute zero method. Buying XYZ amount bi weekly, weekly or monthly, or buying XYZ amount on down days. And when I say XYZ amount, that's just an amount that you predetermined. You kind of just pick. So let's go look at that for just a moment. Absolute zero. Let's talk about that because this One's a fun one. I know a few of you probably know this one, but just in case you don't, again, today and Monday might be a slight review and we're going to start really diving into some awesome stuff as we progress from here.
But.
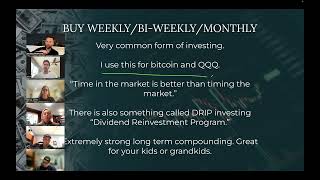
Just talk about pins being at $25, you know, a couple months ago. So when pins was at $25, if you said to yourself, okay, I, I want to play an absolute zero risk, what does that mean? It means you take an amount of money that you're willing to lose, Right. Whatever your risk is. So let's say your risk is in this situation. I typed a one number incorrect. 20,000. Give me one second to update that slide. Zoom that. Okay. Risk should be 20. Perfect. All right, so if I say my risk is 20,000 and I want to be in this overall position, then all I have to do is divide 20,000 by whatever the price of the stock is. Or again, whatever your risk is. That's the. Keep the piece to keep in mind, your decision is your risk. That's up to you. Your decision's your risk. So now any stock that you're looking at, so let's pick a random. Doesn't matter, not important, not cool at all. Company honest. So I was talking about this the other day. This is the Jessica Alba company that makes diapers and baby wipes and other things. So the honest company is at 289. So let's practice a quick little math formula. If you want to do an absolute zero at 250 and Scott, you had a risk of $1,000, how many shares would you buy using the. Absolutely. Using the absolute zero method. Yep, you got it. 250. That's it. So if you're playing an absolute zero, generally it's on cheaper stocks. It doesn't have to be. But if you're buying something and you say, okay, I don't know if this is going to go up, I don't know if this is going to go down. You absolute zero it. And if the stock goes to zero, you lose your risk. Pretty easy. Relatively self explanatory. Now here's what's nice though. When I do an absolute zero position, I still over time have the ability to increase my stop from zero to any higher number. So let's say, for example, on Pinterest, right. I take the trade on Pinterest and I have a $20,000 risk on Pinterest and it's at $25. So I just simply do 20,000 divided by 25. And I come up with 800 shares. If my stop is anything above zero, I will be guaranteed mathematically to lose less than one risk unit. I'll pause there for a second. Does that make sense? Any questions on that? Because that's just the cool math. Now, one strategy for my higher earners out there, anytime there's a new ipo, I have a buddy named Scott that I coached with a few years ago. And his strategy is he buys Mostly, mostly new IPO companies, most of them like 95%, unless it's like a multi billion dollar IPO. But if there's an initial public offering, that's like $10 billion or less, and the stock comes out. So let's say SpaceX. When SpaceX hits the market, it's gonna be valued at probably like 140 billion. But let's just say, for example, it comes out and it's at 9 billion and the stock is listed at $67. If you bought the stock at 67 with a certain amount of money, the lowest it's going to go is zero. How high could it go? You know, who knows? Infinity. I like this method a lot for buying stocks, for buying IPOs, or for buying companies I'm not entirely sure about, but I want to have a little bit of it just in case. And again, over time, I can slowly increase the stop from zero to any higher number. Here's a real example. I got very lucky with this particular example. But this was an example of Hawaiian Airlines. So back in November, I was with Johnny Guarka, who most of you guys know is one of my first coaching students ever. Good buddy of mine, kind of like my dad in my life. And he lives in Hawaii, and we were together in Destin, Florida. He was like, newsom, you should buy Hawaiian airlines. It's at $4. I was like, well, yeah, but it was at 10, like three months ago. It could keep going down a lot more. And he kind of pitched me the story. He told me, hey, man, Hawaiian Airlines isn't going anywhere. It's the only airline that can fly back and forth between the islands. Everyone here in Hawaii loves them. They have great employees, they have great customer service, so on and so forth. So he really pitched me this. The story of Hawaiian Airlines. Well, what I was doing is actually blending a lot of what we're discussing today. I started with the absolute zero method. So I bought 2,000 shares at $4 and my stop was zero. Two or three days later, I bought some more shares and I increased my stop loss from 0 to 25 cents. And then bought some shares, stop was 50, then bought some shares and stop was a dollar. And the reason was a dollar. That was the lowest that, you know, Hawaiian Airlines had ever been. So over time, I was still buying the stock and I was just increasing my stop loss, doing a little bit of math and just creating again, worst case scenario, that if Hawaiian Airlines went to zero, which is very rare for a stock, by the way, team, it takes a long time for a stock to go to zero. Even Enron. And that's, that's the stock that we're going to be studying in a couple weeks. It takes a while for a company to go to zero. So even if you didn't know how to get out, you'd still be able to get out eventually and you probably would still lose less than your risk unit. We all know that risk is one of the most primary and one of the most important aspects of trading. And so that's why it's so key to know what our risk is. And then if you all know, Hawaiian Airlines got bought out by Alaskan Airlines, right? Got very, very lucky. I hadn't been involved in merger and acquisition forever, but it gapped up to $13 after I was in 20,000 shares with a stop at a dollar. And it was, you know, a cool little win. So that's the absolute zero method. And again, a way that you can still over time just be increasing your stop. But really what I did was I also took absolute zero. And then the, and then the, the one that is this right here, which is buy on a weekly or a bi weekly or monthly basis. This one team, you guys all know, is a very common form of investing. But I use this exact formula where I just take some of my income, whatever my income is coming from, and I use it to buy some Bitcoin in the queues. Just no matter the price, I don't even look at the price. It's on an automatic purchase. It's just an automatic repeat. Most of us are far past this, so I'm not going to stay too long on this slide. But this is one of those methods where you can tell all of your friends who might not have made it to the spot that we might be at with our wealth. Hey, this is a great, great, great way to do it. Time in the market is better than timing the market when it comes to long term wealth. So you've also heard something called the DRIP program, most likely dividend reinvestment program. That means that every time the stock pays a dividend, it Buys more stock, which eventually pays more dividend, which buys more stock, which pays more dividend. Again, really, really great programs for your kids, your grandkids, your nieces, your nephews. Make sure they are set up in something like this, but definitely make sure that anyone that you want to have extreme wealth is just repeat buying something over a period of time. This is one that we're all very familiar with, so we're not going to spend a bunch of time on it. Now here's the one that I like a lot, which is where I'm buying a small amount of shares on down days. That's important, down days. How do I know it's a down day? Well, it's a red day. So it's either at the opening of the market midday, like right now, the market's currently open, so we can go look at some examples of down days. Or literally right towards the close of the market, what I started doing on Square, I think for those of you who've been trailed me for a little bit know this, but I was accumulating some positions in Square, Square ran up and I sold the stock on Square and I made some money. Cool. And so I just started doing it again. But literally I was buying five shares a day, but only on down days. And so these purple arrows represent each down day. And I was just slowly doing this over time. What this does for some of you, my friends, is it will help your anxiety about missing trades or not buying at the exact right time, or like, oh man, I missed it. This is the bottom. I'm so stupid. I can't believe I didn't get into anything. I have seen that even five shares will help you calm your fomo. So I'm saying five shares. This was an actual right. So I was spending like somewhere between $400 and $300, you know, every down day from my cash account, just simply buying some shares of Square and it ended up coming out about a hundred. And then here's the cool part. Once I'm in a position and if I start to see things start to move, couldn't I add to that position at that point and then start having a legit stop in place? Because if I'm only buying five shares at a time on a down day team, you could probably see that there's no real reason to have a stop loss. It's not like a, it's not a large position by any means. Would everyone agree? It was like, I'm just buying like a couple hundred bucks worth, but once I'm over here. And Now I'm in 150 shares of Square. And then it posts a little bit of a double bottom and starts to close by the neckline. Then I can sling in a decent, a decent size, actually throw a real risk unit on it, put a stop loss on the whole position right here and then hope that it pops. Which is, which is what happened because again, this particular strategy, it is oftentimes for me just out of boredom. I'm there, I'm in front of the computer. I know the company, I use the company, I interact with the company. I'm familiar with what the company does. I know who the CEO is, I know how they make money, I use their product, blah, blah, blah. And I take some of my cash that's sitting in the account, I just slowly start legging into a position. And then if and when I can see any type of strength or any reason that it's going to bounce, I can really add a decent size and I'm in. The reason that this helps is because this is a picture perfect example of this. But there's tons of charts where I will do this and I'm only in 20 shares and then the stock just crushes higher. I'm like, whoa. But I didn't fully miss it. I don't feel like an absolute dodo bird because I'm at least, I'm at least, I'm in 20 shares and the stock goes up a hundred bucks. And I was like, all right, you know what? I just cool. Went up a hundred bucks. I had 20 shares, I made $2,000. That's not the end of the world. I'll sell it and I'll take that $2,000 and I'll go buy my wife something nice. But those three approaches, team, really, for stocks are very, very effective. Especially if you were. If you know, and you're doing a little bit of analysis on something that you want. So let's go look at a couple of examples really quick before we get to WW, let's go look at FedEx. And trust me, team, you will always have more opportunities than you have money. I'm go ahead and tell you that now, right? We all know that Joe's got a lot of money, but there's going to be more opportunity every day in the market than Joe has money. But it's okay. In fact, all of us, we're in the same boat. We could collectively pull our, our money together and have a couple hundred million and we're going to run out of money within a couple of weeks. Right. Of buying all the opportunities that are out there that we. There's too much. So when I pull up these charts, keep in mind these are some stocks either you have all asked for or someone has asked for in this group. It doesn't mean that you have to be in it or that I have to be in it. I do eventually plan on being in FedEx, because I think it's FedEx. I don't think it's going to go anywhere. But this is a good example of a stock that I'd probably start buying in small amounts of. Let's talk about the relatively reason, you know, obvious reasons, why, number one, it's $250 a share. It's like, that's what's up there. It's like a $20 stock where you could buy 20,000 shares, you know, and you, you have a $40,000 investment, you buy 20,000 shares of FedEx. Stuff's happening, right? You're, you're rolling deep, so you're going to have a lot more time to leg into a bigger company like this. So if I pop over here to the daily chart, wouldn't it make sense that right now we can visually see FedEx is having a down day? Right. So here, here it is. It's a down day, half a percent down. And if I wanted to buy 5 shares of FedEx today, would that make sense? Yes, it would. Right. Could I also do an absolute zero on FedEx and say, okay, all right, I'm going absolute zero this thing. I'm going to do a $2,000 risk unit. Sure. But again, you're not going to be buying that many shares at that point. You're still going to be buying 10. Or could you start pyramiding into FedEx? And the answer is yes, you can. And if you're using both the daily and the weekly, you'll notice that the weekly moving averages are down here and we're already on top of the daily. So that would probably make sense that you would have some, some purchases happening now and then some much larger purchases happening around that 220 area. And then we can zoom out to the monthly just to see what those look like. Right. Is, is there anywhere near the monthly? It's like, well, not really, but, you know, we get to 207. There's something there. Look at this beautiful bounce back in October of 2022 on FedEx. Good grief. Right. Really, really great example right here of both pyramiding or buying in small or doing an absolute zero that could have paid out you know, pretty well for you on FedEx. Any questions on FedEx or Apple before we get into some of the stocks that you all asked for and WhatsApp, which is perfect. It's exactly what I want you all to do. Ask all the questions. Okay, so let's go check out Jeremy.
I got a quick question for you.
Give me, brother.
So I understand the pyramid scheme. Not scheme, but pyramid structure of everything.
Yep.
I was thinking of another investment type of thing where they use the pyramid and that's right. Anyways, so you're, you're anticipating a loss for a certain amount of time.
Correct.
When you're pyramiding.
Correct.
And earlier? Well, our first meeting that we had, we all agreed that the market correction is coming. So would it make sense to still do a pyramid if you know a major correction is coming? Because you're going to sit longer for a rebound.
Unless you know the future? Yeah, yeah. I mean, that's the thing is like, again, you can still make money on the downside, right? You can day trade, you can have some swing trade positions, but you still, if, if a correction's happening, which we're getting right now, right, we're, we're getting that pullback that we talked about on Monday. And we did this right, right before market open on Monday. I mean, it was the most obvious thing in the world that we're going to get a pullback. And that's exactly what we're experiencing right now, the last three days. Right. Every single day this year so far has been a down day. But my prognosis, my thesis is the overall trend is still bullish. So the question is, how far does the pullback happen? I mean, to, to ultimately answer your question, right, how far does the pullback happen and when does it bounce higher? And those are two questions that no one's really ever going to know the answer to. So if it does this and then this and you have a pyramid that starts there, you never get anything at all. If you think it's going to pull back 40, 50, 60%.
And yesterday, good, when you guys were talking about Chewy, I did a. I thought you guys were shorting it, so I shorted it and then I got out of it once I realized that you guys were all going long and you doing a pyramid. But if I would have held on, you know, a lot of money on it.
Yeah, you could have. Right, exactly. And so it's all about time frames, right? It's all about time frames because if you're day trading, it doesn't matter What I think ever about a long term position, a day trade is just a day traders. Like I'm, I'm trying to get out and make 20 cents or 30 cents or whatever on any position, any time. That's just pure fast capital. And so I can definitely have a long bias on literally anything Tesla, Nvidia, Walmart and still make money on a short, on a day trade or, or a quick swing trade, something, something over the course of two or three days. A good example would be Home Depot. John Alonzo and Joe and a few others, they posted a really great short swing trade on Home Depot where they're looking to make some money over the next, let's just say two, three weeks as Home Depot goes lower. Right. But we don't anticipate Home Depot to go down forever. Maybe, maybe Home Depot just goes down for the next couple weeks, three, four weeks. But as Home Depot gets down into 300, you know, you probably would want to start buying it most likely. Because if we zoom out on a little bit of a bigger time horizon, right. This is the weekly chart. We can see that Home Depot was trade down to 270 and traded back up to 320 numerous, numerous times. So we can be bearish now to then go bullish at some point. But you're absolutely right man, you can still make money either direction. You just. That's why time frames are extremely important. Knowing what, what time frame you're looking at, knowing what time frame you want to trade. Yep. Cool. Yes, yes, yes.
I, I have another question. Another question.
Yes ma'.
Am.
Can you explain again, how do we see a down day?
Sure. Probably a few different ways. I mean the easiest way I, when you pull up trading view on the right hand side here, you'll see the number and if the number is red, it's a down day. And if the number is green is an update. If you like more visual. What's that?
Like if I'm, you know, if I stay there for half an hour, that number is going to change.
Absolutely.
How do I know it's a day, a down day? Like you said something about maybe seeing it at the very beginning of the day or at the very end of the day.
Yep, so exactly. So let's say that you're in front of the computer and it's, you know, market open and the stock that you want to buy is down. That would be a time to buy because it's down. If that was your strategy, like if you want to like hey, I want to buy this. When the stock is down. Right. Buy at a discount. If it's red, that's a good time to buy. So for example, Walmart today, you can look at it right here and see Walmart's down 0.98 cents. As we're looking at this exact moment in time now, the market is still open for another 30 minutes. So if we bought it, it could do whatever it wants to do. But we know right now for a fact, guaranteed that Walmart is a down day right now as we're looking at it. And so that's the really, the key is as you're looking at something you want to be able to determine is it up or is it down presently while, while your eyes are on it, that's what matters. You don't have to sit there and watch. Sit there and watch it.
All done.
Does that help?
True.
Does that help?
True.
Thanks. Thanks.
Sure. Sure. I'm gonna meet you, Brian. I think there's a little bit of reverb, bro. Is that a beard? You look great, dog. Grow it out, my man. Grow it out. Ow.
Hey, I do have a question. When you get a chance, hit me. First of all, sorry for being late. Second of all, Tilray, did you see my, my chart that I posted in there for Tilray?
I did, I did.
I'd like to get your feedback on Pyramid into it. Bullish.
So let's go look at the monthly chart because really like you said, it's just all about earnings. I would, I would do an absolute zero on Tilray. So any Pyramid that you use, use zero as your bottom number. Bottom number.
Okay.
And, and here's my. The only reason I'm saying that is because this, this company, it, it looks, it looks the exact opposite that you want things to look like. But the risk is to the up to the downside, right? There's, there's no real risk to the downside. You're only looking at $2.29 and 29 cents.
Right?
Yeah. So for me this is either a blend of absolute zero. So having to stop at zero and then I probably would would be buying this one. Also on down days, any down day after earnings, we'll see what earnings does. If earnings for you, Brian, opens above 260, that's best case scenario. I wouldn't imagine it does. It could and we'll definitely keep an eye on it for you. So if it gaps up, that'll be a really, really strong move because again, there's no risk to the downside. You can only go down another $2.30.
So one of the reasons that it drew my attention is because the FDA and federal agencies right now are starting to restructure their classification of marijuana. And if they decriminalize it or put it into a municipal medicinal use category, I do believe that the marijuana stocks.
Are going to go up.
So I just, I'm trying to, to play that news along with the technicals on it.
Yep. No, makes sense, man. Yeah, thanks for the heads up. Yep. No, makes sense, man. Yeah, thanks for the heads up. I would say on this one, I, I even if that does happen, because right now it's, I mean, keep in mind, it's legal in many states already in the U.S. already in the U.S. right, right. Like, you can go buy, like, you go to Vegas, Colorado, Washington. Like, you can just walk into a store and just buy edibles at any time you want, probably a few other ones. And I think that hype has already happened, so. And this company loses money selling weed, which I fig. I feel like has to be difficult. Like, I'm no professional weed salesman, but, you know, that's like the tried and true, like, you should be able to make. If you can't make money selling weed, bro, like, what are you doing? So don't expect it to go to the moon. If you do buy a bunch, you have a good absolute zero and you get a good, you know, 100, 200% pop on it. That's probably the best you're going to get.
All right, buddy. Thank you.
My pleasure. My pleasure, dude. I'll keep it on it for you. All right, ww so let's go look at WW International. This was an interesting one. Very, very interesting. So, consumer services, let's start with the, the monthly chart and just really zoom out and just talk about where it is. And I think. Was it Nancy? Were you the one that asked for this one? Yeah, that was me. Okay, perfect. So pause there. I'm going to pick on someone. Who am I going to pick on? Eric? Eric, you here?
I'm here, but I'm in a car. I'm looking at this on my phone. Pick on me next time. All right?
Yep, you're fair. All right, let's go with John Alonzo. So, Lonzi, based on this particular chart, knowing the four ways we talked about kind of dollar cost averaging into position so far for Monday and today, what would you do and why? Gary? Yep, I can hear you. Yeah, so for me on this one, I'd probably be doing an absolute zero on this. Why is that? I mean, I could Dollar cost average in with a pyramid. But I think I'd just be willing to take my 10k, plop it in here and then slowly move my stop up on this one. So we're looking at this one right now. I agree with Juan, John. I mean, stocks at, you know, $6, 6, let's call it 7. It's been down here before. And you also the question of I have a hard time telling the difference between accumulation and distribution. Yeah, that one was on the ExxonMobil. But it would work on this one too, huh? Precisely. So this is accumulation because it's lower and that's really the only difference. Distribution is always high and accumulation is always low. And the only distinction and the difference, and I know it sounds obvious, but during an accumulation phase you want to buy on down days and sell on up days. And during a distribution phase you want to buy on down days and selling updates also. So you still want to buy as low as possible on both situations, both accumulation and distribution phases. We have tons and tons of good bullish volume down here. So for me, this is probably a. Something that I would either, yes, absolute zero in or just buy over a period of time, like small shares on down days. And today is definitely a down day.
Right.
It's down 10% presently and it's out of support right now. So my thought is, I agree with John. I'm either going to do an absolute zero, so I'm in all of it. So if it bounces, fantastic. Now again, could you do a swing trade where you're like, all right, well I'm just going to buy, you know, 20,000 shares here and put a stop right there. Absolutely. You can still do that. That's just a, that's just a swing trade though, right? You know, if you're trying to build into anything long term or have anything really, really large position on something, ultimately you can do it however you want. But this is a great example of a bunch of bear candles in a row. A great example of a down day on a stock that's out of support. So this is, this is definitely gonna be a good time to buy. And so the question just becomes for you or for anyone else who wants to play this one, how and implementing any and all those things that we discuss is, is good. Usually stocks that are in power down trends like this one, but I'm like, man, is this thing even going to bounce? Is it going to go to zero? Are they going to go bankrupt? I'm usually using one of those three methods that I talked about today where I'm buying small amounts every down day, I'm just buying on weekly repeats, hoping that it goes higher or I just do an absolute zero.
Okay, thank you.
My pleasure. All right, so going into Exxon now, Exxon is perfect. Eric remembers Exxon because he played a great trade on Exxon when we were together in person. But check this out. So we're going to start with our monthly chart first on Exxon. I think we all kind of know most likely what Exxon looks like on a monthly chart. It's just going to slowly be going up. Let me click the long term averages on Exxon and we'll get these pulled up. So I bet the hundred. Yeah, there it is right there. So again, we can already tell at this exact moment in time if Exxon got back down to 7750. What a great spot to buy dividend paying, boring blue chip stock. 7750 for anyone here who's like, man, I'd love to nab some Exxon. There you go. That's the monthly. Then we look at the weekly and check it out. Wouldn't you know it, we're right here, we're right there on Exxon, right on top of the 100 simple on a weekly chart. So when answer was asking about earlier is this is a distribution phase because we're at all time highs, right? This, this price up here on Exxon is the highest price that's ever been. It's never been higher in human history. So we know this is a distribution phase. And then of course, how do we use that for our relevancy? Well, distribution phases are supposed to distribute, which means people will be selling their shares. So if the stock bounces back up to here, I'm trying to draw it up. So if Exxon bounces back up to this resistance, we already know that it's distributed four times previously. So we have to do something there. We have to, right? We either sell some of our shares, we sell a call option, we get into a collar, we trim and trail. We have to do something. But this would be the spot to kind of start picking up some Exxon pretty much right where we're at. And then if we zoom into a daily chart, so here's the daily time frame, we got a really good volume bar here on that day, which was Friday the 15th. We have some support, maybe a little bit of a double bottom trying to form. So this is again a really, really good example of just knowing the three instances, either pyramid or buying a random amount every Single week or day or month or just buying a small dollar amount on down days or a share amount Tarot. Can you. Are you able to see that this today presently right now in Exxon's a down day?
Yep.
Perfect. Beautiful, beautiful. So again, just an example now we'll talk about the whole swing trades and double bottoms and entries and all that stuff later. But for the quality of a position for me, again, oftentimes I'm looking for swing trades and day trades just so that I'm not ultimately doing nothing. Because I absolutely could find three or four companies and those companies are, can be on this list right here and just slowly pile into those companies over a long enough period of time. And I know if I do with enough size and enough activity, I'm going to crush it. Right. I mean taking Nvidia for example, that's the one that we've been talking about and we're going to continue to talk about for a bit. But like I know if I buy Nvidia on down days enough over a period of time, I'm. It's going to work out even if it, I mean again, it's a little bit more of an expensive stock. So I'm either going to be using the pyramid strategy or the buy some on down day strategy to just build a core position onto Nvidia and then I can play it however I want to at that stage if I want to make money. If Nvidia went from here to here and then it does this to kind of talk about what Scott and Jeff were chatting about on Monday and today. If I expect this to happen for whatever particular reason, then I could just day trade some of this little action in here. Just capitalize on some of the money. Maybe I make $3,000 day trading and then I could take that $3,000 and do what with it? Buy some shares. Exactly right. Start lagging into those positions.
Just another quick question about the up or down days.
Yes, ma'.
Am. Like do you strictly do it by the black versus white, like where they open and close? Because like just looking at that previous day on, on Nvidia like it's Washington.
That's a good question.
But is down ended up down, right?
Such a good question. Yes. Even if it's a white candle, if it closed below the close of yesterday, it's still gonna be a down day. I'll still buy it on that day.
Okay.
Mm, fantastic question. So I'll give you a few examples and then I'm gonna, I'll show you your homework. You guys Are gonna love your homework so much. But when you have a bull candle that closes lower than yesterday. Let's just look at this, this particular chart right here. I'll point out to a few of them. Won't point to all of them, but I'll show you all a few. Bull candle that closed lower than the prior day. That one's probably too close to judge, but maybe. Definitely this one. Definitely this one. This one.
Closes lower than the previous day's close.
Huh?
Closes lower than the previous day's close. Yep. What you'll notice is, and this is something that we're going to get to later, I promise. But it eventually goes up, right? Like there's not a whole lot of instances where it's like, man, it just goes straight down. In fact, the majority of the time, three days later, it's higher. Just random fun fact. It doesn't mean that it can only go higher from there. It just simply means that oftentimes it's going to go up after three days on the stock. And if it doesn't, it's going to go down hard. Like this little move right here. Other, other than this. And again, I'd have to look at this one. Technically this was an update. So that one doesn't even count. All right, so that one, that one actually was an update as a. So you see, you can hover over it. You guys see how you can hover over. And you can actually see on the top of the screen here if it was a positive or negative day. But right here was a negative day. It was a white candle. But we actually did go higher. If you had bought on that day, even if it was by a couple pennies, we did go up a little bit. And obviously right here, bull candle down day that went higher, down to the 100. And then we went back and fully filled that gap and then rotated and then very nice little hammer. But anyway, yeah, cool little strategy. So here's some pieces of your homework and we're going to kind of review some more stocks. Just kind of look at through what's going on. I'm sure all of you know that this exists, but just in case you don't, if I back trade Nvidia. Let's pop back over into here. What I would really like you all to play with is this little guy in trading view right here. Now, you might not have noticed it before, but this is a paper trading function that allows you to put in the quantity of how many shares you're either buying or selling. And I want you to practice legging into shares on down days of whatever company you want, on whatever time frame you want. I don't care. Daily chart, weekly chart can be any year you want. But I would love it if you can have a video, Even if it's 2 minute video with your cell phone. It could be a video on Zoom, it could be a video on WhatsApp, it could be a video on QuickTime Player. I would love for you to throw a video in of any long, of any period of time, any length, any length of time. I'll watch any of them. Even if it's two hours, I'll watch it. If you post a video in our WhatsApp group of you back trading and using this quantity tab, I'll give you an example. So let's say I do a quantity of a hundred. Okay, so here's what it looks like. So this right here was a down day. So I'm going to video was $200. I'll buy 10. Okay, so I'm gonna buy a little bit there. Go forward the next day, another down day, Bye. Next day it's up. And you actually see right here where it says +98 USD, that's the your account balance. That makes sense. So as you're going forward in time, it actually shows you what that would be doing for your account. Does that make sense, team? Now it's only at the close of the day, so you're not able to like see how it's moving throughout the day. So you can't do limit sales or limit buys. So it's not ultimately the most incredible future in the world. But you can only play the close. You can only see. You can either buy the close or exit the close of the next candle. So for example, if I flatten this trade and just get out of everything, I will get out of my 20 shares at the close of that candle. And so then you'll be able to notice if I hover over, right? It says buy. Buy 10 shares at 285.78, which was the close. Buy 10 shares at 283.40, which was the close. And I sold them on that day. So you're able to actually see those arrows. Isn't that a cool little feature? Know if you guys have done that before? But it's really, really nifty to practice because I spend a couple of hours on this. And again, unfortunately you're not able to set like limits or anything yet, like stop limits or limit buys. But it is fun for you to see how to leg into certain positions. So let's just go do a random one together. I'm gonna go do Goldman Sachs, and I want Jason pick a year for me. Jason.
2014.
I love that dude. Let's go nice and far back. Okay. Oh, why is it not letting me select this calendar? What am I doing wrong? Okay, 2014. 0505. So I'll click go to. And it'll probably take a second because it looks like my computer's just a little, little draggy McDraggerton right now. All right, so I'm just going to go all the way to the present candle here. So I can't really see much past that. So we're back in 2014. We've had a really good move, and I'm just going to do some super fast analysis on the daily chart, and I'll use the kind of moving averages to kind of help me determine what I want to do. All right, and I'll just show you guys a cool little nifty way of using that back trading tool to kind of just show you what your P and L would look like. Because I think a lot of people, they kind of under. Underestimate the power of just being in a position over a period of time, even with smaller size. Because again, back, Scott, back to what you said. Like, what if it keeps. What if it keeps going down? Like, it might so, you know, buy it lower. You know, it doesn't have to be all in at once on one day. And then, of course, if it goes higher, you can sell it, lock in some profits. All right, so we know we want this to come down. Had a pretty decent little move. Bunch of bull candles. It's a really, really nice. I mean, this is just a. Gosh, man, you guys are gonna flip in, lose your mind in three weeks when you start talking about this stuff. This is just such a perfect trade right there. It's so, so gorgeous. Nice little move higher. We, we want a pullback for sure. But I'm gonna. I'm gonna do, let's say 165 stocks. I'm gonna do five shares. Six shares. Five shares. Five shares. Every down day. Every single down day. And so if you want to calculate it, that's 200, so 176 times $5,000,000 a day right at it. So what this means is let's say you have an account of, I don't know, you have $100,000. We'll kind of keep a running tally. I have 100 grand. And every time I buy. It's essentially subtract 900 bucks. All right, so the next day, that's a down day, right? You come in right towards the end of the market. Right. We bought. So every time I see a little blue arrow, I'll subtract 900 in just a second. Okay, next candle. Another down day. I'll buy. Okay, next candle. Update. Won't do anything. Another down day. 0.23%. So I'll buy. Update. A little hard to tell, but there you go. This is technically a down candle with an update. Right. 0. 1 3% up. Next candle. Nice down day. Right? 1.6% is. And bye. Next candle. Bye. All right, so we're getting a pullback to where we wanted. Again, not a huge position. 1, 2, 3, 4, 5. So so far, we have only spent 900 times five. So 4,500 bucks of our 100,000 total position. But you're able to see what happened to the stock, right? That's one of the big takeaways from this type of price action, is you're able to see what's happening, and you're not really getting that FOMO because you're like, well, at least I'm buying. But you're not. If it runs to the moon, you're in it. You're still in it. And if it does pull back, it's like, well, I'm not getting in a huge, huge, huge amount. So you're not terrified. No one's. No one's freaking out about this number. And that's kind of the point. That's the point. Okay, next candle. Some update. That's cool. Another down day. So we buy. We get into the long term moving averages. We'll buy a lot more. That was a down day right here. So we buy. Beautiful update. Gorgeous update. Another update. That's actually a down day. That's a bull candle. So we buy. Update. Update. Down day. Buy. And we're profitable. So we've had to do. We're in 45 shares over the course of that. Takes a month. Took a month to get back to profitable, and we're just buying shares on down days. Now, obviously, you're looking at a stock that's in a bullish trend and all the things. And you can extrapolate a lot of information here, but I just want you to practice this because what you're going to end up doing, and this is what I did, is you're going to end up getting a little bit more aggressive with it just so you can see bigger numbers and Having a really fun time. And that's coming. Don't worry, we'll do that together. But you start back trading like this, you're like, let me do 10,000 shares. I mean, why in the world do you want to do that? So your brain can start normalizing the swings of your PNL now before it's real, right? Because, Scott, Jeff, don't you guys want to have $100,000 down day? Yeah, you do, right? Because if you have $100,000 down there, that means your update is right. You can have, you have a big account. You're going to be able to see some swings. As wild as this sounds, If I pop over to Meta now, I know that this is like, yeah, no, no worries. New. So I'm like, duh. But during the drop of Facebook that happened in 2022, Mark Zuckerberg, his net worth went down over a hundred billion, billion. Now you're like, so what? Who cares? He's a billionaire. Guys, it's the same thing with you, okay? If you're worth a million and you lose 600,000 on now, it's on paper, okay? There were paper losses. He didn't, he didn't lock them in. But it's the same thing. But what's fantastic about that to me is if we can start normalizing some of this stuff now and our brains can start going, okay, I'm down $400,000 on this trade. But here's why I'm not afraid about it. Here's why I'm not panicked. Of course, there's the account balance and the margin, the risk. And you're very familiar with all that. You know what that is. You know it's going to be ahead of time. Yes, yes to all of that. I'm not going to turn you guys into generic gamblers. But what we're going to do over the next six months is we're going to continue to build out plans that, you know, strategies systems, where you're like, this is how I'm going to approach this. If the stock is this amount of dollars to this amount of dollars, I'm going to do this. If it's in a really, really strong uptrend, and I love the company, I know exactly what the company does. And I'm all about being in this company. I want to get into a pyramid. Or if the stock's in a power downtrend like Meta right around this time frame, it's just going lower and lower and lower. How do I play a stock like that? Because, I mean, Scott, Jeff, if you guys back trade Meta during this, like, time frame right here, I promise it's going to keep going lower than you think it's going to go. But if you never get in, it's all the way back to where it is now. Yeah, of course. Hit me, brother.
So, obviously, your risk that we've been taught a lot, at what point, if you were all in on this right now, and you said, I'm gonna start doing $5 in every down day, what. At what point on other trades would you have to adjust your risk factor because you're eating up? So.
So no, good question. I mean, let's say you started. Let's go here. Let's say you do some analysis, and right here you start buying 10 shares on every down day and comes full circle. You're. You're over here. You're like, man, I've been buying. I've been buying 10 shares. I got 300 shares of it. And like, I'm running out of money. I don't want to buy anymore. Like, if you're like, all right, I'm all in. I have no money left. I can't buy anything else here. You can leave it alone, because at that point, the stocks don't either go to zero or again, as you know, you can protect it, protect your position with puts, right, buying stock insurance, expecting the stock to go lower. If it goes lower, then you still have that protection and your ability to protect the downside. Because every single trade before you get into it, every single trade, every investment, Bitcoin to Apple, you want to know your max loss. And that's why we talk about risk so early in class. I mean, class one and class two, right? Risk and pyramiding is so that you can have an approach for what is your ultimate risk. And even if I'm doing the $5 per day, I'm still going to know my ultimate risk, whatever my ultimate investment is. So if I say I don't mind owning $20,000 worth of Meta and I'm going to buy $5 everything or 5 shares every single down day. And you, over the course of January 12th to May 22nd, you spent all of your money on the down days, and you had to hold through a lot of pain right here, you're really happy right now. So it just all comes down to risk, man, because we never know. I. I've had many, many dreams at night that I woke up in a cold sweat. I was like, oh, my gosh. I had a dream that the stock market dropped 35 one in one day, like, well, you know, what's crazy? That has happened before and it can happen again. And it probably will. Well, will at some point. It's a guarantee. It's happened, you know, five other times in the past. It will happen again. And so just imagine every single stock that you own drops 35% in a day, and you lose almost half your net worth overnight. You're going to want to know what the risk is. You're going to want to know that you are okay with it. You're going to know the numbers. And so that's why it's really, really important to just be aware of your ultimate risk exposure. So at the end of the day, man, most of my positions, most of the things I get into, they're going to be absolute zero initially until it starts to bounce. If it's in a power downtrend, if it's just I can't find the bottom, it's absolute zero until it starts showing some strength. And then when it starts to show some strength, when it breaks through moving averages or something like that, I can start adding to it. And so hopefully over the next six months, we're going to get some of those examples. Let's go back and look at some of our list of stocks. So here's Carvana. And if we remember correctly, we talked about Carvana a lot in depth as well. So Carvana is probably right, the top of your pyramid as well. This is the one, Brian, that you and I were talking about at breakfast. So we, we finally started pulling back. We knew we would. Right. It wasn't a. Is it going to. But there it is. So there's our Carvana. So it's probably right at the top of your pyramid, most likely, if you're playing the pyramid on it. If you're doing buying some money on down days. Right. Right now it's a down day. You got 34 seconds left before market close. Chewy. Same thing. So we're playing a little bit of a double bottom on Chewy. That's what this little area is. So again, you're never going to buy the exact bottom. Go ahead.
I was just gonna say my, my final pyramid entry point was hit or I'm sorry, my middle. My middle entry point hit was on Chewy.
Was it?
All right. Right on. Right on. Rivian. Still one I'm keeping an eye on. For me, talking about everything that we're discussing today, this is one that I'm most likely going to buy on down days because it's a pretty cheap Stock. Right. It's not ultimately that pricey, so it's not going to cost a lot of money. And I'm going to know my ultimate risk on it, which is going to be 20 grand. So, you know, but I'll buy a couple shares and then see if there's ever. If the same thing ever turns into some type of strength, momentum play. So Rivian, at this exact price, I am buying shares on down days with a $20,000 ultimate risk with an absolute zero. So I know. All right, cool. Here's the amount, most amount of money I'm ever going to spend on Rivian. $20,000. And I'm gonna start buying 5 to 10 shares on down days on Rivian until it starts showing me a little bit more strength. And again, the reason I'm doing that is because they are increasing revenue, they are increasing sales. These trucks are out on the road, and this Stock was worth $140 a share two years ago. Now it's 20. So, you know, is. Is Tesla going to buy them out? Are they going to start pumping out some actual trucks? You know, we'll see. And then, of course, we got Tesla. Eric, what you end up doing on Tesla, did you sell and lock in a little bit of a gain? Now you're rebuying lower. What's.
I played Amazon today. I didn't play Tesla.
Oh, I mean, for like your swing account when we talked about on Monday.
Yeah. I didn't get in.
Okay.
Yeah, because I. I threw some money in, in some cash in the account and then I applied for a margin account. So I can't play anything short because the only thing I have in live is IRA funds.
You can't short those.
So I'm long until they approve my margin account, which hopefully is in a couple of days.
Right on, man, you're going to have a blast.
I got a question since I made it out of my car and into my office here. So when we're buying these down days, are we buying them only when the open is below the body of the previous candle or only when it's a bull candle? I missed that part. Can you run that?
Yeah, great question. And Joe asked that question almost the same way too. So it's a. It's a great clarification question. Essentially it is if the day is red, no matter the candle of the color. So, for example, right now on Tesla. Right? Right now. I mean, the market just closed two minutes ago, but right now we were down 0.22%. So you would have bought Tesla this day, this day, this day, this day, this day. So you would have bought it all five days just because it's a. It was a down day, all five days.
Okay, so it doesn't matter about the previous day or where the close was. We're just buying red candles any day that it's a bull or a bear.
Any bear day, not even a bear day. It could be a bull day, as long as it closes below the low of the prior day or it closes below the close of the prior day. So for example, this would be a good example right here, Eric. Right. This guy, that bull candle. So that bull candle closed lower than the close of the previous day. So that was a down day, even though it was a bull candle. So if you were buying down days on. On Tesla that day, you would have bought that day, that day, that day, that day and that day, and then nice little win.
Okay, thank you.
Yeah. So I look forward to seeing your homework and just playing with that back trading paper thing. Brian's gonna have a lot of fun with that. He's already great.
Bitcoin. I already did Bitcoin 2021. It was phenomenal to look at.
Yes. Yeah, it's so cool.
Coin that, that I played 10 Bitcoin in 2021 on that and it was phenomenal to see those numbers.
So cool. So cool. But yeah, that's what it is right there, team. So if you want to go in there and pop in and adjust this accordingly, you know, play with those numbers. I'm not saying you have to do anything big or small right now. There will be a time in the future where we'll have some big back trades just so we can get comfortable seeing six figure swings, even though it doesn't have to happen until whatever, five years from now. Comfortable in both directions, Right. Imagine your account goes up $300,000 tomorrow. How are you going to feel? Well, we're all going to feel awesome, of course, but imagine you're like, that's cool, that's good. But I mean, it'll go up another 300,000 tomorrow, so I might as well keep holding. So we're going to bake that into our brain, into our subconscious, but the best way to do it is to see it first. Right? We got to see it here before it happens in reality. Right? Awesome. So you got your homework. We all know that we're going to be back on Monday. I'll keep you posted with any of the trades that you were all posting in Slack that we're just watching and keeping track of together. And thanks for being here, folks. You're amazing. Have a great weekend. Love you too much. And I'll see you on Monday. Thank you.
Bye.