Ultra Wealth March 11th, 2024

Recorded live trading class led by Jerremy Newsome (Ultra Wealth, Mar 11, 2024) teaching Elliott Wave application to intraday and larger-timeframe trading. Participants (Scott, Eric, Joe, Sue, Jeff, Jason/Jeremy) practice drawing wave counts across multiple stocks (Square, NTRA, AMD, MongoDB, ELF, Rivian, Google, Intel, Apple, Nvidia), discuss using pre-market data, gaps, moving averages, support/resistance, and option strategies (puts/calls) to implement plans. Emphasis: use bigger-timeframe counts to guide intraday entries (find wave 3s/4s), practice pyramiding buys, set clear invalidation levels, and iterate counts as new price action appears.
Chapters
Love it, love it. Super glad that we're here. Hope you all had a great weekend. Eric, thanks for already crushing the book, man. That's amazing. That's crazy, dude. I think you got it. Like.
Yes.
It was really good.
I enjoyed it a lot.
Yeah, thanks.
Yeah.
Heck yeah. That makes me happy to hear. All right, well, here we go. Intraday wave counts and major trend trades. Applying wave counts to intraday trading. And the good news is we're just going to briefly cover this as we continue to practice. There'll be a lot of screen shares today, I'm sure, but just keep that in mind that I know that our ultimate mission is not to day trade every single day in this class is all. But at the same point there will be some traders that day trade. I just want to let them know that this can be applied to that time frame and all that kind of good stuff. Now this is the fun one that we're going to be working on a little bit today and we've talked about this during the gap, you know the gap section about intraday and studying the intraday charts. But you can use pre market data in your wave counts and I do, I do spend time doing that and obviously I spend tons of time on the daily chart. Right. Trying to analyze the daily chart because again, ultimately at some level, once you spend whatever an hour or two max on your, your wave counts and your bigger time frame, once, once you spend that amount of time, then you, you're going to kind of have a general idea of what, what you're doing, like what, what direction it is, what trend, that type of thing. And then obviously you can find everything that kind of supplements and supports those, those decisions. So the one hour chart with extended hours on and off. Since it doesn't cost anything to switch between time frames, I usually will.
Right.
So I'll switch back and forth since, you know, why not. And then I will determine my wave count which simply helps me get a better, you know, better pricing. If I'm buying or selling something, it usually if I get a good wave count helps me sell higher or buy lower. So let's see. Yeah, Bearded Jeremy, let's see if the bearded Jeremy. Do you remember this day, that analysis from that day that we did together.
Sorry, I just listen in the background, just taking care of something right now.
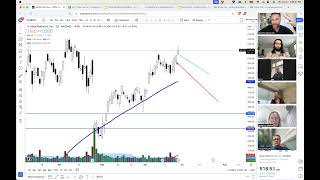
Okay. Yep, you got it. So this particular day, for some of you who might remember, we, we analyzed this day and this, this gap hadn't happened yet. The, the gap down. So this is one that we were analyzing before Market opened. This was one of our Monday sessions right here. And the black arrow and the analysis was like, wow, this is a really good gap. You know, it's a really good hammer. Do you guys remember us inverting the chart and we kind of flipped it so that it looked like a hammer and talking about just playing that day trade. And then you can see here on the screen how we had a really, really nice retest gap. Right. Bull candle gapping up. So the bull candle gapping up, that was just one of those, like, oh, yeah, a bunch of people are going to be selling, you know, locking in profit. And then to continue to add all the analysis that we've done in the past, you had the hundred simple on the weekly. Sorry. Actually that was the monthly 100 simple on a monthly up there acting as a resistance. So we had resistance up here. You had a retest gap. So you had definitely a lot of reasons or I would say rationale for the overall trade to kind of continue down a little bit. So from that daily chart analysis, expecting to get a little bit of a bear move. If I pop into a smaller time frame, you want to say hey to everybody. Say hey to everybody.
Hi, Jason. Hey, Jason.
So if we're looking at this particular move and the drawings I have here, this was really kind of just my perspective of before the market opened. Right. And. And to practice this. And we're going to do some of that today. So make sure you guys go ahead and log into your trading views, because that's going to be. That's going to be happening for us here. Just a second. But remember, notice that if we look at this. 1, 2, 3, 4, 5. This was look. Looking at and including the pre market and then the gap that happened or the move that occurred afterwards, this would have been again, either an abc, which means it can't go any lower, and if it's an abc, then it's like, okay, cool, then it has to go higher. Right. But if the daily chart says, hey, dude, this is probably not going to go higher, it looks like it could continue lower, then we would be expecting what type of wave after this. What would that. What would the. The next expected wave be?
Elliot Wave 5.
Yep, precisely. Precisely. So it's like, okay, so we got the drawing, we got the pattern. We're like, all right, it needs. If it's an abc, then it needs to bounce, and if not, then it won't and we'll be ready to rock and roll. So if we go forward on that particular day now, we do One more slide. This is the opening. So if I go to the left.
You're on mute.
Oh, I'm muted. Sorry. I don't know what, what that was. Sorry about that. Okay, so we've gone to the hourly. So here we are on the hourly. We have the hourly chart. We're drawing our wave count. We got the 1, 2, 3, 4, 5. We got a resistance. Now we're expecting 1, 2, 3, and then it should go higher. And if it doesn't go higher. Right, meaning if it goes lower, then we can be expecting to get that other wave series completed. So if it doesn't start to go higher at all, we get this move, then we could expect this. And then as Scott said, the Elliott wave five on the downside. So then we're going to go into a five minute chart. And this was the breakdown. So here's your, here's your pre market low. So that was the, the wave C of, you know, boom, boom, boom was the hourly chart. So again we needed to start bouncing. So we didn't. We, we made a new low. And then again just back to our normal standard day to day operations. You have tons of bear candles in a row, a lot of strong bear candles. And then you get a nice strong bull candle, which again we all know that strong bull candles are a really good support. This is a level. And let's just say again hypothetically that we're like, okay, this still could be a big A, a big B and all this could be a ac. So it needs to go higher. And then of course, if it doesn't. So if we can find that level, that line in the sand, we're like, all right, this is a good spot. This is where it should continue. And we ended up breaking down really nicely on that move. So who can, who wants to share their screen and pull up the 26th of February for me on a 5 minute chart and just show me what square did after that bull candle and how you could have taken that for a day trade. All right, Ms. Joe, I'm gonna volunteer you. You're volunteered.
Okay. Okay, sorry, which chart was that again?
Square.
But I'll get it, I'll get it done here after this. Square sq. On the 5 minute.
Yep, 26th of February.
26Th of February. Okay, Just getting everything set up here. Right now. It's not popping up. The share thing. Oh, there it is. Okay. Sorry about that delay. So you wanted me to go back to show the 26th or like. Yeah, from the beginning.
Yep, exactly. You can just zoom in right There, that's perfect.
Okay.
Yeah, zoom into this price action. Because it was really a cool day to watch. Right. Because we had, you know, if we had done the pre market analysis and we're expecting a wave lower, and then we have. A really, really strong bull candle that came in.
Too much.
Perfect. There we go. Lovely, lovely, lovely. All right. So based on that bull candle that came in, that really, really strong support being the bottom of what should have been a wave completion, where at that point we shouldn't have gone any lower. How would you. Or how could you have traded it looking at what you see here in front of you.
Okay, so you're talking about this chart. This one here.
Huh?
Okay, so if it should have gone. Shouldn't have gone lower, then we're looking at a new wave count then. So it would be. So we could look at that bounce. It probably would have been looking at, like, it going down more to the one. Oops, wrong place. Okay, I would have to fix that. No, hold on. Yes. We shouldn't have gone any lower. Then we'd be looking at it doing a new wave count, potentially the 1, 2, 3, 4, 5.
There you go. Yep. Beautiful. So you're saying that you can use pre market in your wave counts because it counts. Right? Like so. Like when you're doing. When you're doing smaller time frames, all of this can count. Because then if. If that was Joe's completed wave count based on that day, and she's looking at the chart. Go. Yeah, this makes sense. I can see this. Let's see if you can draw a wave. A 5 wave inside of your wave 3.
To make sure it's long enough.
Yep. All right, perfect. So if this is the wave five based on just this drawing that you have, you're like, okay, cool. I. Based on all the evidence that I can see in front of me, we made a new wave down. I have a wave structure. I did the hourly chart over here. Right. On a bigger time frame. I found a bottoming pattern that it should be of. Should have bottom. It didn't bottom. It broke lower. Create my wave structure. What should we get over here?
Abc at minimum.
Yep, exactly. Yeah, at minimum. And kind of see, in pre market, we kind of did that too a little bit.
Yeah. So this would kind of be the new bottom that it shouldn't break then.
Precisely. And then if you start going forward into the future. So press. Just pl. Press play on the downside, we'll start to see kind of how square begins to hold this level in the pre market. And as Joe mentioned, like that, that level five, we really shouldn't be breaking that, and we didn't. So that next session we hold really nicely and go ahead and press pause for me and see if you can use the analysis we have on the screen currently to come up with a wave count of where we now.
Okay, I've pressed pause, but it's just kind of slow. It's not way behind.
I guess mine does that too. I don't know why it does that.
Yeah, sometimes it does that. I'm not sure how much longer it's going to go for because it was slow. But wave count based on this. Okay, so we've done A, B, C, I guess kind of cheating a little bit here, I guess. Just consolidating for a long time here, Just waiting for it to go up on the three, I guess I would think.
This looks like the best way to draw your wave counts is like, let's.
Just wait for it as it's live.
Yeah, exactly.
Okay, that's fun to stop. Oh, no, it hasn't stopped. Now on to the next day.
Yeah, that's the pre market. So you're expecting it to go higher and then dip and then go dip a little bit and then go higher again. Because if that's a four and that's a five, right, you have to have some type of dip. All right, so let's see if Joe nails it.
Oh, did I hit something there?
I don't know what that is.
Oh, what did I hit? Okay, I'm sorry. I don't know what it's doing here.
Me neither. That's weird.
I hit something wrong for sure.
Okay, all good. No worries. All good. But yes, so that it did. It did end up going higher. And so that was, that was. That's a good practice for all of you to. To realize that when you're doing your wave counts, this stuff does apply to intraday charts, right? That's essentially it. It's like as you start building out your plan for the day or for the day ahead or for your next thought process, you can use previous day's trading ranges, zooming out big picture, then zooming in smaller picture and finding. Finding some really good wave counts. So now what I want us to do is I'll share my screen really fast and then we're going to have Jason Chase come to the. Come to the deck and we're going to go analyze some of the trades that. And we've done some wave counts on these already, but we're going to go Analyze some of the wave counts on some of the positions that we've already traded together and or some people have already been in and just see where those counts were when we got into those trades. So I'll have Jason, I'll have you do nt for us. So pull up this bad boy on the daily chart and let's start reviewing and looking at the wave count that existed there. Then Eric, we'll come to you and we'll have you do database. Afterwards. All right? You there, chase? You might not be around. What about you, Eric? Do you want NTRA.
Foreign?
I'm on vacation and I just found out my. My laptop crashed and that's why I grabbed my daughter's here and she doesn't have trading view on it. So I'm using her tool book and I can watch the video but I can't do any charting because my. My lab and that's what the problem I had on Saturday. I thought what's wrong with the Internet where I was at? And it turns out to be my laptop. It won't hold the connection. So I'm just a viewer today.
All good, dude. Me and you both. I need a new computer as well. Mine's been really weird also. I'm gonna go pop in and get another one some point today.
All good discount because clearly I need something too.
Yeah, yeah, let's all go get a bulk discount.
I'm hoping I'm gonna buy an Apple and I'm hoping for a good bounce on it if I trigger some kind of profit.
That's right. That's right. I like that plan. All right, we'll have Scott, Scott.
We'Re.
Gonna have you do NTRA for us. Show us how computers work, Scott.
Oh, it's smoking.
Hold.
There's smoke coming out of it. See it? Yeah. Beautiful. So do this on the daily chart for us. All right, sweet. So I'll have you start really just I guess anywhere start for us at the top of that. The, the move that happened up here. Do right here. So start there and work your way all the way to where we are present day. Okay.
Probably the start that up there. I would start here. My first count.
I like it. All right, beautiful. And so after that, what happens?
Get to change the direction.
Yep.
So let's say it kind of goes like this and pulls back. I'm kind of counting this all as a three.
Okay.
Well, I guess I could end here because that's higher than the last one.
Yep.
Be a small pullback and then that would be a five.
Okay. Beautiful. Now, so here's what's cool. So let's go walk through the two pieces that you just did, because there's. There's two things here that I love, love, love. First of all, obviously, you nailed this one. Now, that's easy. I mean, a blind toad could have seen that wave count. And then you got this absolute banger over here. Now, what's cool about this trade is previously, as you were kind of drawing it and thinking through, you're like, well, this could be. All of this could be a wave three. And then you also have this as a way five, which both of them could be correct. Right? Now, in both situations, if this. If there's a wave three or a wave five, and both of those, you're expecting some type of what, some type of retracement. Yeah. Yep. Some type of pullback, which means that you wouldn't be a buyer up here. And then. And then, as you're noticing, also, you have a retest gap. Right. Bull candle gapping up. So then you're like, okay, cool. I have really three reasons or three rationales why I believe that I should be waiting for some level of a pullback before I get in again. Now, the other cool part about this is this was a trade that we took. So we. We ended up playing this little hammer and this little bounce off this trend line and. And kind of rode this little move up here on ntra, you guys remember, which is. And we got out before earnings, just because I don't really think about this particular company. But to look at this, what's interesting about it, I think, is the ultimate trade that we played was the pullback of a wave 3 based on what Scott's drawing is. And that is really kind of the ultimate goal, is I just go and look for wave fours. Sorry. I go look for wave threes essentially everywhere. Up or down, doesn't matter. And then once I find a really good wave three, I know that I can start connecting the puzzle pieces. And if I find a good wave three, I can go connect the puzzle pieces. I can go get my drawings in. I can then go play a trade based off of what I see. So the two wave threes that you have on the screen, in order for these to be accurate, we got to go find a five count inside those. So let's go see if you can go do a five count inside both those wave threes.
Start on this one first. I'm going to zoom in a little bit.
Okay, perfect.
Sorry.
My brain's gonna think, say, one.
It'S not gonna work.
Can you do an abc, though?
No, you can do it. It's just five. Five is just really small. So go up. So that would be that little.
This is all down. But that would be a retest.
Correct. So you could do 1, 2, 3, 4, 5. So 3 is still small on that wave, but it's not the smallest. Right. Your wave five would be the smallest in that particular account.
Gotcha.
So then try. Because it's gonna be kind of the same with this one. So try this one over here.
This would be a 1.
There you go. Yep. Beautiful.
3.
This would kind of be like a 4. 4 would kind of be, like, stretched out like that, I would say.
Yep.
Five.
There you go. Nice.
Is it all right if the four bounces higher than your three at points, though?
Yeah, good question. Kind of yes and kind of no. But I mean, because really, this. This would have probably been the top of the three here. So the three gun there, that would have been the four, and that would have been the five. Yeah, there you go. Yeah, perfect. I'm glad. Glad you asked that question. But, yeah, that would have been. That would have been the case. Now, the cool part is, again, as you know, it's all fractal anyway, because if this is the three, this is a four, and they can all be a big four. That means that this would have been a five, which was. Which means an ABC would have existed somewhere inside this little. Little fractal right there. All right, sweet. Do this exact same thing for AMD for us, Scott, because you're crushing it. Let's go see.
Just tougher to see when it goes kind of like, you know, not straight up, straight down move, so to speak. Oh, yeah.
Yeah, for sure. Totally.
Amd you said, right?
Yep.
Where do you want me to start? In june?
Sure. Yeah, I'll see june.
Okay.
1.
It's a choppy little guy.
Nice.
I would end it here, but.
Could.
Go to there, too, Tom.
Yep.
I'd like to end it there because it bounces off a good moving average.
Okay, that's fine. So if we end it there, then.
I think you would get an ABC retest.
Yep. Which means that you have to be able to fit a five count inside this little drop right there for that count to be correct. And if you can, then. Perfect.
Zoom in.
All right. Beautiful, Beautiful. So at what point? Because. Because the next wave, you would expect to be an ABC because it's, you know, it's the end of a wave five. So that means that we would expect An ABC move. At what point does it have to no longer be an ABC and it has to start forming a 1, 2, 3, 4, 5.
Once it breaks. Oh, I thought I had to break four. So if it breaks peak four, then it's going higher.
Bingo. Yep. Bingo. And so once it. Once it takes out this level and. And definitely, definitely, if you know this one for sure. Yeah. Because really, you have. You have multiple fours here. Right. You got that four, you got that four, and then you got that high. So if. If AMD takes out those prices, all of which essentially happens in the same time, right around here, is where you have to abandon the ABC campaign, expecting it to go lower. And then you have to draw. What. What would your count be from there?
Five count.
All right, let's see it.
Let's see it.
Perfect.
Let's go.
Gonna be kind of funky, I think.
Boom. You got it, bro. Great job.
So I'm still looking to add to my position at AMD, but I'm. As you're saying I'm at a 5. So we're expecting big pullbacks now.
Yep. But.
Fives could last long too, right? That.
Oh, yeah.
Five could last another month or so.
Absolutely. So let's have fun with it. So inside your wave five draw what wave. What the wave structure looks like to you.
Two. That's a three. This is a four, and we're going into a five.
Okay, beautiful. So wave fours, are they usually big or small?
They vary. So.
True, true, true, true.
But they usually to the size of A3. I've noticed they're usually about half the size of a three.
Yep, exactly. So what you're drawing here is as you start working towards the future of a wave count. I love this count inside your five, the one, two. I would agree totally. This is a three, and I would say four would look something like that. And then five will look like this, which means you take this five and this five and just push them up into the future up until like, 240 or 2:55 or something like that. So essentially expecting a little bit of a. Yeah, there you go. A little bit of a bigger dip. Right. To come in. There you go. And then you take the other five that you have and stretch it out into the future as well. Yep. Perfect. So what the wave count is saying is you're saying, okay, it looks to me like we're in a bullish trend. It looks like we are in a wave 4 pullback. I want to add to my AMD position. And based on the drawing that you Have. Do you see a price where you could add to your AMD shares?
Ultimately, I would if it ever got back down below 200, close to this big bull candle or to the bottom. My four. Yeah. Somewhere in here.
Yep.
I think this, I think this is going to hold.
Yeah, it probably will. But that's. But again that this is the practice where if you're doing this analysis in real time, this is how you use it for. Well, for real time. Right. And you. Okay, cool. I've done my homework. I've did the analysis, I did the charting. I have the drawing. This is what I see. And this makes a lot of sense by the way to me. And it looks accurate. So if, if I really. If we really cared, then the next puzzle piece would go in and make sure we can find a wave count inside of that wave three and then find. We have to probably zoom into an hourly chart to find a wave 5 inside of this wave 3. But if all those are correct and we can find a wave counts out all of them, then we're like, all right, well this is our perspective. Now could our respective be wrong? The answer is obviously it's always possible. However, this fits all the rules and this tells us there's like, okay, cool, I want to buy amd. But based on the drawing, since I want to add to my position, I want to add around the bottom of this wave four. And I bet you'll be blown away. Two weeks or three weeks or four weeks from now when you see how this works out on amd. So there you go. Well done, man. All right, Jeff.
Hey, real quick, Jeremy.
Yep.
I was messing around with Trade view. Is there a big difference between the pro versions and what we're. You I'm using is just like a mid grade level.
No.
So just stick what I have.
Yeah, yeah, stick what you got. This is. This is gonna be perfectly fine. All right. Beautiful. All right, Jeff, let's see if you can do. Let's see if you can do Mongo database.
I missed most of the class because I was driving. So what, you're just doing the wave counts?
Yeah. Yep.
What, what chart Daily.
Let's start with a weekly. All over the place. Nice. Beautiful.
Then you can get.
Freeze the shortest though, so it doesn't work right.
Correct.
Really?
That.
Nice job. Yep. Nice job.
And then we have a, a possible ABC here. Maybe it's going to keep going lower though. So you could have some kind of ABC here.
Yep, absolutely. So that's the weekly. Now let's pop into the daily. Great. Job. So. Yeah, I totally agree with you. Like, so this. This little level that we're getting right here. So we're getting the pullback. You got your strong support around 354. We have it as on the weekly. You said, okay, cool. Weekly chart. Looks to me like this will be a. A potential abc, right? Big. A big abc, something like that. Now, this is. This is where it's gonna get fun. So if. If we have that ABC, we can also see a 1, 2, 3, 4, 5 possibility inside of this. You know, on the daily chart, we can see this wave structure, which I would assume kind of means that we could potentially start to see a little bit of a bounce down here of some kind. Right.
Answer a quick question.
Yep.
When he was doing the weekly chart, it was all bare candles going down. I understand it looked. Some of them would go higher. It wasn't a straight line down. And as you dive in deeper, it shows, you know, it being fracked with bulls and. And bears. Would you still count that as an abc, though? Because it was all bears going down on a weekly.
Hey, good question. Good question. I would say you can, but I agree with you. I agree with you, Scott. Like you're probably saying yourself, well, shouldn't we get some type of buying that comes in? And I. I would agree. So imagine if you have that perspective, and on the daily chart, you see this type of pattern, you're like, man, I didn't see any buying candles at all on the weekly chart for an abc. So I would assume that we get something like this. And then what would you expect if we get that forming a bull candle on the weekly, you would then expect something like this. Right. So if the green line would be a bull candle on the weekly chart, which would be your B wave, then your C wave would. Would tell you that likely lower is where we go into a decent little support area. And then since today's topic is intraday wave counts, pop into an hourly chart for me and we'll leave. Yeah. Extent. We'll turn that. Extend hours on and tell me what you see down there, Jeff.
See where down here? Well, I see it. It's about where it was at when it closed.
And what.
What have we done down here?
Oh, there's a. There's a big. There's a reversal.
Yep, yep. So we got a reversal.
You got. You got a strong support there, which is what I drew. That line there, huh?
Precisely. Precisely.
Is that where the big gap candle was, too? So I was looking at the daily, and I see this big this big gap, actually, it kind of all lines up. Would you consider that a very strong support because it gapped up and it's a big volume candle. So if it goes below this, would you assume the trend's going to continue down if it closes below this, or do you think it's going to play around here for a little bit because it's such a strong support?
So probably both. But I think ultimately the. Where you have. Where it says strong support, that line, based on this gap right here, I think that's probably the more relevant one at that stage, which says to me that the. The likelihood of us going down to here and then here is yeah, pretty strong. And kind of to what Scott said on his. In his wave count is he's expecting something a little bit more like this because he just didn't feel like there was a big enough B wave on the weekly chart. That's kind of his expectation. And then if we draw our. Based on this wave on the daily chart, if we're drawing it, we could see that it does look like there should be some type of B wave on the weekly, which would be wave four on the daily, which would tell us that we should get a wave five down. Right. 1, 2, 3, 4, 5. Which takes us into 354. And then again if we go back into the hourly chart, which again, now we're just. We're just playing with this wave counts because it's so easy for us. We can actually see that we've already gone down to 354 pre market, which would be the end of that wave five that we're. That we're talking about. And then you have an A, B, C1, And what would come after that? Two big three. And then precisely, really big three. So we could start looking at. Based on all the time frames that we've gone through. Right? Weekly, daily, hourly. And we start to just see and practice this stuff because again, we still have tons, tons more time to practice. So don't worry, team. But as you start to build these cases into it, you're like, wait a minute. I can start kind of getting a general idea of how I want to day trade Mongo database. The answer is yes, because if you zoom in a little bit closer to this price action, Jeff. Beautiful. So we can kind of look at these candles. And we go, all right, here's these candles. Here's some good support. I think this is a. The end of a wave 5 on the. Let's call it the hourly or the daily. We got a Retracement abc, which is very clear. All of this looks like a one, but we haven't really had a two yet. So we're going to expect some type of pop lower or some type of bounce to be the two. And then if we take out the low of that two, either today or Tuesday or Wednesday, you could short Mongo database and you could short it into 350 pretty easily. And mathematically that's going to be around $30 a share because we're. We're at 380 right now. Make sense team. How cool is. I think that's the coolest thing ever. It's so fun. So fun. All right, would anyone else like to review charts or ask questions or review trade setups or do some wave counts? Sue, I really liked your. Your Mongo database account because your Mongo database account was pretty close to what they just. They just said, right? It was almost the same thing.
Yeah, I just. Between that red and the purple one, it's like one of them went straight up. Let me see. Where did I put that?
Yeah, go ahead and share your screen for us.
Where are you guys? I put you down here.
Okay.
Look at our girl sue just mapping out Mongo from day one.
Yeah, well.
But yes, stay. Stay at this level and keep zooming in for us. Perfect, perfect, perfect. Okay, so here's what's nifty now. A whole different person, whole different wave count is saying what? Scott, she's saying the same thing that you said.
Yeah. Mango's going down.
The Mongo could go lower. Yep. The Mango could go lower. And that you expect some type of B wave to come in and. Or like some type of retracement ultimately. And then have one more push a little bit lower and she has it maybe going down to 300 ish. And then again from there, we could easily just turn around and go back higher. But that's why. That's why you want to buy low, sell high. You know, if you're doing these wave counts and whatever we're practicing, like we. We sold a good portion of our mongo here, right? Five. I mean, like literally five. Whatever. It was 521. 516. So I like discount on the monthly. I kind of feel like you nailed it, personally. So all this says to me is if this is your analysis, you have two choices. You can either look for a short or. Or. Or I should say look for. Look for a long and then look for a short. Or don't play the long at all and just look for the short, or don't do that at all and only look for the long. But in July, not in, not in.
March, basically, set some alerts at some points and just wait.
Yeah, go into your. Go into your. Yeah, exactly. Go into your calendar, right? Put this, this chart in your calendar sometime in July and say, hey, has this, has this played out? And if Mongo is at 320 in mid July, what should you start doing?
I would start buying. And this gap here is the daily gap. I can't remember how far it goes down, but like 300 maybe.
It's possible, right?
Yeah, According to. According to this.
Yeah. And so again, to bring it home, team, when we're doing all this analysis, all this analysis is for you. And so what it allows you to do is go, okay, are the rules correct? Right. Did I, Did I do all the drawings? Right? All the things. If I did everything correct and all the rules look good after I've learned all this and I put in the time and energy to do all this on a pattern. If all that is accurate and I see what I see in front of me, I need to use that perspective. Because I'm not saying that this is the absolute account, because no one knows the future, but trading is every one of us coming up with a perspective. After we do the homework, after we study the charts, after we spend an hour or two in front of a chart doing all the things moving, averages, gaps, wave patterns. How fun would Mongo database be if it goes down into 300 in May or June and sue buys a bunch of shares and it goes all the way back up to 500?
We buy a lot of computers.
Yep, she could buy a lot of computers, which we all need, apparently. She's going to ship. She's going to ship all of us a computer.
There you go.
And so that just tells her that's like, okay, this is my perspective, this is my analysis. This is what I expect. This is what I'm going to do, and this is how I'm going to play it. And then it just comes down to if she wants to or not.
Because you can do that all day.
And not do anything. That's also okay.
Yeah, but what's the point? You know, that's the point of all of us, right? So if it really, if it breaks this point right here, this is a strong support. 323 definitely could go down to 296.
Yeah, yeah, yeah, you're absolutely right. But really, all this, I would say all this would be some type of buying zone. Right. That whole area. I probably wouldn't short it down there. And again, that now we're just talking just basic good old support resistance principles. Right. Like if we have, like, a demand zone. If all that's your demand zone, you don't want to short down in that demand zone. You want to be a net buyer where you're buying shares, or we're talking about some other strategies, even more next month. But we just kind of keep adding on the. The approach. Once we do the analysis, then we incorporate the market and the system, and then. Then just gets really fun.
Yeah.
Quick question.
Yep.
I like how sue went back into the beginning of time on it, but if you have a stock that's been around, well, this one's been around for a while too. But if you just see an all time high or an all time low, can you start your account from that period on and assume that it's a reversal, or do you have to go back. Should you go back another two cycles just to verify?
Good question. Up to you. I mean, you don't have to go from. From the beginning of time, for sure. For sure. You certainly can. But, yeah, if you see a previous low or previous high, and you can see that it's really made some shifts, you can just start your count from there.
Yep.
Great question. All right. I love it. Show us your elf chart, Because this is all Sue's been doing all weekend. Was just working.
Well, once I got the hang of it, it's like. This is fun. Oh, where's my elf chart? It's not on this one. Maybe in a different layout here, We'll look at Bitcoin 72.
Happy 72 day.
Yay.
You got some bitcoin, Sue.
A little bit here and there. Yup.
Dang, you're so rich. You just have so many assets everywhere.
Here or there and everywhere.
All of your assets keep going up in value.
Yeah. Alpha's just crazy. Okay, so. Oh, this is on the hourly. Why am I on the hourly?
Beautiful. All right, look at our girl. Crush it. Okay, so. So walk us through. Walk us through this wave. 4 to 5, from 165 to 220. At what point do you think you realistically, you could have known to buy that trade based on the wave count.
That you have right here at 4?
Yeah, but how would you have known?
Well, had I known the Elliott Wave better, I mean, I really do like the fours because they're easier for me to spot. It's like, when I see that, I'm like, yep, I'm Pretty darn sure that I have the right wave count. So, yeah, if I knew this was a 4, I would have definitely bought more down here before this big pop up to the five.
Yeah.
So now I'm waiting for C down here.
Yeah, totally. I love it. I love it. And what's fun about this drawing and the chart and the analysis that you did to me is it looks like you're nailing this B wave, which tells me that if I was looking to play this and I had some extra time, I'd probably be looking for a little bit of a retracement and then a short and expect some type of lower low. Right. Maybe just from a day trade perspective or just super quick, you know, I just want to do something or if. If I had a bunch of shares. Right. Could do a covered call or caller or something like that. But, yeah, absolutely. You start doing this analysis, and then the fun part is, ladies and gentlemen, after your C wave is over, and then you start practicing, what would your wave 1, 2, 3, 4, 5 look like? You can start drawing those out in the future, too, right?
Yeah.
And then stuff gets really silly because then you can start having lines, and I. You'll be amazed at how often it works. And it's not because you're getting lucky, necessarily. The more you practice it, the more you'll realize that all markets move in waves. They all. All of them do. They all move in waves. Every single one. And once you know it and you know how to see it and you know the rules that have to be in place in order for it to be accurate, and you bake in all of those rules for accuracy, what begins to happen? The answer is, ultimately, you start doing this enough and seeing it enough, you'll never be able to unsee it. And then you will literally be able to play on your trades ahead of time. It is spooky. Or if you're, you know, I maybe don't play in your head of time, maybe just wait longer. Right. Because imagine zoom out for me just a little bit. Missu. Imagine if sue does all this analysis about Elliott wave, you know, from here, and she gets to this wave five, and then she's able to see this rotrace retracement down, and then she sees it start to gap up, and she does this count, like, okay, this could be a 2, and she starts going long. It's like, could she have done that? And the answer is, absolutely. So that's what gets fun, is as we start doing more and more of our analysis, you'll just start to see how it's all perspective. Just like if every one of us were to buy a house In Oklahoma City, Oklahoma, that costs whatever, $120,000, and then we put a certain amount of money into it, and then to fix it up, right? And we put in new whatever, and then we fix up and then we sell it. Every one of us is going to put in different things, and everyone's going to put us at a different price, even if it's $5 different. That's just called the markets. That's just the way the markets work. We're all going to see things differently. The truth behind Elliott Wave is I want you to be able to see what's accurate and the way it works and then fit that within a parameter of rules. And once you have it fit within a parameter of rules, you're good to go. Go have fun.
Yeah. Gives you a lot more confidence. Like, just another one of layer of reasons to back up your theory.
Yes.
Yeah.
Yep.
First, have you ever seen a wave break?
Like, what do you mean? Like, do a wave count? Just like, oh, wow, I'm totally wrong on this.
Yeah. Like, some horrible news came out about the company or something. You were in a. And then all of a sudden, whatever.
Oh, yeah, dude, that's the best. That's a lot of fun. Because when that happens. So let's. I'll give you an example. So let's say. Let's say sue does this wave, and she sees this volume come in, and she's like, wow, usually big volume comes in a wave three, and she has it. She has it drawn on here that it's in a wave 3, and some type of crazy news is coming out. And overnight we're gapping down to here. The best part about that sky is you get to go, wait a minute. So I had a wave three. It's like, wait, okay, we, we. Well, wave four can't go lower than wave two, so I have to be doing something incorrectly here. So if that was the case, then you get to go, all right, well, is it possible that this is a 1, 2, 3, 4, 5, A, B. And now we're gapping down to the C wave, and we're going to go lower because all of that volume is trapped. And. And you kind of keep building from there. Because the answer is, if you're wrong and you're wrong horribly and you just do everything incorrectly, you'll start to see. And then if you start to see it, like, let's, let's take this count Right here. Let's say today elf gaps down, opens a little bit lower, and then just closes above this candle today. That would invalidate her account instantly because we have to go lower for this count to be correct. And so she'll know within a couple days if this count is correct or not. That's the best part. Because if we go higher. Go ahead.
Sorry.
Yeah, I was gonna say if we go higher than this B wave before going lower than this, than this A wave, then her counts off, and this is. It's even bigger than what she has imagined because then this is some type of sill wave five. And this is just a pullback inside that wave five. We're going to keep going.
Yeah, it could be. Oh, I see what you're saying. Yeah, like that.
Yeah, exactly. Keep taking it precisely. And that's the best part is like. Yeah, I see waves break all the time. I mean, that's. That's part of it. That's just what's fun. But if I'm wrong, I know where I'm wrong.
So making those. If. Then those. Yeah. If Assumptions.
Exactly. It also comes down to that.
Yeah.
Which is fine. Does that answer your question, champ? Yeah. Yeah.
So basically, if she's patient in the next couple days, she'll realize whether her charting was good or bad.
Yep, exactly.
Or small adjustments would need to be made.
Yep, exactly. Precisely. Do you have any. Any trades or charts or positions that you want us to review, Ms. Sue?
Apple was one. Where Apple goes. Oh, I didn't finish this one. See, I have Apple going lower.
You too, huh? You too.
Okay, that's good. Confirmation. Y. Yeah, I mean, I'm wanting to get in bigger position of Apple. So I'm like, this is down 154. I don't know. This might be wrong here, though. That's a little higher, right?
Correct. Correct. So it wouldn't be. Probably wouldn't be that exact. Exact count. But keep in mind, the top of your way 5 could just be brought over. But. But again, at that point, it's probably a little nomenclature if you know, like. So your wave five could be here when it makes that new high. And that means that this could all be the 1, 2, 3, 4, 5. And that means that this was the A, that's the B, this is the C. And again, kind of like we talked about on Apple and we. We did a really good wave count on that one recently. I think it was Thurs. Saturday. Yeah, we. We should be retesting these levels. Like, we should be pulling back into the lows of those prices and then going lower. That's what it looks like. Should be retesting this. Go back up into 176 and then going a little bit lower, and then, yeah, we can start buying a lot more Apple. Totally agree. Everyone should be buying tons of Apple on that nice big pullback, which then goes all the way back to month one. Right. How can we buy stocks as they're going lower? And we start getting into that pyramid work. Right, team? We start getting into the pyramid work and we start to kind of see and. And understand, like, oh, okay, this pyramid work that I'm doing here, I expect it to pull back a little bit more. Buy more as it goes lower and know your risk and know how to create your risk, know how to calculate your. All those. All those fun parts. That's. That's a week one of all this stuff. Since you got it pulled up. Let's go look at your Rivian just so that we can keep an eye on it on this one. So we had a gap down. I know your puts expire this Friday. Keep in mind, we have a nifty little double bottom coming in. A possible double bottom. And this candle that we got on Friday is a 10 EMA candle on Rivan. I thought they were going to announce the new truck during earnings, but they didn't. They waited for whatever reason.
Yep, that's the 10. Yeah. Look at that. So it may pop.
Yeah, exactly. It may. Right? So if it pulls back to 1168, that could be a spot to watch for a little bit of a double bottom. And if it closes above the high of that candle, then, you know, could go back up to 15, because this is the. This is the pivot. This is the spots as our Washington Rivian. So you got your put sale. Sorry, your put purchase and your call sale. You're just leaving them alone just to see what happens. Just as a reminder, on that blue line, which I know is your expiration date, if it closes below 15, which is your strike, you'll. You will auto sell your shares of Rivian just as a tiny reminder.
Which if it's still. I mean, it's probably going to be that way, but then I could just take that and buy more Rivian.
Yeah.
Yeah, because I think. I mean, summer's coming, so keep working us. Forget all the stuff that happened in the winter.
I'm thinking with the Chargers, it was a cold winter.
You're right.
Scott's not gonna forget, but, yeah, some people will. Love it.
Did you go over Google, Jeremy already when I was driving.
No, I haven't. So let's. Who do you want to do the wave count on? Google. Let's do Bearded Jam. Hit us with your Google thoughts, my dude. All right. The Wave Assassin.
This is interesting.
The.
So like, immediately just. That's a. That'd be a big one. Unless this was like, 1, 2, 3, 4, 5. And then, like, a correction in here, because I can see another wave starting down, like the 1, 2, 3, 4, 5.
Yeah, you can, but the gaps.
With a gap, it kind of like breaks the flow for me.
Right? Correct. Because in all, in order for that exact count to be accurate, you'd have to have. A 1, 2, 3, 4, 5 on the down, followed by an ABC on the up five count. Can only follow an ABC if it's a trend reversal. So which could. We could. I'm sure we could try to track it down, but yeah, if.
So this be like a one.
Yep. And then two. Okay, perfect. So now if we have it like that, we gotta count. We gotta get a five count inside the wave. Three.
Right.
All right, sweet. And your one is your one count. Starting here, the bottom of that.
All right.
Okay, got it. And then if we go to the left a little bit, that means that this needs to be an ABC, because we're starting 1, 2, 3, 4, 5 after it, which means that the one before it needs to be a 1, 2, 3, 4th, 5. So if you can make that fit, then I would call that count valid.
So you're saying this and abc.
No, just the line in red.
Oh, okay. Gotcha. And then, so this would be the five count. One, two. I'd say something.
Jeremy, while he's doing it. Can I ask you a question?
Of course.
So when I. I put a lot of time into the analysis of Google, and I went. So on the daily chart, is it wrong to go as far back as, like, February 27th on a daily chart, or is that. Is that too far to go? Because I noticed you guys are stopping at November. Like, is it all right to keep going back in time, or should you try to get it as close as possible?
Yeah. Oh, yeah. You want to. You want to go back in time to make sure that the rules fit you. You want to. There you go. You want to go a decent. Like, I, I. If you're spending time on it, you definitely want to go a decent amount. Because right now this is. Know we're in July. Give us one more second, we'll find out. So this is. This would be an abc then. All right. And then we'll. We'll compare the. We'll compare the two charts. All right. So, Jeff, did you have Google as. It's going to have one more thrust down before it goes higher?
No, I have the way I drew it. I drew it that I feel like it's basically there. I mean, of course, it could go down again, but I have within. I see. I drew mine a little different.
Okay, post your. Post yours on the WhatsApp.
All right, let me zoom in so it makes sense.
You.
You care more about the downside right now.
No, not necessarily. Let's just see whatever. Whatever you're drawing. Let's see where you're at.
It's gonna be hard to see because there's so much.
But yeah, we'll try to. Try to. And. Or you can also draw on Jeremy's chart.
Or if you want to share the screen too, that's fine.
I can.
Again, I could be wrong on this, but.
Let's see it. We'll see if it matches the rules.
Let me share my screen. Because I have sizable positions in Google right now, so I'm hoping I'm right. So I start 1, 2, 3, 4, 5 here, then an ABC down. So I started here, and I went 1, 2, 3, 4th, 5.
Yeah.
Five waves inside of that.
Yep.
I figured, all right, we're at the top of the five here. And then I found my five count down. So 1, 2, 3, 4, 5. And then I found five within that. So I'm thinking we're basically at the bottom and we're touching the 200. So I bought 100 shares here, and I bought 100 shares when it did break above this, but it did retract back down. So I'm hoping it doesn't go down more, but if it does, I'll just buy more at these support lines I drew.
Yeah, well, so I. I like, like both your accounts, I would agree. I mean, they're both accurate. The. The cool part about this little level is you're absolutely right. You have a very, very, very easy line in the sand. Because if. If this count, the 1, 2, 3, 4, 5, is correct and accurate, which it is. It's a. It's a valid count. Then if we go higher, great. But there's no reason for us to take out this level. And if we take out that level, you know that you're going to either the. Here's the. The best part. This would be an abc, which means that we would have. That you would have to draw a new 1, 2, 3, 4, 5. And it would probably ultimately take you down into your bottom of your pyramid, Right?
Yeah, yeah. I mean, ultimately, if it gets down to the 100 SMA weekly, you know, everyone's going to load up on Google at that point.
But, yeah, totally agree. And, and I like your, I like your pyramid. And, and again, that's the, the good news is we have, we have the level right here, right where we're at. For us to kind of know, it's like, all right, sweet. Jeremy's. Jeremy's has one more push lower so he has like this. And then his could start again doing an abc. So we'll find out probably this week. Dude.
So if it does this line, don't, don't freak out, panic. We think it's going to bounce around here somewhere. Just put, just double up. Like around here.
Well, yeah, because you have your, you have your Buy More at these, at these prices, right?
Yeah, Yep.
I, I, I would agree. I would not freak out. Especially since it's Google and it's only worth two and a half trillion dollars. Yeah, I wouldn't, I wouldn't panic on it too much. That's going to be a beautiful position. What do you think? Yeah, of course, man. What do you think, Jeremy?
I like how it's like what you're saying. If you're building a house or, you know, resell the house, everybody, you put things in different places. So it's just like the different perspectives.
Yeah, yeah. That's all it is because we can find our accounts. And so as, again, as long as your account follows within the rules, who knows what the mark is going to do? But the, but the part of it is if Jeff has his wave five ending and he's like, all right, cool, we're going to bounce and we should just go higher from here. Sweet. That might happen. Which means Jeremy would have to do some recalculations on his wave count and he'd have to start. But if it goes lower and it's the end of a wave five for Jeremy, then he knows Jeremy needs to start buying there. And then Jeff can start protecting his positions if he wants to, or expecting it to go lower and saying to himself, okay, cool, I want it to go lower. Therefore, I'm to buy at this lower price and start building my pyramid, start really scaling into that position. So I like the pyramid a lot, Jeff. It's a, it's a really beautiful one, man. Yep, it'll, it'll pay you well a couple months from now.
Scotty, did you say after A wave five count. You have to have an ABC for a correction. Or can you go into another 1, 2, 3, 4, 5.
Yeah, for, for correction, the ABC structure me pull it up really quick because.
Couple of my charts, I have a five count into a five count correction.
And, and that's, and that's perfectly reasonable. So like if you, if it just depends on where the five count goes, that's really, that's really the answer. Because if, if you have a five count inside of your ABC structure, right. Like it really just depends on the size. Ultimately every wave five should end with an abc. And the only way that it shouldn't is if it's a trend reversal and if the trend is reversing. So if you have a 1, 2, 3, 4, 5 and then you have a 1, 2, 3,. 4, 5, that means that this trend should be going bullish now. It should no longer be a bear, a bear trend. The trend should have reversed because then you wouldn't want to do a 1, 2, 3, 4, 5. On the downside because the trend is bullish now. So you should just be doing an ABC off of your bull five count. Because the five count, the red in this example would have reversed the purple downtrend. Good, that makes sense.
Has a 1, 2, 3, 4, 5 double on Google going up and coming down. Right? Is that what I remember seeing?
Yeah, correct.
And I have the same on, on intel, which is indicated.
Let me, let me see your intel chart. Let's see it. Intel.
I can't share right now. Somebody else.
Oh yeah, I got. Stop sharing.
Sorry.
Yeah, my bad.
Can you, can you sell a put and buy a put in the same platform will not allow you to do that. So can you do. You know, I want shares at this level, but I want to protect myself of my shares going down type deal on the same platform.
Yes you can.
Great question.
Yes you can just. They have to be a different strike price and, or different expiration. Okay, say that again.
Do what now?
I, I'll give you the example here in just a second on, on this particular chart. All right, so let's, let's do. So you have this abc perfect. Which means that somewhere in here had to be a wave five count up. Right? Which means that you got the, you got a correction. Wave trend continues. So now if your analysis is all right, I'm looking for a 1, 2, 3, 4, 5 wave count. That means that you're anticipating based on whatever rationale, weekly, monthly, whatever that this needs to be a trend reversal of the bull trend. So the Bull trend needs to start reversing down. And then after this wave five, you're going to get an abc. And then what would happen? You would need to expect exactly a continuation lower. And then if you didn't, that wave four, like we talked about in your AMD example, Scott, that wave four would then be the level at which it could not go higher. And if it did, you'd have to start flipping your perspective and change your ABC in two a 1, 2, 3, 4, 5.
Because I'm predicting that's going to go lower right now based on, again, I didn't go back in time. I went back, you know, a little bit, but I don't know if I go back farther because it's obviously new lows are being made and new highs are being made as you start going. So.
Yeah, totally. And so that, that's why the perspective is important, right? The bigger time frames, those weekly monthly charts. That's where if we start really analyzing. And I actually don't disagree with you ultimately, because the weekly chart, like if you look back in 2021, we're still lower than it was on intel, right? We were, we were much higher. So if you're like, I think this is it and we're going to start slowly petering lower, I could respect that because we, we are making lower highs in general, you know, so, which is weird.
Company and chip companies are going up right now.
But yeah, agreed. And it did go up a decent amount in 2023. And again, right now I, I agree with you. It's just, it's just kind of on the struggle bus, which tells me that I, I don't really ultimately dislike your, your wave count. So if it starts going lower and pulling into those prices, you're like, okay, well, here's, here's the drawing. Here's what I expect. At this bottom price here at wave five, you would then expect some type of ABC to come in and that ABC cannot take out the high of that wave four. And then once it's up in here, if you had some shares you wanted to sell, some covered calls to bring a little bit of premium just to get paid while you wait and, or buy some puts, which again, we're going to be talking all about options next month, then you can absolutely do that if you zoom in back into the daily chart. Scott, to answer your question and Jeff's question simultaneously, his question was can you buy puts and sell puts at the same time? Meaning he wants to potentially own more intel here at 40. So if you want to Own more of intel at 40, you would sell a put, right? But if you want to protect your shares on the downside and you want to buy a $44 put, you can do that. So if intel starts doing this and dropping lower, this is going up in value, right, Jeff? So that 44 put is going higher. And the $40 put, the reason you sold it is because you actually want to get share ownership. So if intel closed below 40, you would get put some shares, and then all is good in the world. You got your shares at 40. If both of these options have the exact same expiration date, the strategy of that is called a bear put spread, which is a debit spread, actually. And so if. If intel, let's just say, went all the way down to. To 30, your maximum profit on that spread would be the difference between these two numbers, because you'd have to be getting share ownership at 40, and then you can only sell the $44 put at, well, $44. So, long story. To answer your question, Jeff, the answer is, yes, you can do that. No problem. Own a put as it's going down, make money, and then have a different put sale at a different strike to get share ownership at that level. And, and for you, Scott, just kind of depends again, on how generally bearish you kind of feel or again, your perspective on Intel. Because I could look at this and go, all right, well, this is an A, this is a B. B, this is a C. We haven't broken that level yet. And this is just a really, really slow 1, 2, 3, 4, 5. It's just very slow and very ugly. Well, 5 wouldn't be that big. It would probably be like here, probably even at this.
I'm probably gonna exit.
Yeah, totally. And, or, and, or a perspective would be like, all right, well, I got the, you know, long term, the one hundreds here, the two hundreds here, right? Big bear candle down day. Overall, chips are bullish. The trend is bullish. Using that bear candle to sell some puts down here. That. So again, like, like Jeff said, if intel goes down, you get put some shares, and then you low your cost basis, and then until it goes higher or not. But gorgeous pullback. I like the count. I really like the fact that you noticed that we had a little bit of a pop recently. And again, let's say hypothetically, you did this count on Monday of last week, and you had that exact same drawing. And then we started having this pop. That would have been a spot where you could have either a exit your shares for a small profit and Got in later or B sold some calls against your shares, expecting it to go down. Right. So that's what's cool about the wave count is once you build it and once you have the perspective in place, then you're going to be able to operate your strategy within your stock, within the rules of the, the rules of the wave. And that's the part that I like a lot. Awesome job, family. Any other questions or anything that anybody wants to review or any trade subs anybody wants to review? Okay, cool. Well, if anyone does have any trades that pop up or any setups that pop up, let me know. We're back on our normal schedule, all things considered. I don't think there's going to be massive changes, but we should be good to go for Thursday. Anybody does end up coming out with a question between now and then, let me know. Your homework is just to practice smaller term wave counts. That's really it. So do your big, big, big wave counts are fine. You can continue practicing them on daily, weekly, monthly. But just like Scott with his intel and he has, you know, intel would just hit a wave 4. Now we're in a way 5. Since we're only one candle in, he should start doing his 1, 2, 3, 4, 5 on the wave 5 of intel going down and then would zoom in. And if Friday was the one, then today slash Tuesday would be the two up and then right. Wednesday, Thursday, Friday should be the three down on Intel. And if you start drawing those waves into the future, which is now what I want to see all of you do is start practicing. Okay, here's what I see and then here's what I would expect to happen after. And you can do it on the bigger time frames or a smaller time frame. A smaller time frame would just again essentially be going back to Sue's ELF chart that we all looked at today. She had the abc, so her expectation is that ELF should go a little bit lower over the next two weeks. So then if she starts zooming in and looking at intraday charts, 5 minute, 3 minute, 2 minute, 1 minute, 15 minute, hourly, whatever your perspective, she should be able to find some type of 1, 2, 3, 4, 5 wave structure on the downside that incorporates her C wave on L. Right. So that's why I won't start seeing you guys work on this week. Is just kind of continually projecting your trades. Easiest thing to do in the world. Pick a random ass day in the middle of absolute nowhere. Right? Goldman Sachs 2003. Go back in time and start your wave counts and start Practicing and drawing them into the future. Because when you start getting that good, it gets really spooky because remember, it all builds on each other. It's all fractal. So the monthly and the weekly, you're going to build a really good base from there. Then once you got your base and you can start zooming in smaller time frames, that's what we're going to be practicing a little bit on Thursday and then some next week is just kind of that continual, perpetual building stage as you get your really good foundation. Because as a reminder, next month, all we've been doing is these three months we're spending the time on. What does Jeremy spend all of his time on from a technical analysis standpoint? And then we get into the strategies. So we have everything. I'm studying everything that I'm looking at. Gaps, volume, moving averages and Elliot wave. I mean, that's it. I study those components. So all of January, all of February, all of March. And then I go, all right, now that I've made some money and. Or I have my analysis set, how am I going to implement the strategy? That's when we're going to talk about options. And then 247 markets.
We didn't look at Nvidia. We should have looked at that.
All right, Ms. Su, post your chart. Let's go see what you think on Nvidia.
Yeah, I got out of it, but I may be getting back in it. Where are you guys? Let's see. Share screen. Okay, I only have the daily. Daily chart up here.
That's okay.
But.
So one.
So we have two wave fives ending.
Yeah.
Okay, so after wave five ends, what happens? Perfect. So what should the next two or three days do we be doing on Nvidia?
They. Well, I guess they are going down here already. So that could be part of that.
Right?
There you go.
That's where I'm just not, you know, never sure, like, where to put these. Exactly. Is there a way to tell. That was one of my questions. Like what it's done in the past?
Yes, exactly. Yeah, a little bit about what's done in the past. But that's just going to come from experience. The more you do it, the more you'll see. Okay, yeah, yeah, you'll. You'll start kind of be able to time it a little bit better. But I really love that count. I love that drawing. Good job selling, locking in a profit. And then like you said, just rebuying lower.
Yep. Because you never know, you know, like when I would look at it, like, oh, Yep. Could have been a few more thousand dollars there, but it's going to go back down. So another opportunity.
That's right.
Okay.
Go get those opportunities, Champion.
Sounds good.
All right.
You're amazing family. I'll post the recording later and keep being incredible. Okay.
Bye, everybody.