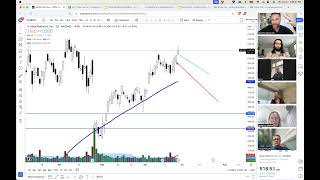
Ultra wealth MARKET TOPS Jan 15th, 2024

Jerremy Newsome leads a mentorship-style session on identifying market tops and bottoms by studying repeated reversal patterns across timeframes and asset classes. Key themes: the role of volume (especially end-of-day spikes), how high-volume candles create support/resistance, distinguishing bubbles vs hyperbolic extensions, how stock splits and reverse splits typically behave, and concrete candlestick patterns (shave top, hammer, tweezer tops, inside candles, double tops) that often precede major reversals. He illustrates patterns with historical examples (Dow Jones Great Depression, Enron, tulip mania) and modern tickers (Apple, Qualcomm, Coinbase, Bitcoin) and assigns students chart-marking homework (monthly/weekly/daily).
Chapters
Listening to it in my head too.
Yes, yes, yes, yes. Yeah. Saying it out loud like, hey, I'm gonna buy here, I'm gonna sell here. I'm gonna do this. Here's the reasons I'm doing it. It's, it's better and it's helpful. And what it does is it starts letting you know to just listen to yourself a little bit closer or maybe trust yourself a little bit more to, to be aware that you're the person in control. And if, if you say you're going to short somewhere and you don't, and the stock rolls over and goes into a support where you said you're going to buy and then you didn't. You know the problem that you're not the reason you're not making money, you're just not pulling the trigger when you say you're supposed to. Because who else is going to do it? I mean, I would love for Nancy to take all of our trades for us, but you know, it's, she can't do it for everybody. Guys, at some point we gotta, we gotta do it ourselves. Anyway. Saying all that to say great job. I know John. So he's gonna be late. But John Alonzo did a really, really good back trade on Micron technology using the, the spaces. And I think it's, it's just fun to see. Right? It's just really fun to see. Eric, great job on Roku. I, I, I felt like you studied that really well and that was, that was a beautiful beef. The back trade.
I, I do have one quick question.
Yes, sir.
Which I noticed because I watched your volume video. Why, if you look at the 3 minute chart on any day, most days, why is there so much volume at the close? Almost every time. But the price action doesn't reflect it. Not always.
Yeah, exactly. Not always. It sometimes does, but that's a great question. Really. At the very, very end of the day, just people closing their positions or you know, they're getting out of the day trade. And so the stock doesn't always have to move because again, you can have tons of volume and not a lot of movement. Or you can have a little volume and tons of movement. Because what has to be happening is let's say that there's one house for sale on your street and no one is buying it. So in one house though, how do they get someone to buy it?
Drop price.
Drop the price. So even if it's, that's just a volume of one. But if you get a bunch of houses on the street, then it's just more competitiveness, there's more volume there, there's more openness, trading. And so the, the, the more transactions that take place, even if they're the exact same volume, like, like the transaction amount, you can still get equal buyers and sellers to fulfill orders. The exact same price.
Okay, so when we're studying volume, like on Apple on Friday the 12th, the most volume of any time at any part of the day was the last three minutes. But that wasn't the biggest candle. So just interesting that maybe I consider this. You know, a lot of times you draw support or resistance line at one end of a massive high volume candle. But in this case, maybe you don't.
Yeah. And you know what's cool too is if I draw a line. Check this out. So if I draw a line at the close of, like you said, the biggest volume on Friday. One second, let me draw a line over here. So if I draw a line like that and we look at it to the left because there's no price action to the right, and then I'm showing you something that's going to blow your mind. Dude, your, your whole world's about to change.
All right.
If I draw this line just based on that one candle, because you said that's the most voluminous candle. If I zoom in to earlier in the day. Okay. That price was also the low of the second biggest volume candle of the day. Oh, wow. Which was the open. Yeah. Right. And then look at how well that price acts as a support resistance throughout the rest of the day. Okay. Yeah. Now here's the part that's going to blow your mind. That part's cool. That's like, oh, that's fine. That's interesting. Well, on Monday I can already let you know what, what needs to happen. That's what's easy about this. So on Monday again, I don't actively day trade Apple anymore because I'm bored with it. It doesn't, it doesn't move that much anymore. It's just become a little bit too splitty. Yeah. There's just too much liquidity and too much open shares available. But if, if Apple opens here on Monday. Sorry, not Monday. No, Tuesday. What will happen to Apple?
It's going to come back down to that line at some point during the day.
Bro. You can, you can write a book on it.
Okay.
Yep. And if it opens below that candle, what would happen?
It'll come back up to it.
So.
That'S interesting.
Yep. And you can just sit around and, and yeah, watch that on Tuesday morning. You'll see it.
Okay.
Awesome. Yeah. Ma'. Am. Thank you. Yep. And you can do that day by day. I mean, because. Because again, if you just studied the, the very, very beginning of the candles. Right. Like if you. As you're seeing them. Right, team, that's the key. So let's just go back in time really quick to here. And so let's say that this is all we see on Apple presently. And we're looking at them. This is all we notice. We go, wow, okay, this is a huge volume candle. Bullish. And you have a line. You draw your line here. You know, this is a really big volume candle. I think it's going to go bullish. We really shouldn't break below this price. And you look to go long at this location for the rest of the day or you're looking at this location as the rest of the day as an important level. I mean, look how beautiful that is. I know it's not a huge move on Apple anymore, But that's still 40, 50 cents to the upside. And as it comes down here, you're still able to catch something. Like, there's no way you would have gotten stopped out. I wouldn't believe buying at that price. And. And that's the other reason I don't love Apple anymore. Just because it doesn't have tons of movement. But check it, check it out again. 1, 2, 3, 4, 5, 6, 7, 8, 9, 10 bear candles in a row. And what's the biggest volume, guys? At the very bottom pivot. Yeah. After. After 10 bear candles in a row, you get a huge bear volume spike, which says what Exhaustion. You gotta. Joe. That's it. That's the exhaustion volume. That's the move. It's like, hey, that's. This is. It's gone too far. This is all the noobs getting in. That's really what exhaustion is. Exhaustion is just noobs getting into the trade. So they're short. They're shorting there, thinking it's going to go lower. And so you just have a huge influx of new orders. And then pop goes the weasel. And so you're able to. Down here, you're able to either not go bearish or you're going bullish. So it is. It's a fascinating study for sure. And what we're talking about this week, sorry in advance if this is your favorite week of class, because it might be. There's a. There's a good chance, because this is one of my favorite things to talk about ever. I just get totally amped by this stuff. Because again, just as a reminder, my ultimate goal is to make this the greatest mentorship of all time. But not only that, also taking everything that I've Learned in my 14ish years of trading and just boil it down into one comprehensive program. And so what we're talking about this week is we're studying market tops and market bottoms. Shoot. And here's the best part. I fully have been convinced by prior analysis that if I go back in time and analyze the great reversals of both top and the bottom, and I study them and analyze them, they're going to have a pattern. And that pattern is going to re. That pattern is going to repeat often. It doesn't matter if this is cryptocurrencies, if this is forex, if this is stocks and options. They are very, very normal, very repeatable patterns. So the goal of this module is mastering prior chart reversals and really studying the sentiment of those reversals this whole week. So what we're doing together as a team this week is we're going to go back in. It could be easy. All week long we're gonna be posting charts, we're gonna be studying other reversals, we're gon trading reversals. We're gonna be really just burning our brains into these patterns of what everything looks like. And we're going to be studying and looking for the bottom. Sorry, this week, both the top of the market and the bottom of the markets. And of course, ultimately the goal is to take this and see if we can find something to apply it to in real time. Right. So keep that in mind, folks, is like, I'm, I'm not here to just teach you everything that I know. That's part of one of a few things. But I also want to go, okay, cool. Based on what we're learning here in class, can we go make a bunch of money? And in one, in using one of the stuff that we're learning? Right. So just keep that in mind. I'm not just going to drill your brain and stuff. We want to also make a bunch of money off of it. And I'll be searching for as we're going through and practicing the charting. So go ahead and take a screenshot of this or write this down because you're all going to be studying either these charts or other ones that you want to find. That's perfectly fine. But these are the ones that I've all. I've spent cumulatively thousands of hours in my career studying these exact charts. And when I say studying, then what I mean, is looking at the daily chart, looking at the weekly chart, looking at the monthly chart, looking at them being in them, really practicing it. Okay, thank you. And what I'm about to show you is something that I. That you might not have done before. I'm sure some of you probably have. But if you haven't, again, about to blow your mind. I think this is the coolest thing ever, Jeff, and you're going to just absolutely love this. I'm going to go back and look at the Dow Jones during the Great Depression. Now, some of you have done this, but here's how you do it. You ready, Eric? Oh, boy, here comes dji. We're going to click on it. We're gonna go the weekly chart, and we're going to go back to 1928 and check out what we get on the weekly chart. You get flipping candles on the Dow Jones. Is this not the greatest thing in the world or what? I mean, this is what dreams are made out of. We get to back trade the Great Depression, Jeremy. Oh, my goodness, what a gift. Guys, 10 years ago, this cost me a thousand dollars to back trade the Great Depression. I had to buy the data and import it into a whole thing called trade Navigator. It was this whole process. We can just do it for free. Oh, my Lord. It's so cool. So just, just a remarkable, remarkable thing. I think that's just the coolest. What do you think, Scott? Is that wild or what?
Sorry, I had an employee in my office, so I couldn't. I wasn't listening.
You're good, man. To be able to go back to the Dow Jones and the Great Depression and be able to back trade its reversal.
Yeah, that's pretty cool.
Pretty sweet. So as we're studying, I mean, look at this. This, this is why people are like, why were people freaking out? Look at this, guys. The markets went down 90%. Can you imagine? The whole market's going down 90%. Oh, my Lord. I mean, just. You bought it. If you bought it for two years, it went lower. Doesn't matter what it was. It's crazy. 90%. All right, so these are some of the greatest reversals in my opinion, to really, really study. And we're going to go through a few of these together in this class today. But as we're, as we're doing that, I want to show you one. I haven't found the way to back trade this one yet, but there are a few charts of Enron, and I think we're all pretty familiar with Enron. But as we're looking at this. I've been asked, I've asked myself this a few times and ironically enough, this is one of the stocks that helped cause the dot com bubble. Right? Because once Enron started failing and everyone thought Enron was the greatest company in the world. Side homework, if anyone here is bored enough to do it. This week, Smartest Guys in the Room is a Netflix documentary about the Enron collapse. Pretty sure that's what it's called.
Make sure.
Yeah. Smallest Guys in the Room. So it's on Netflix. If anybody watches that. You'll get extra credit. But really cool, fun little, fun little thing, but this is the chart and one of my favorite quotes is a company's chart will fail well before the company does. And as you're looking at this chart, in any chart, You want to ask yourself, when would I have known that it's going to fail? Right. If I'm looking at it, when does this actually fail? So you have A, B, C, D, E, F, G, H, I, J. Let's go pick on Sue. So when you're looking this chart, sue, when, when are you looking at this, you're like, yeah, this thing has failed at this point. Or, or the stock has broken support. I definitely need to be getting out of this position.
Well, for sure. By. By D, you can see it's going way down. It's not tending to come back up. Can't see it really well, turn the light up on my camp or my computer and what is that, 2040? I guess if I was in it, I would definitely be getting really nervous. By D. And if I got down to F, I'd be freaking out.
Yeah, well, hey, I mean, but it's good to be. Even if you have to get out at F, you're. You're avoiding H.G. and I. Yeah. And so that's the thing about Enron is again, everyone thought it was like the greatest company in the world and it was, you know, impervious, essentially. But the truth is kind of like what, you know, sue is saying is by C, that's, that might be just a normal pullback, but this is one of the things get really serious. This D and E level is because, yes, you're able to draw a downward trend at this point and you have consistent lower highs. And by D and E, you've broken below all of your major moving averages. Your weekly chart, you know, your 200, your 100, you're probably below the 100 on a monthly at that point. And now that we know what we know on Charts and stuff. You know, we probably would have had some puts somewhere in here. Right here would have been a great time to get into some collars, right? Sell some calls, buy some puts. Definitely some level of protection. The support that comes in at C, same thing like you got to do something right there. You have to protect yourself and to some magnitude. And here's what's amazing. This sentiment right where we drop, really come up, come, come down and then come back up and retest. That's a very, very popular sentiment. When the stocks are going lower, you'll see the exact same thing here, right? The drop and then the, the come up is a little bit smaller, but there's the come, come up right there. And then it retests that same kind of downward trend line. And same old support, new resistance and fails. You guys see that, that happens very, very, very, very, very frequently. And so that's why I tell people all the time, it's like, don't worry about trying to catch the exact top of the market, right? Don't, you don't have to be this person. It's cool if you are, but even if you're that person, you're probably getting out here or here. You know, if you, if you, you short a stock there, you're not holding it to there. But if you are trying to make money as markets go down, there's plenty of money to be made in this little, this little pocket right there, right? That's a really, really good return. So just always be cognizant of or skeptical of the perma bears in the markets. The people who are always causing, you know, who is always anticipating the stock to go to zero. If you ever hear about those people or you read their reports or you see them come up on cnbc, you know the Dow Jones is going to go to zero. The US Dollar is losing all of its value. Buy my newsletter. It's only US$29. Those people are fraudulent. Sorry. It's called fear porn. They're just trying to scare you. They're, they're smart, they're on tv and they're just trying to scare you to get to buy their product. The reason I'm bringing that up is because you'll see the lot of people always trying to call the top of the market. Robert Kiyosaki, he's big for this, unfortunately, wrote a great book, the Help of Sharon Lechner. And he's, he's always trying to call the top of the markets. It's always going to go. It's always going to zero. And we can and will have another 90 pullback in the Dow Jones. It'll happen. It's just the Math. Could be 100 years from now, not 100 years from now. But it has to happen at some point. It's just the cycles, the way things go. And it can be, it doesn't have to be. Maybe it doesn't be 90%, but it can be pretty large again. Another big one was in 2000 and 2000. Dow Jones was 36% 2008, 2009 was 53%. Covid was 40%. This pullback that happened in 2023, a lot of people won't think it was that important, but it was. You know that's a 20 pullback in the Dow Jones. The ghost. That's pretty steep. And so now we're just going to make new all time highs again. We're going to pull next pullbacks on me bible and we're going to keep going. The Dow Jones right now is at 38,000. It will hit a hundred thousand probably in the next 10 years, maybe a little bit longer than that, but it'll triple, no problem. And in 50 to 60 years I'll be at a million. So just think through that. And here's the cool part. Think about it, right percentage wise, if it goes from a million and it loses 90%, it'll be at a hundred thousand. So isn't that wild to think about? Like everyone's gonna think the market's gonna go zero, but you know, it'll be at a hundred thousand. Just crazy. But that's the way stuff works. It's just math. All right, so this is a chart of Enron. I think all of you have heard of the tulip bubble. There's a few cool movies about this. But if you haven't, the tulip bubble happened in in dut Denmark in 1636 where the price of tulips went from $25 per bulb to $200 per bulb. And this is not a stock chart, but it's just a fun story. There's a bunch books, videos and even movies on the tula bubble. And just this is where some of the richest people in the world at the time lost all their money. So they were buying tulips and they were just trying to sell it. All right, so you buy a tulip and then like a week and a half later, I mean imagine this, right? November 12th to November 25th, two weeks, two quadruples in value. So there's a lot of money to be made and then just over the course of four or five months, it went to zero. So a bunch of people lost their wealth. A lot of, a lot of really, really great historical texts and videos and all kind of stuff on two level. All right, So I also like to call. There's, there's, in my opinion, family. There's two really interesting distinctions. There's bubbles and then there's hyperbolic extension of price action. This is my term. I haven't felt anyone else to ever explain it this way, but my belief is that bubbles pop, right? Bubbles go to zero, bubbles evaporate. That's a bubble. This is being one right here. Skills SKLZ start out in May of 2020. You had the COVID run up and now it's gone down 99.99 value. Once something goes down more than 90%, it usually doesn't recover. It's just, it's going to die a slow death at that point. 90% is pretty much like the max. And usually it's not even 90. It's like 88, 89. We're gonna go. When we look at, on Thursday and we look at market bottoms, we'll look at a few of those reversals where things were down a bunch of. They were never down quite that, quite that amount. But yeah, bubbles, they. They pop and then they just eventually go into obscurity. Kind of like Enron, right? Enron was a bubble. And there's definitely some money to be made on the downside, right? Shorting stock or buying puts or bear call spreads or day trading. Like you can make money as it goes lower, but a hyperbolic extension of price action is the Dow Jones in the 1920s or Bitcoin in 2017. Stock is really, really high. The assets really, really high. Has a huge, huge pullback. Everyone's scared, mortified, petrified and terrified. And then it recovers and becomes higher than ever. These are the things that we have to study. Is this asset going to return? Is this going to recover? How's the fundamentals look? What do I like about the company? All those things. A lot of stocks that eventually end up going to zero, you'll start to know that when they have a reverse split. A reverse split is not a good sign at all. That's when, if you have a thousand shares worth $10 now, you'll have 10,000 shares worth a hundred dollars. I do that math right? So it reverses it. So instead of having a normal split, which is if you have 200 shares worth $50 now, you have a hundred shares Worth a hundred dollars. It goes the exact other way around. They reverse the split so you get more shares at a lesser value. Right. So you have tons and tons and tons of shares. They do that so that the price continues to go up. So that what happens, it has farther, farther to go down. Yeah, it's not a good thing. It's usually a death sentence when, when a company issue a reverse split. Now before I talk too much about that, there is one very interesting thing that will happen during reverse split and that is generally after reverse split you'll get a small pump for like a week. So this is skills, this is the, the daily chart right here. And you'll see where that says that s right there. There's the reverse pump that happens after the split. So that, that's the exact. That's just a fun fact for you guys to know put into your member bank at some point when a stock has a split it runs up into the split and then after the split happens it has a dip and then eventually goes higher. Is the exact opposite for a reverse split. When a reverse splits announced the stock tanks, has a reverse split and then pumps for a little bit. And it's all a psychology reason, it's all psychological. I'm sure we'll probably talk about that in later classes but let's just go look at Celsius and you'll see that price action pretty much perfect, right? A run up before the split, announcement of the split, a drop. So here's the run up stock splits, it goes down and then what's happening, here's the split right there. And now it's going to start to go higher. Very, very common. I think the reason that is, is because a lot of people don't know things and they'll open up their account one day and they'll, their stock will be less valuable and they won't know why. So they'll panic and sell. Sounds crazy, but they'll have literally less value in their stock. They'll still have the exact same amount of overall value. Right. So Celsius, what was it? A one for four. I think one for three. Yeah, one three to one, three to one split. So when it split, let's just say it was worth 60. So 60 times three. So $180 a share. So if you had 10, 10 shares at $180 per share, Tom, you now have 30 shares at $60. So when someone opens their account they're like why is this worth 60? Oh God, this is going to zero. They'll sell it. Just unfortunate. That's why I'm trying to get this information out to as many people as possible. But that's why that happens. It's just a lot of people that have stock like that, they don't know. Any questions on that? That's kind of like a random off subject. I didn't have that in the slide. Splits and reverse splits. I just know that's an interesting point to bring in.
Can you, can you search online to see what stocks are going to split and when they're going to split? Is that like, how do you find that information and know what stocks in the world are about to split?
Yeah, I think so. Let's. Let's Google it. What stocks are about to split? Upcoming stock splits. There you go. January. So these of all these are all almost about to happen. So normally, normally they're garbage companies. Yeah, most of these splits just absolutely garbage. So there's no good, there's no good ones right now.
And along those lines, how would you know if it's going to be a reverse split?
It'll tell you.
It'll say that on there.
Yeah. Yep. So this is a normal split right here and this is a reverse split.
Oh, gotcha. Okay.
Yeah. So like, like 4 to 1 if the number is bigger up front.
Yep.
It's a regular split. And if it's smaller, it's a reverse split. So. Good question, Jeff. So I, I did not know the answer to that question, so I googled it and. Yeah, man, looks like that. There's a, there's a list. But most of these. Yeah, most of these are garbage. But when you get a good one, I normally talk about it, but you know, oftentimes, like when I hear about it just kind of being in the normal flow. When Nvidia split, not that long ago, I told everybody exactly what's going to happen and it literally did precisely that. So this is the Nvidia split. I made a lot of money off this run up into the split, there's a post split crash and then there's the pump afterwards. I mean, it's, it's a very common thing on, on a good company. I should, that, I should probably preface that. You know, that make sense. Cool. Yeah. So the next split, I'll let you know. Celsius. Celsius was the most recent. What's that?
Scott Tesla did it about a year ago.
Right? Same thing. Yeah, same thing. All right, so to look at a few of the other. The other really big ones. So I'm just going to go look At a few of these, and then let's just kind of study them for the next hour or so and kind of talk through the sentiment here, because that's really what we're here to study. I'm going to have. Who am I going to pick on? Who am I going to pick on? Jason, pick one of these stickers and let's go analyze it. I think you're muted, Jace.
There we go. All right. QCOM.
I love that one. Qualcomm, the 2000s. Okay, so what I'm gonna start off on is I'm gonna start off on the monthly chart just because it's, you know, it's easier to see and so funny. Oh, look at that. So I. I wasn't trading in. In the 2000s, obviously, but I had a lot. A lot of mentors who. Who did trade. And one of my mentors was Dennis Dick or is in a stick. And he traded in 2000s. And I was asking him how the. How the market was in the 2000s. He said, we'll probably never experience anything like that again. But the markets, they would turn off the stock markets because how quickly something would go up. I've never heard of that before. I've seen. I've seen them shut off the markets on how things go down. Like, oh, no, we're going down too much. And so they'll freeze the markets. They would turn the markets off because things would go up too much. Isn't that wild? So they. He said that they were getting split like a stock would split three, four times a week to try to keep the prices down. Yeah. So bananas. So anyway, one of the number one. Look at this, guys. Look at this. On a monthly chart. So one of the number one components of a market crashing is it is the human emotional element when people are very, very, very excited about that, about the particular stock, about the stock market, about bitcoin, any of that stuff. When people get absolutely just fired up about it, that's when you know something is happening. So the whole, you know, the whole. When the. When the bellman tells you about a stock. Probably too late. Yeah. So that was one of my signals for bitcoin. And we'll look at bitcoin before we go too. But in bitcoin, this. This is a true story. I. I was getting a. A smoothie from Panera or whatever, Like a smoothie and a sandwich. And the lady at the counter asks me, as I'm checking out, have you heard about bitcoin? I'm thinking about buying it, which is not you know, that's nothing particularly interesting, but it's just like. It wasn't because she worked at Panera, but it was just the fact that I knew the Panera was high. I knew that. Or, sorry, I knew that bitcoin was a little bit on the upside and. But I haven't even ordered, like my full order. It was mid order. And she asked me, you know, and so then when I leave Panera, there's a cardboard sign with black marker on it and the phone number that said, call me, I will buy your bitcoin. I was like, yeah, the top is in. This is. This is the sign. So a lot of it is human emotion. That's when anytime I'm calling for a stock market crash or a stock market correction, which I've only done twice in my career, anytime I ever call for those, it's oftentimes because everyone and their mom is talking about the stock market.
Right?
You all know that cousin that you have that you don't like very much? You kind of like him. You talk to him every Thanksgiving, you come on the birthday, but you're not like the biggest fan of that person. When that person calls you and asks you about the stock market, that's how you'll know. Right, Scott? You know what I'm talking about. When that dude calls you and it's like, hey, Scott, so I was thinking about buying. Buying Apple. What do you think? When that happens? You'll know that the market's a little bit high. And it. You're gonna have to feel it out for sure. But that's. That's definitely one component. Okay, component number two. So again, this is a monthly chart. So let's just really analyze this. Remember, I'm gonna go into a logarithm chart to really look at this at scale. Now, we're not talking about Elliott waves yet, but we will in the future, I promise. But look at this. 1, 2, 3, 4, 5. So all, all market reversals are going to occur after a wave five up. We'll talk about that in very future classes. Number two, it obviously is going to happen after a huge bullish move. So when I say huge, what do I mean? I. I mean astronomical. Something where it's like, this is too much. So Qualcomm went up 3,400% in two years. It's a lot. I feel like that's a lot. I think that's a pretty big number. Eric, do you. You love the house that you live in, don't you?
I do.
Would you sell it if it was worth 3,400% more.
Yes.
Yeah, I bet you would. I bet most of you guys would sell your house if it went up 200% in value. Okay, that's not normal, that type of growth, especially over that shorter amount of time frame. I mean, maybe over 30 years. That's a good number. But 3,000% is a lot. You know, like I'd sell, I'd sell my, my socks if someone offered me 3,000%. Like what? Like that's a. So that's number one, is like if it's a real, if it's up there, if it's had a huge move, that's a signal. I don't think we're ever going to get the moves like that ever again because they. But maybe we will. I don't know. Anyway, that's just, that's just a thought process. It's like, yeah, a huge move. Okay, but let's start really looking at again, we're, this is monthly. We're going to go into a weekly and then a daily in just a moment. So we have bull candle. We have bull candle. And look at the volume. Volume is a big one. So the volume on this candle right there is the second largest bullish volume ever. And we did have one more good push. We did. But that push that following week was pretty small in comparison. Everything else that was, we went up another 120% in the next week. Sorry, the next month. And then it started kind of tapering out. So big, big, big bullish volume. I'm not talking about this, this bullish volume. This is normal, actually. Bullish volume on a, on a good breakout like Nvidia a week ago, that's, that's perfectly normal. That's reasonable. That's a breakout. But if it keeps pumping and pumping and pumping and pumping and pumping and then you get a huge bull volume spike. That's generally a reversal. Now again, that doesn't mean that I'm buying puts at the exact top. It just means that I'm beginning to plan when I should take a trade. Okay. Secondly, this candle is really interesting. Jeff talked about this candle at one point I think early on in class. But this is a shaved top candle right here. So the open and the high are identical essentially mean on this particular chart to the almost to the penny, 40 cents off. So who would like to explain the sentiment of a shave top candle suit?
I figured you were going to pick me because I honestly don't know.
That's okay.
I don't know. There's no, there's no selling up there.
Well, no, that's it. No, you're exactly right. Yeah, there's. But there. There is no. There's no buying. So a shave top candle. Imagine as soon as the price opens, no one ever buys above that price. It opens and starts selling. There was never a buyer above that, whatever that open price was, not even to the penny. Opens and just immediately starts selling off. No buying. It's a strong selling signal, right? That's just so much selling price. It's aggressive selling. I mean, again, it's like the first person to the market. It's like whoever can get there first. Imagine I posted something that said all iPhone 10s are worth $40,000. Like, it's like the first person to find their iPhone 10 is going to sell it at 40,000. Right. And that's probably going to be the very, very top. And then the numbers going to keep coming down. So it's just a rush to the market. It's like an instant, as soon as the market opens, people start selling type of sentiment. So usually shave tops are really good bear warning signals. All right, so now let's go in as we're still looking here on the. On the monthly chart. We'll go into the daily in just a second, but check out this really, really cool chart pattern here. We have a strong bear candle. And then walk me through these two pretty insignificant tiny bull candles. Jason, how. What do you think those candles are all about?
I mean, there's buying there, obviously.
Yeah, there is.
I mean, people are still bullish on it after a bearish day, right?
What else?
That's all I got.
Well, you nailed it. Those two are correct. So there are people still buying. People are like, oh, this is a discount. It just had a good pullback. It's only up 3400% in the last two years. This is a nice healthy dip. Can't wait for it to keep going up. But look at the size of those candles compared to some of the other ones, right? Compared to these two. I mean, if I'm looking at those candles, I'm like, that is. It's pretty weak. So this is so fun. I'm telling you guys, when you. When you start knowing that all reversals are the exact same, I'm gonna say this two more times. Every single reversal that ever happens gonna be on the exact same pattern. It is uncanny. They might look like candles might be a little bit different, and some of the size and percentages might be a little bit different, but it's all Gonna be the exact same. Let me show you Coinbase. Even, even if it's just again, a normal, cute, needed, needed pullback. I mean, the, the sentiment that shows up is pretty much identical. All right, here we go. So just, just to compare the sentiment of these two candles, right? Check it out. You get a strong bear drop after an amazing run up. So here's your amazing run up. And if we're thinking about it, I mean, just from comparison standpoint, two strong bull candles. Two strong bull candles. They come in before, right? Big, big, strong, gnarly reversal candle. Big, strong, gnarly reversal candle. Two relatively insignificant kind of puny and pathetic bull candles. I mean, got this from a monthly chart in 2000 to a daily chart from last week. Is that pretty bananas or what? Wild. So I told you guys, Coinbase is.
Going to go lower.
It wasn't. It's not even like a question like, yeah, it's going to go a little bit lower. It can easily go higher. I mean, the, the move is perfectly normal. But like we, we needed a pullback. It was just, just a matter of time. And the sentiment's the same. And it really all spurred from these two candles here on the monthly chart. And for me, these two candles on the daily. They're just weak, small, pathetic and insignificant. Volume declines. Look at the volume again. Master these charts, team. The one I posted on the ultra wealth presentation. We'll show them again. Spend time this week studying them like crazy. Just look at them. Look at the candles. Go back in time, go back, trade them over and over and over and just really ask yourself, what are the people feeling here? Because the sentiment is the same. So check this out on this candle. So after you get a little bit of selling, this is actually a candlestick pattern right here called a rest after battle. Arrest after battle is two strong candles on the outside with two tiny candles on the inside. Can be bullish or bearish. Doesn't matter if it's bullish, it's obviously just different colors. But arrest after battle. In this example, you have two strong bear candles and the bodies of the two small bull candles are within the bodies of both bear candles. Right? The second bear candle has a lower shadow. And look where the lower shadow is. Lower shadow is right on top of the strong bull candle. The low, the open of that strong bull candle. Eric, why would you think that that's significant?
Because whenever there's a massive change like that, there's people that are trapped. That's. Who.
Who's trapped?
Well, the sellers in that top the highest candle that there is. Well, they would. When it dropped. Are you asking about the bounce or when it fell through?
Yeah, when it fell through. What's the importance of the significance of that?
Yeah, once it fell through, then all those bowls in that largest candle are all trapped and they all sell. And that's when it drops again.
Yep. Who else. Who else is trapped in that situation?
Because you're correct, the inside candle people are also trapped. Those people that rebought.
Yep, yep. Absolutely true. And the people who create this little lower shadow right there. Oh, yeah. Now what's interesting is that lower shadow is often is also right on top of the open of that strong bull candle. So when it broke both of those, would you agree that even more people got trapped and began to lose money?
Yeah.
So now I'm going to apply that exact same sentiment. Team. It's again, the sentiment similar. I'm just reading a book. It's just in different language at this point. Okay. Big bear candle, a bunch of small insignificant bull candles and then a big bear candle. Look at the line. Boom, boom, boom, boom. So strong bull candle, strong bull candle. Nice lower wick. Nice lower candle. And then this candle here in red closed below the low of all of those candles. Jason, would you say this is the exact same sentiment? Yes, the exact same. It's crazy. And so the fact that we gapped down and started making a strong bear move on Coinbase, I agree with Jeff when he posted that on Thursday, he said Coinbase is about to have a big move. He was absolutely correct. Right. He was able to trade it bullish at open and he could have also shorted it. Right. When he sold his clothes for a profit. Jeff could have sold his bullish position and then sold short and then had to stop on the downside and made money on the downside because it was just both right. He was absolutely right. It's going to have a big move and it had a 7 1/2% down day. That's a lot of good money to have to. To be made. And if we go look at moving averages. So let's look at Coinbase on the the 50. Kind of like Jeff was saying, we opened at the 50, we bounced off of it, we retested and we kind of broke through it again. Another nice element for us to use if we're day trading or, or even swing trading. Tom, let's go into a three minute chart just to see how we interacted with the 50. And then we're gonna go back and kind of look at Qualcomm and keep studying this chart because again, team, it's. The more you just look at the reversal sentiments, it's all the same again, same story. Sometimes it's just in a different language every now and then. The patterns are identical, though. I want to say every now and then like 50 of the time, it's the same exact thing. Something surprising. All right, coinbase, let's go over here to the left a little bit. Okay. Sorry, I don't know why it's taking so long. Okay. And here's the coolest part. So the purple line, all of you know, is now the 50 EMA. Telling you guys, you're gonna love this stuff. Just the more you see the same principles over and over and over. It's just amazing. All right, I'm actually going to turn all the moving averages off on the. On the three minute chart just so we can kind of look at the candles. Okay, I'm gonna zoom in one last time and I'm. I want. Jeff, walk me through what happens. I'm gonna draw a. An image on the screen. Walk me through what happens here. In the red circle.
The stock drops below, below the 50 MAA. And then it hits it as a resistance or a support. I forgot what the upper one is. And then it just. It goes down. So it uses the 50 EMA as the opposite. And then it just goes down. Once it hits that, it tested off of it, which is where I made my day trade because I kind of knew it was going to do that. I didn't know it was going to keep going down, but I knew I would make money on that, so I did that. And then it did drop below it and then it just hit it and it just went down from there.
Totally, totally. You nailed it. Yeah. So he. So Jeff played it bullish in here and made his bull money off of the bounce off the 50. And notice, team, you have bear candle. Bear candle. Bear can bear canal. Bear can have five bear candles in a row. So after you get a bunch of bear cows in a row, what's generally going to happen? Nancy.
You'Re going to get some buying going on then, because people are going to close their positions that were short and people are going to say it's at a discount and they're going to buy if they weren't already in.
Bingo. And so would you agree that this is what that's represented by right there? That buying?
Yes.
All right, so then bearded Jeremy, after that happens, you get a new low and then a huge amount of volume Comes in. What happens after all of that big buying volume comes in?
You get a retest of that support.
Resistance, and that keeps on going downtown. Exactly. Huge good buying volume, not. And then it retests the 50 EMA. Just like Jeff said. Old support becomes new resistance, and then we fail. So, Eric, check this out. So you have a big bull volume and you have big bull volume, both of those bull volumes. You could really draw the support level for all of those as this black line. And once that black line gets taken out, what happens?
It doesn't come above it again. It acts as resistance again. Over at 12:30pm.
Yep.
I have a question. Why? How did you know to use the 50 EMA on the daily to draw your purple line? How did you know not to use the 20 or anything else?
Oh, good question. Yeah, good question, Jeff, answer.
I was studying all the charts and I was just. Because I. I look at a confusing screen, I do the 100, 210, 20 and 50 all at once. And I pull a daily, weekly, monthly, and I just watch which ones they like to bounce off the most and coinbase like to bounce off to 50 the most. So.
Nice.
I knew it was a good support.
Nice. Thank you.
I don't know if that's the right way to do it, but that's what I do.
Yeah, I don't. I don't disagree with you. And if I go to the daily chart, here's what's also cool. So to answer your question, Eric, if we go to the daily, that was the only moving average that was there in that zone. Yeah, exactly. So kind of like what we were studying last weekend, we're like just the spacings and like the where everything is. So if I pull up, pull up all of them. So we had already broken the 20, and here's what's amazing. Again, talk about that sentiment gift. Let's come in just a little bit more on the moving averages, Tom. And what we'll notice is that when we broke below the 10, the 10 acted as a support for literally like two and a half months. Let me go to the left just a little bit. So are you able to see how the 10, which is the red line, acts really nice as the support level when we break through it and crash below it. Now the 10 is overhead supply, and it's just such a beautiful resistance. And as we trade up into that, Tom, now people begin to short off of that particular price. They begin to attempt to sell. And that selling does work off of the 10 from the bottom. And so Once you got below the 10 and 20, going back to the spacing principle we talked about yesterday, which is why it's so important that we covered it. Where else is it going to go.
But the 50 got it.
Isn't that bananas?
Yeah.
So fun, man. It's so fun. And it's because it took out. That we took out the 10 and 20 so fast. That's why we just, we just crush right through them. So once we were below all of them, then it's like, oh, well, there's, there's literally, literally, literally nothing stopping it until we get to the 50.
Jeremy.
Yes, sir.
So I watched your video that you posted on the volumes that. And when you go and look at the charts, though, there's some good volume that comes in at a low price. So wouldn't you expect it to go higher or because it's on a downtrend, you would use the trends over the volume.
Where, which time frame, brother.
You were on the day chart where Jeff was showing, like the beginning of the day. It went up and then it kept dropping.
That was a three minute chart.
The three minute chart.
Yeah.
So wouldn't. With the. When you were going over that video, was it based on more days or. It doesn't matter the time frame?
No. Yeah, great question. No, that's, that's what's really cool about volume. It doesn't matter the time frame at all. So here, here's the thing is, you're absolutely right. There was a lot of volume. Let me, let me turn the moving average off on the three minute for just a second and then we'll look at the volume. And that's, that's exactly why Jeff played it right again, looking at just moving averages and all the things. And so he, he rode this up bullish. And you're correct, there was a lot of volume. So if I come back and let's look at this, let's look, let's just look at this right here. All right, so we have. This is the first 40, 50 minutes of, you know, Coinbase. When we have all of this here, what ends up happening is just simply the fact that when we roll down, we come all the way down and close below all of this, trade down to the 50, and then we bounce and then break lower and then we just got below that support and then we treat the support as old support, new resistance, and we failed it again in. So the volume was good. It just doesn't have to last forever. Right? One, one good series of volume. You can make money on that. Direction. That's fine. Nothing wrong with that whatsoever. Because I agree, the overall trend on Coinbase is bullish. We're just getting a. A healthy pullback, a needed pullback right now, so you could definitely make some money on the upside. I mean, it's three or four dollars to make and great job selling there, by the way, Jeff. That was. That's nice and lucky. It's always good to sell. Buy low, sell high. But once every one of these candles gets. Gets taken out, Scott, all the buyers in those candles now become trapped. Now I just got to.
It was good buying power that came in later on in the day, like, looking that it was going to reverse.
Correct. The problem was. You're right. The problem was it happened below a major support. I wouldn't have personally. Yeah, I wouldn't have personally gone bullish on those big volume candles, Tom. And what those big volume candles say at that stage is we better go higher. But we never did. And those. Those two volume candles that you're looking at right here, those. Those big volume bull volume spikes. You're 100% right, man. That's when those. That's the only chance for that stock to have gone bullish. And since it didn't and it broke the biggest bull volume of the day, this guy right there, which is right here. When we closed below that volume here, it's deadly. Deadly for the bulls. They have to get above the 50 and they just never did.
Gotcha.
All right. Does that make sense? Yep. Yeah. Because if I.
Sorry, go ahead, Eric. It could go sideways for a while because.
Yeah, totally. Yeah, totally. I mean, if I'm. If I'm day trading this in real time, which I didn't trade Coinbase on Friday, but if I'm trading this in real time. Let me show you guys how I'll be looking at this. So I'm gonna zoom into here, and then I'm gonna make this chart big. Okay. So I'm gonna zoom in just a little bit. So if I. Is. If I'm looking at this, I am seeing two things. And let's forget every other trend. Let's not pretend that we know that Coinbase could or might reverse or whatever. Huge bull volume, decent bull volume, big resistance, which is the 50. At that point, I am absolutely saying, okay, I'm ready to go bullish. I can take a bullish trade. Two good volume spikes, and we're battling a resistance. What needs to happen, Jeremy, for me to go bullish on this trade? You need to get. So we had that big bull Close above. And it needs to break because then it immediately had that bear candle come in. So it needs to close above. I would. If I was going bullish, I would.
Go above, like, entry above that bull and bear candle.
Bingo. Yeah, bingo. So a lot of times, Scott, for me, what I'm looking at is at this stage, we just simply need to close above that because, you know, there's a strong resistance. You know, you have good volume, and you're like, okay, cool, Tom, let's get a close above that resistance. And I can easily go bullish because there's definitely a resistance there, but I can go bullish. Let's get a good close above it. And since the exact opposite of that happened, and instead of getting a close above that resistance, we end up eventually closing below the bull volume. People are trapped.
Plus, Weezer tops, our indicator going down. It's going bearish.
Boom.
You got it, Jeff. What you got for me? Big dog.
So another thing, I. I'm looking at all the charts you're showing, and in your intermediate class, you go over this, and it shows true a lot. So I. If I get the terminology wrong, I'm. I'm sorry, but it's like the ladder. So if you go to the bottom of all those bull candles, see how it goes up, it drops. It goes up, it drops. Do you know what I mean? I can't draw on the screen, so I can't show you what I'm seeing, But every single chart is doing that. And then the other, when it goes bullish, it does the same. Do you know what I'm saying?
Yeah. Yeah, totally. That's what's cool about it, man, is like, you're exactly right. Once. Once you have all the support levels and once you have everything really baked in there, and that's kind of like the. The price point that starts holding, you can. You can determine that to be the level that either going to get rejected or not going forward. Yeah. And again, the tweezers, like, really good reversal signals. Tweezer bottoms, tweezer tops. I love. I love. I'm a huge fan of tweezers. Big fan.
Is it because they signal a pivot?
Yes, sir. Okay. Yes, sir. An immediate pivot. That's what's cool. I mean, imagine how much money it takes to stop a stock at the same price twice instantly. That's. That Jeff Gervais money, you know, that's a. Some big coin right there. Yeah. So it's just like, you really gotta. I mean, the same price two times, that's big Literally, it's always in the hundreds of millions. Yep. Great stuff. Okay, beautiful. So let's get back to Qualcomm. All right. Minimize this and go back to the 1 chart. Okay, so here's our Qualcomm chart. Now check it out again. Tina, I just love this stuff. Like, marry these charts and study them. The ones I posted specifically. I spent my career studying these charts. I could write a doctorate on the charts. I want you to be the same level because the sentiment will never change. I know that sounds crazy. That's a bold statement, but it's like once you nail it, it's nailed forever. We know how strong this support is right here. We can see it when that support breaks. We just talked about that a moment ago. Literally the same thing on the coinbase five minute chart. What happened? That support becomes. Resistance. Old support, new resistance. And it's a really good support because of the size of that candle. Here's a secret. The open of big bullish candles is always a great support. And the open.
Would you hold that time frame.
Depends on the candle. Like the. Like, if it's a monthly chart, I mean, years. If it's a three minute chart. Days. Two, three days.
Yeah.
So it's just an extrapolate. It's just a fib number extrapolated out into some probably like the eighth or ninth iteration. Yeah. So what's. What's cool here is like just the pattern. And you're going to really start to see this as it kind of comes into your frame of reference. But you get that, like, move here that Jeremy's really familiar with, and you get that retest here and then you ultimately get the breakdown. And then just like our Coinbase chart that we're looking at, ultimately this also becomes a support because again, the open of really, really, really strong bull candles is a support level, just like the open of really strong bear candles is a resistance level. And just like on Coinbase, you got huge bull volume that came in randomly throughout the day. Would you guys agree? It was like a random whatever time frame. You had a big bul. Volume spike when we closed below that volume. Were the bulls trapped? Yes or yes. All right, sweet. So now let's go into a weekly chart on Qualcomm. Look at the same price action. So weekly chart two. And so now again, it's, it's. It's not hard necessarily, but comparing a monthly chart to a daily chart is difficult because you just get so many iterations of the same thing. But now when you're looking at the weekly, it becomes so much more obvious what was happening here. I mean, it's just really, really, really clean and really spectacular, in my opinion. You had. And January of 2000 to July of 2000, we dropped 72%. Seven months. So when you start getting this big bull volume down here, is that now an okay buy signal to start watching, or is this at least a good zone to be watching for buying? And the answer is yes, right? I mean, it's down 70% in seven months. You get that type of volume. It's like you. You probably could be watching that spot a little bit. But what's fascinating here is who wants to walk me through these three candles and their ultimate significance to this reversal? All right, Jason, it's you.
I knew you're gonna pick me.
All right, these three, I'm looking at.
It on my chart too. You got the tweet or the. The shave top candle there. So media selling pressure, close two closes below that last big bullish candle. A little bit of buying pressure on the third. And then once it goes below those three candle support, I mean, signifies a pretty significant bearish move.
Agreed. Do you notice anything special about those. Those two candles right here?
I mean, that support.
Inside.
Okay.
Yeah.
So for two whole weeks, as Jason was kind of alluding to, we were. We traded within the range of that big candle. So we. We have this huge shave top candle, which. This is a massive candle, guys. The. The high is a hundred, the low is 60. Are you doing the math? That's a 40% drop in a week. That's awesome. 100 to 60. Wait until you go to the daily chart. Your mind's going to fall apart. So when you get that type of a move again, let's just think of the numbers here. When you get that big of a move, you have to get some type of consolidatory effect. So the consolidation comes in. You have two inside candles, and then we. We drop below those, and then that old support becomes new resistance. Right. You get a buying. Now, why does this buying happen? Well, that buying happens because we had already dropped 45% in four weeks. So are there buyers out there? You think, wow, this thing's down 45%. Let me buy some. Yeah. Did that work for them? Yeah, a little bit. It went up 43% over the next eight or nine weeks. That's a lot of money. That's 23 points on that stock. Does that make sense, team? So even though, like, we can see that it ultimately reversed, I'm kind of here to show you that you can still make money in bull bear markets. You just got to be quicker about it. Like, you can't expect a huge, huge, huge, huge move. You're gonna be trailing stops. You can be a little bit more aggressive. All right, Joe, walk me through the sentiment of these two very, very, very interesting candles. This one, and then the Armageddon candle.
Well, the first one is a hammer candle, so it's showing a lot of bullish strength. Doesn't have a lot of volume behind it, though, and it's not in a great spot. It's not at the bottom. So the next candle looks like it's a shave top again. So, again, not a lot of volume, but it did immediately close behind below it.
So below.
Below all the candles before even all those candles that were consolidating.
Yes.
Beautiful, Beautiful. Okay, Tom, so what I heard you say is it's a great hammer, but it's just. It's a little on the high side. So it's a better candle if it's lower, which I totally agree with. Also, who can notice how many buying candles came in a row there? 1, 2, 3, 4, 5. And then we had a debacle. That's kind of cool, huh? Ready for this? I don't think you're ready for this. Maybe you are. I didn't even draw this comparison until mid my. The middle of my run the other day, because I don't know what else you guys think about when you're running, but I think about stock charts on Coinbase. You had five small bull candles almost in a row, and guess what? One of them. Almost a perfect hammer. And then we close below low of the hammer. Nancy, does that give you goosebumps or what? I mean, that is, like, terrifying to me.
It does now. I wish it did a couple days ago.
Yep. So if we zoom back out, look. Look at this, guys.
Look at this.
Look at those. Both candles in a row. You get the hammer. You get the hammer. It's not happening at a low level. And then the hammer gets decimated. Now, on this, this is a weekly candle, right? So we close below it. So we close below it right here. Just fascinating. Very fascinating. Now, here's something that you can write down. This is a Jeremy Newsom rule. You won't find this in any textbook. If you have a hammer forms and the immediate following candle closes below the low, go short. That's actually one of the higher probability candle patterns I've ever seen. Now, depending on how many candles come before that iteration decreases the probability of that trade Working out by a small factor, but bull. A perfect hammer immediately closing below the ver. The very next one, not like nine months from now, but like, if it's Monday, then it's Tuesday. If the next candle closes below a perfect hammer, it goes down like 79 of the time. That's a very high percentage. That'll make you ultra wealthy right there. You can just close the. Close the whole mentorship and go. All right, thanks, Nathan.
And Jeremy, that's just on the daily chart.
Any time frame, brother. Okay. Yep. Any time frame. The bigger the time frame, the more likely you're going to get a little bit of a retest. Like this one right here, because that's again, that's two weeks. So that's tons and tons and tons. Right? On a whole week. I mean, you went from 61 all the way down to 49, back up to 61, back down to 47, back up again, back over to a failure. So it's a lot of price action. But, yeah, also this is a chart pattern we're going to continue to study more and more and more of. And I know we spent a little bit of time on it in the intermediate classes, but the most popular reversal pattern, ladies and gentlemen, for the cataclysm of stock reversals is the double top. The better you get the double top, the more money you'll make guaranteed. And double bottoms. Also. Look at the double top. Boom, boom, boom, Neckline, close, the close below the neckline. All this is the retest, the neckline carnage. And for me, as a trader, like, I probably would focus 85% of my time catching these three candles. So I may. I may have taken some trades in the red, I may have taken some trades in the green, But I'm. I'm taking that carnage because with the. With the right size, the right timing, that's how you become ultra wealthy on the markets. That's really the answer. Right size, right timing. Okay, let's look at one or two more of our. On our list. And I'll go from this time just weekly into daily. I promise you guys. Bitcoin. So let's go bitcoin weekly and then bitcoin daily. You've got to study this chart. This is going to go down. The history is one of the coolest charts of all time. The 2017 Bitcoin bubble, or, sorry, hyperbolic extension of price action. Okay? And a lot of. A lot of these you're going to want to look at on a logarithm chart. You can turn both on and Off. But the logarithm chart will just make it look a little bit less severe. Like, oh, that wasn't that bad. And you realize that. So bitcoin again, same thing. Bitcoin went down 83%. What was my rule about percentages? Does anybody remember 90%, 9% or less? Exactly. Anything less than anything more than 90. That there. The likelihood of that recovering is less than 1%. It can. But most humongous, astronomically ridiculous. Crashes up to 90% is, is, is doable. I know that sounds nutty, but all the reversals, they usually stop somewhere around 80, 83, 82, 88, 89. Just don't quite make it to plus 90. I don't know mathematically why that is, but that's just what happens. All right, so looking at bit bitcoin. Oh, my gosh, I just love this so much. Tell me that's not the same pattern. I. I would love for someone to tell me this. It's. It is seven years later, strong, huge bull candle volume came in. And then you got one more bull volume. Right. What type of candle is this? Ms. Sue just talked about it earlier. This is your favorite candle now. Yep.
Shave top.
That's right. That needs to be some of your plans, by the way. If everyone breaks any rules to shave your top, shave that head of yours. That's a great trading plan. Break. So yes, shave top candle. And then back over to you. Jason Smith. Same or. Sorry, not Jason. Jason Chase. Same thing you said earlier. Tell me about these candles. Right here.
Some inside candles. Trading between that. The big bearish move.
Yeah.
Create support and then breaks right through it.
Bingo. And then that support becomes what, Eric?
That support becomes new resistance.
Isn't this bananas? Guys, this is a whole different asset class. This, this is 17 years later. Qualcomm and Bitcoin. I'm the same thing remotely. Unless you believe that Qualcomm created Bitcoin. Hey, who knows? Yeah, I love, I love these patterns because it's, it's so, so, so, so similar. And then when you go into a daily chart, we got to go all the way back to 2017. And you know, there's some amazing, like pre crash crashes. You get this one. You get this one. There's all kinds of interesting ones, but the big one doesn't happen until here. And on daily charts, these are a little bit harder. They are. There's some more interesting events that. That begin to happen. But when you start studying the daily charts of these reversals, there's still some things that, that hold True. Like the support resistance levels and really the new high that gets made right here. So you, you don't oftentimes get the shave tops. It can still happen, but you don't really oftentimes get the shave tops on the daily charts because, you know, just a little bit more price action. But right here, what's fascinating about this candle is the spinning top at the new all time high by a couple pennies. So there's some sentiment there. Right. This is what I call that in green right here. This is the Svetlana candle. That's where she bought her bitcoin, right there. True story. I have, I have my own silver candle. Don't worry. But that's where she bought her bitcoin. Still has it. Same one and bought it 20,000, you know, 19, 8, 89. The highest. Anyway, so that's, that's the FOMO candle. Right. Right at that high and then you kind of get the roller. So again the question is like, when does this really become. When for me do I go, we got a problem. Right. Going all the way back to the beginning. Like, when do we get a problem? That problem is right there. Once that candle comes in, we got a problem that break below that support. So that means I'm probably not making a bunch of money in between here. Realistically, I'm not really. Maybe shorter time frames, I'm trading something. But the green candle, that's where the problem exists. And then we get the bounce so we, we don't actually break that. So I, I never would have made money. I'm not getting triggered into a trade. I'm not doing anything. But I'm expecting. Right. But it didn't happen. And then the perfect candle to end class with. I mean, I could not telegraph this better. The reason that you're all here, the secrets of Jeremy Newsom's candles. What do we get? Nancy Jones?
We've almost got some tweezer tops there, but you got that big hammer that. Then the neck, very next day it broke that, that hammer, which is going to be the signal to go down.
That's it.
My question on that would be when you see a signal like that, do you mark it in or do you find that resistance that's above and sell there?
Oh, that just depends on the time of day that I'm seeing it. Okay. Yeah, if I'm seeing that Walmart is open, I'm marketing in. I'm just getting in at that moment. I mean, I might zoom into a five minute chart. Like, hey, is there a level you know, but like, that's. That's deadly. Yeah. Will I set up some other trades also? Yes, to sense. So essentially, just think about pyramiding it, but in reverse, where I'll get into some. And I'm saying, all right, if it retests a little bit higher, because I know that purple line drawn from previous support based on, guess what, Brian? Volume. Right. Previous support drawn, previous wicks drawn. I know that we could still retest that. But in that example, and I did not do this trade to clear up any questions. I did sell all my Bitcoin at 17,000. Felt like an idiot when it was at 19, 000. I did not play any downside on bitcoin. I don't. I generally don't short bitcoin. I'm a bitcoin maximalist, so I can't really short. It never broke below this signal. But that's when I. I'm absolutely getting, you know, worried or whatever. That close. I'm absolutely shorting without question. I'm getting it on some retest. And then I have an order to add more to my position here. The breakdown of the original worry zone. Once we break the worry zone short to retest collapse. It's the same patterns over and over and over. So what I'm going to do is I'm going to assign each one of you your own chart, and I want you to post your chart. I want you to spend an hour or two on this chart. If you can spend more, spend more. Daily, weekly, monthly. I want all three. And I just want you to mark up this chart like it's your job. Pretend I'm paying you $60,000 to mark up this chart. Because in reality, that's what I'm doing. I'm not paying you, but this is how much money you can easily, easily, easily make on reversals. They're going to be coming in the future team. This is not like this is never going to happen again. We can see on Coinbase, it happened last week. This will happen again. While we're in class on something, I'm doing my absolute best to find it for you, and maybe you all can find it for me. All right, Eric, you get Amber. Joe, you get the cues. I'm assigning a special person for this one. Nancy Jones gets the Dow, 1928. Jason, you get bitcoin. I'll skip Qualcomm. I think we really studied that a lot. So we're gonna go intel. I want Sue First Solar. We're gonna go with Brian Jones. Who should I Give bank of America to. Oh, that one's so tough. That one's all right. Jeremy's gonna get it. The bearded Jeremy's gonna get that one. Scott, you're getting app 2022. Jeff, you're getting silver 2010. Have fun. You are allowed to make fun of me. I expect. I expected a little bit somewhere in there. Expect some jabs. Did I miss anyone? I don't think so. If you watch this recording, John Alonso, you get DocuSign 2021. Again, we studied Qualcomm, so we trade.
12 months of that. So I got 2015. I trade all of 2015.
You can. You can trade it. Trading will be extra credit. I just want you to mark it up. I want you to show me what you see and draw on your screen and post three charts. The monthly, the weekly, and the daily. So you're gonna have one chart. It's gonna be monthly.
That.
That chart will probably take you 20 minutes. The weekly might take you an hour. The daily chart should take you some time. But just see what you see. Draw what you draw. Knowing what you've learned from class, learning what you know in general. I want you to post those charts by Thursday. And remember, team, the reason I'm having you do this is because if you study market reversals, like your job depends on it, that's what will happen. And I suggest, only do this if you truly want to make millions in the markets, because this is how you do it. You study the big ones, you study the perfect ones, you study the heck out of them, and then the next time they show up, you're ready.
Foreign. I'm not seeing Abma.
Amber. Oh, shoot, there's a typo. I'm sorry, Eric. Amba. Umbrella.
Amba. Short sale volume.
Oh, no.
I gotta go to all stocks. Got it. Umbrella. I got it.
Thank you. Umbrella. You probably never heard of it, but.
Never.
All right, everyone else? Good. Can't believe it. I can't believe I missed out as a typo. That's so dumb. Well, and here's the best part. Thursday we're gonna be doing market bottoms. The other fun one. Okay, so what goes up comes down. So we're gonna study market bottoms. We're going to continue to have a blast. I hope this was really enjoyable. Course. Feel free to watch through anything else. And if you have any questions, team, of course, let me know. And markets are closed today, but anytime that you take a trade tomorrow or Wednesday or Thursday before our class, feel free to post it in the chart. I'm happy to analyze any of your trades, any of your setups, review anything that you have. That's what I'm here for. You can DM me or post it in the channel, but I love you, family. Thank you for being in my life, and see you Thursday. Thanks, Jim.