This is how aphids detect food | A chemoreceptive protein analysis with Dr. Dykstra | Part 4 of 4
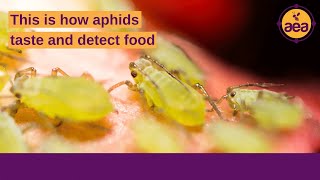
Tom Dykstra explains how aphids detect food by analyzing their chemoreceptive proteins. Building on his electromagnetic theory of insect olfaction from earlier parts, he applies new methods to decode how aphids sense plants, with work spanning since 2016.
Chapters
Hi friends, and welcome to our webinar where Tom Dykstra is going to continue to dazzle us with his knowledge of entomology and insects and how they actually perceive their environment. You know, I've gotten so much positive feedback from these webinars where farmers have reached out to me and expressed their appreciation for really understanding some of the implications of what Tom is talking about, about how insects actually perceive their environment and what this means for developing the capacity to produce insect resistant plants, insect resistant crops. And the topic for the webinar today reminds me of a book that I read many years ago titled Biochemical Individuality. And this book describes how as a result of different nutritional balances and nutritional factors in our bodies, we perceive things differently, we taste things differently, we taste food differently. So my wife loves tomatoes and I intensely dislike tomatoes. And I'm confident that if tomatoes tasted to her like they do to me, she wouldn't eat any either. And there's a good reason, a good basis for that because of the way our body chemistry is different and the way that we interact with our environment differently. And the same concept also holds true for insects. And Tom is here to tell us all about it.
All right, well, thank you so much, John. It is a pleasure to be here. For those of you who are aware, hopefully not tuning in for the first time, because this is actually the fourth of a four part series that I am presenting on insect olfaction. It is my hope that many, hopefully most of you have listened to the first three, get the necessary background that is necessary because I am going to gloss over some of those facts and focus in specifically on aphids, as I suggested at the end of part three, where this was really going to be my single focus. And so it is so the title of today's talk, Taste in Aphids A Chemoreceptive Protein Analysis. This is an analysis of the proteins that I had talked about before. And let us begin. Okay, so as I mentioned, this is the fourth of four talks and insect olfaction. Presentation number one was problems with the current theory of insect olfaction. I felt it necessary in order to discuss with you the problems that do exist with how insect olfaction is perceived so that you would understand that it's not possible for that theory to be, to be a working theory based upon biophysical principles. And so therefore I need you to be open enough in order to listen to what we have on, of course 2, 3 and 4. So on presentation 2, I moved in and started actually talking about the new theory of insect olfaction and how it could work based upon brief electromagnetic principles. And then after the introduction of that, on presentation number three, I took those principles and I actually used it to start deciphering the insect olfactory codes of various insects. And I just chose a few because I didn't have a lot of time to go through it. So that was the idea. So it was in presentation three that I spent some time talking about the software and the process and how I do it. So if you're not familiar with presentation number three, you might want to go back and check that out. But in the meantime I am going to forge ahead. So presentation number four, I mentioned it was going to be on aphids, but why? Why aphids? The reason why is quite simply because I was asked to do it. I wanted to do aphids. I wanted to do this for several years. But when AEA specifically asked me to do something on aphids, I jumped at the chance because I knew that this was going to give me a strong window into more details about how insect olfaction works. I had started the process already. It was back in 2016. I continued the process and it has been a continual working process as I continue to work things out. And so I am also going to mention briefly the presentation on leaf brix and insect herbivory. Even though that's not part of the insect olfaction, I will be talking briefly about it. So I will pull in that presentation as well, here and there when I need it.
Okay.
I had begun that presentation with insects only feed upon food that is considered unfit nutritionally poor, dead or die. This is true for insects that are eating plants. This is what I'm discussing right now. I'm not talking about praying mantises, I'm not talking about APIs mellifera, the honeybee, which is feeding on nectar. But for those that are feeding upon plants, this is the modus operandi. And so I had given this chart before and in this chart I had mentioned how if the the food is of a high enough brix level, leaf brix level, there will be no insects and no disease, but anything below that and you will get insects attacking it. But there are four different levels to that because everything is not same. And it's this lowest group, the aphid group that I want to be talking about because the aphids are found on the lowest quality plants. Now the grasshoppers, the chewing insects and sucking insects, they're also interested in unhealthy plants. But the level of unhealth is what I'm differentiating here with this particular graph. So we're going to go all the way down to aphids. And I just wanted to mention to you, remind you really that the aphid group, which includes things like scales, phyllox and some of the others in that group, are pretty much leaving the plant at 6 to 8 brix, meaning they will be found at brix levels below 6 to 8. But that is at the point where once you get to 8, aphids are all gone. And so it is this low level group that I want to discuss and give you a little bit of a window into why they are going after unhealthy plants. Okay. I had mentioned briefly to you about the digestive system as being a part. Part of the reason is because aphids have a system where they're able to filter out via the filter chamber various things that they take in and they are able to expel them quickly. This allows them, in order to do things that other insects are not able to do, such as the grasshoppers ahead. But I had mentioned this in a different talk and I'm not going to spend too much time talking about it now, but I did want to remind you briefly that this is still in. So if I'm going to be talking about aphids, where am I going with this? Because for those of you who may be aware, I'm sure most of you aren't, but There are over 5,000 species of aphids in the world. So this is not a small group. So when I said that I'm going to be covering aphids, for those of you who are aware that there are over 5,000 species, you got to be thinking, where is he going with this? And so obviously I'm not going to be covering 5,000 species of aphids. I can't cover that many, certainly within an hour. But I couldn't do it even if I wanted to try, even if you'd give me all the time in the world, because I am doing a chemoreceptive analysis, which means I need the chemoreceptors annotated, which means I need the genomes. I need a complete genome of an aphid with all of the chemoreceptors annotated before I can do my analysis. And that is only known on 12 species. So I had 12 species that I can take a look at. Even 12 is a bit much. So I'm not going to be focusing on all of them. But here are just some representative aphids Some of them are going to be familiar to some of you, some of them maybe not. So, but I do want to focus on two of them. I want to focus on the pahid and the soybean aphid, and that will be my major focus, almost my exclusive focus for this presentation, because the genome is known, the chemoreceptors have known, and I have an analysis that I'm very briefly going to introduce you to in order to give you a window into what these aphids are thinking, smelling and tasting. So why did I choose the P aphid and the soybean aphid? In addition to having a complete genome, I chose two of them out of 12 because one of them is a specialist, the other is a generalist. And they're big. These are some of the big aphids, the big pests that are out there. So they're not some of the obscure ones. And there can be some obscure ones out there. But I think everybody knows what the soybean aphid is and the P aphid as being two of the head honchos. And because one of them is a specialist and the other is a generalist, in this comparison, I am able to compare the two against one another, and that allows me to draw some conclusions that I would not have been able to draw if I had only done an analysis of one or the other. So that's the reason why I have two. So I'll be going back and forth between the pahid and the soybean aphid. Most of my discussion will be with the soybean aphid, the specialist, but I will be bouncing off of the PA aphid when necessary. So a little bit about the soybean aphid aphids. Glycine is the genus and species name. It's first described by Matt Samara in 1917. So this aphid has been known since 1917 when it was first described. Obviously it was around long before that, probably hundreds, if not thousands of years before that, but it was simply first described in 1917. I need you to know that this insect has been in our world for a long time. That's important for my discussion right now. It began as a minor pest in Asia. Then GMO soybean was introduced into the US in 1996, and that is when we had our first appearance of it. Soybean aphid Aphius glycine was first discovered in the US by farmers in 1999. It wasn't positively verified until July of 2000 in Wisconsin. That, yes, Aphis glycine has arrived and it seems to be causing a lot of trouble, whereas it wasn't doing it before, but now it was causing a lot of trouble. And farmers were looking for help as to why this pest suddenly appeared and why it was ravaging their crops so well, they didn't have long to wait. By 2003, just three years after the verification, in Wisconsin, the soybean aphid had been documented in Delaware, Georgia, Illinois, Indiana, Iowa, Kansas, Kentucky, Michigan, Minnesota, Mississippi, Missouri, Nebraska, New York, North Dakota, Ohio, Pennsylvania, South Dakota, Virginia, West Virginia, and of course, in the original Wisconsin. That's 20 states. We only have 50 in this country. And already in three years it spread to 20 different states, as reported by Vinette and Ragsdale in 2004. So this is quite amazing that this thing just appeared out of nowhere and now is spreading like wildfire. It does kind of beg the question as to why did it suddenly appear and why is it going after soybean? What is the deal behind it? So today, just so you are aware, between 92 to 94% of the soybean that is planted in the United States is genetically modified. This is an important fact for you to know because these GMO plants are there, and that there are very few soybean plants that are planted, maybe 6 to 8% at best, that are not genetically modified. And that the soybean aphids are commonly found on the soybean plants and that these soybean plants where they're found on, are usually measuring between 3 and 6 leaf brix. This is bottom of the barrel. This is usually what you expect for the aphids because they'll start leaving the plants at 6, 7 and 8. But usually I will find them between 3 to 6 leaf brix on a plant. This is rock bottom low. You cannot get much lower than that. I mean, 1 to 2 is lower, but plants even have difficulty standing up once they're that low. So this is a low level plant. It's not considered healthy. And the aphids have been moving in and attacking them with great vigor over the past 20 to 25 years. Where does this analysis begin? I'm going to do a little chemoreceptive analysis. And these are the chemoreceptors or the taste receptors of how they smell, how they taste. The ors are generally thought to be considered the, the smell receptors. And these would be keying in on things like pheromones and plant odorants that are being given off. You'll notice a large difference between the odorant receptors, between the pahid and the soybean aphid, 87 of them. Of the ors and the pahid, only 46 in the soybean aphid. Why is that? Because the ors, as I said, are detecting some of the pheromones and the plant odorants. Well, the PA fit goes after a lot of plants. It's a. It's a generalist. And so by that very nature, they're going to need an ability in order to recognize more of their environment. So it's really not surprising. As a matter of fact, this phenomenon that I'm showing you right now is very, very common in many insects. Anytime you have insects that are attacking a large variety of, say, plants, it doesn't necessarily have to be plants. That applies to cockroaches, too. Then you're going to have a lot of ORs, because they're going to need to be able to smell. Aphid is more of a specialist, with only 46 ors. It specializes in soybean, as the name is suggestive of, but it also attacks common buckthorn, too. It's one of its main hosts. There is another buckthorn plant that it attacks, though, but the common buckthorn is really one of the common ones. So it's really going after only two plants. The soybean aphid is, and so it doesn't need as many ORs. An interesting thing happens with the GRs. And these are considered the gustatory receptors, these are considered the taste receptors. So once the aphid tastes the plant, they're then going to make a determination as to whether or not they want to eat it or not. And the number of GRs goes down in the P aphid from 87 to 78. There's a loss in the number of taste receptors from the ORs. That is a little bit indicative that taste is not considered to be as important as smell. But with the soybean aphid, the opposite occurs. It goes up. We have 46 ors, but then we shoot up to 61 grs, not as many as the pahid still needs to be able to taste quite a bit because it's going after a larger number of plants, peas and lentils being two of the biggest. But you can see that there's now a switch going on and that the number of GRs is a little bit closer than the ORs were. This is also very common among comparing specialists and generalists. And so we were able to back it up with the aphids. And I just wanted you all to know this happens with pretty much any insect that is out there. The number of IRS or ionotropic receptors I'm not going to be discussing during this presentation. There are 19 on each of them, but the total number of receptors are 184 for the PAHID and only 126 for the soybean aphid. So in order to analyze these, this is going back to the presentation number three. So what I have here is these are actually some of the OR spectrums that I calculated for the soybean aphid. Now, the soybean aphid only has 46 ORs, and in here I've only put 15 of them. But these are 15 odorant receptors for the soybean aphid. I don't have the rest here due to space, but this kind of gives you an idea of what I've been looking at for the past six years. I'm sure a lot of you feel sorry for me, but this is, this is what I see all the time. A lot of black and white spectrums. Things do get colorful though. I'll show you that in just a second. But when you're taking a Look at these 46 spectrums, looking at them individually has a limited applicability to them. It's really become much more interesting once you combine all of the gustatory receptors. And we were able to show that before in presentation number three when I talked about combining the CO2 receptors. And we're able to play these games as well for the soybean aphids. So I can take all 46 of the odorant receptor spectrums and, and analyze them and get a common peak. So this is the common peak. So if you want to wanted to know what APHIS glycine is smelling, there it is right there. That, that major peak right there is really what they are keying in on. There are two other peaks which are certainly more minor than the major peak, but they' because they're actually shown on this graph. Otherwise anything that's not really, really common disappears from this particular analysis. And then we have two really, really small peaks. You can barely see them. But there's a total of five peaks on this spectrum. One big one, two medium sized ones, and then two that are very, very tiny. And this is also another way to analyze them. In addition, I can bring all of the peaks together and analyze them by adding up all of their peaks and seeing which of, I'm sorry, which of the odorant receptors, what are they really keying in on as a group? So I can do the major peak which is on the top, and then I could take a look at all of the peaks on the bottom. So those are two different analyses that I can do. So let's start with the first analysis, sugar detection in aphids. Fact, aphids feed on the phloem tissue, which is the superhighway system in plants that transports sugar. I'm guessing that most of you are aware of this fact already. And so the fact that aphids are feeding on the phloem tissue means that, you know, with the massive amount of sugar coming in, would suggest that they are detecting and tasting sugar. But you're going to need a little bit more than that, because I got a question now. While feeding on the phloem tissue, do the aphids prefer sucrose, glucose, fructose, maybe galactose, maltose or maybe some other sugar? You don't know? It'd be kind of nice to know because you can get these sugars in the phloem tissue. So that would be useful in order to know that. The second question is, do they prefer monosaccharides to disaccharides or vice versa? That would also be good to know as well. So to begin this analysis, what I'm going to use, I'm going to choose to use glucose as a standard because it is the standard sugar. And these standard peaks, these diagnostic peaks for sugars include 29, 20, 30, 30 and 9900. These three peaks you can find in all sugars. So I'm going to be looking for these peaks just to make sure that I'm on the right track. And then once I find these three peaks, I would zero in on exactly what sugar it may be keying in on. So I'm going to look for the 29, 20, the 30, 30 and the 9900 peak. Here is the first analysis. This is a composite graph of all of the gustatory receptors of the soybean aphid. There's an N of 61, if you remember. And I'm going to turn your attention over to the right side of the graph. Remember, I was looking for 29, 20, and you can see at about 2900, there is nothing. There's no major peak, there's no minor peak. At best, I'm getting a blip. So the first peak is not there. The first peak that I'm looking for for sugar is not there. But I continue the process. The next one I'm looking at, this is now a far IR analysis of the soybean aphid. This is still the gustatur receptors, we're still at an N of 61, but we're now in the far R IR range. And I'm looking at the various peaks and I'm looking for 3030 at first. And the 3030 is tiny. It's way over here. It's not even labeled because I didn't have room to label it. Small peak. Coming in at a height of about 30 is the 3030 peak. So it's small. Looks like they can taste sugar, but it certainly doesn't look dominant as compared to some of the other peaks. So it doesn't look good. The 9900 peak. If I scoot over here and look between the 9480 and a 10,476 peak, it doesn't exist. So the 9900 peak also doesn't exist. Well, now I have two out of the three peaks which are not here. Among my analysis of the gustatory receptors, the taste receptors, where I would expect to find them. True, I do have one sugar peak, but it's small. So two are non existent. One is small. Things are not looking good, so I'm not impressed. However, I do know that aphids are known to feed on low brix plants corresponding to low sugar. I just mentioned that earlier in a slide and that they're going after three to six brix plants. So because they're going after low brix plants, maybe this is the part of the reason why it's not that important. Or maybe they just need to detect low levels and it doesn't need to be that good. So let me take a look and do another analysis. I'm now going to bring in plant SAP analysis is what we do here at aea. I know, I think all the consultants are listening in on this right now. But the sugar concentration in soybeans and we're taking a look at the plant SAP data, which is an extraction of the phloem and the xylem tissue, the superhighway system of the plant. It is not the entire leaf that we're doing here. The leaf brix readings that I did crush up everything, Whereas this is looking at the superhighway as I mentioned. And so because you're only looking at part of the leaf, the brix readings are going to be lower, certainly lower than the three to six that we look at. And the reason why is because it's not including, for example, the sugar that could be found in the epidermal cells. It's not including the sugar found in the Mesophyll cells, the spongy layer, it's not getting any sugar, which could be in the. In the apoplast. So it's only looking at the phloem and the xylem and the ideal range, as reported, we're looking for a 1.1 to 1.8 Brix within the plant SAP data within the phloem and the xylem tissue, the mean being 1.45 brix. If we take a look at the actual data, and I measured 741 samples, the actual data for a soybean plant, for the plant SAP data is 0.65 brix. So this is severely lower. I would prefer, as a matter of fact, I would prefer something above 1.8. I really would like to see something at 3 or 4. 3 or 4 brix for the phloem. And the xylem is actually pretty good, but you can go higher. I've seen six and sevens from that. It's certainly not going to get up to 14 Brix, but those are the leaf brix readings and I do want to differentiate that. But here we're sitting at about half a brix for the soybean plants. So you can see we're dealing with low sugar. And this goes back to what I said before, how the soybean aphid is going after lowbrix plants. And here we now have further evidence that the sugar flowing around the phloem and the xylem tissue is also quite low, at least lower than it should be. So we've got additional evidence that the sugar is not that high. So if the aphids are known to feed on low brix plants, corresponding to low sugar, what exactly is going on? Well, there's several things going on. There's still a massive sugar intake because these aphids, when they're putting their mouth parts into the phloem tissue, are taking in a massive amount of sugar. Not because there's a lot of it, as I just mentioned, but because they're going to have their mouth parts in the leaf for an entire day, two days, three days, they can go on for a long period of time, constantly taking in the phloem tissue, the intake. And so therefore a lot of sugar comes in, but most of that sugar is passed out the back end in the form of honeydew. So if any of you have ever parked a car underneath a tree with a lot of homopterous insects feeding, and then you're gone for a few hours and you come back and your car is Just covered with sticky dew. That's because hemopterous insects are in the tree and that they are feeding and they're just throwing out a lot of the sugar from their back end. They do not use the sugar. And that is interesting and kind of key too, because right now I have no choice but to tentatively conclude that aphids are not very good at detecting sugar. This almost sounds counterintuitive because they feed on phloem tissue, which is where the sugar is, and yet they also, based upon the fact that they're going after low brix, we've got low brix in the, in the highway, and that they can't even detect sugar, at least not in a very significant way. I have no other conclusion to draw right now. But this does beg the question, then why did I go through this? I mean, why, why did I show you that aphids don't seem to be interested in sugar? Exactly what are they interested in? And a lot of people are watching this do know the answer to this already, and that is nitrogen. Nitrogen concentration in soybeans. Now, if I take a look at the plant SAP data again for soybeans, and I take a look specifically at the total nitrogen concentration in the soybeans, I see that the ideal range, they often give us ideal ranges are going to be between 1589 in 1975 parts per million, with a mean of 1782. So this is what you'd be looking for in a, in a soybean plant. This is the suggested ideal range that you would expect, but the actual number is higher, not surprisingly. So again, with 741 samples, the actual average is 2049 parts per million. It's not much higher than the ideal range, but clearly it is. It's more, it's even higher if you consider it against the mean, the mean being 1782. So you can see that there's a significant increase in nitrogen in the soybean plant and that quite possibly this is what the soybean aphid is keying in on right now. At least that's all the evidence that has been not only surmised in the past, but also in many of the scientific papers, is that it is all about nitrogen. Well, if it's all about nitrogen, that also isn't really helping us too much because there's a lot of nitrogenous compounds out there. So which ones are we referring to? Well, we've got nitrates, That's a big one. We have nitrites, we have nitriles, we have ammonia, we have ammonium ions, we have amino acids, we've got polypeptides and proteins, we have amides and we have amines. So we've got a lot of, of nitrogenous compounds. So this isn't really going to help the analysis until we can zero in maybe on what they're going after, or maybe they're just going after all of them, but that's not even all of them because there's also another list here, from isocyanates all the way down to amine salts. All these are nitrogenous compounds, are not as common as the ones on the left, but they're there and they, you know, the aphid might be detecting these as well. Well, this, when you look at it, looks overwhelming as to how to begin to start analyzing all these nitrogenous compounds. So because it's overwhelming, there are a few different ways in order to quickly get to an answer. And so what I'm going to do right now is I'm going to look. We're looking at the composite graph of the soybean aphid. I showed it to you before. And as you can see, I've got some major peaks that I want to zero in on. Take a look to see if I can decipher what they are in order to give me a clue as to what the soybean aphid is tasting. Because this is what the soybean aphid is tasting. It doesn't look like it, but I know that this is what's going on. So one of the first things that really draws your attention, it does for me, and it does for most people, are the three peaks that are off to the right. It's not a big deal to deal with them though, because they are quite simply water peaks. Water peaks are the most common peak that I run into with all of the analyses that I've done with all the spectrums that I have looked at. Water peaks are by far the most ubiquitous. You will find them because every insect in the world has an interest in taking a sip of water or finding a high humid environment. And so water receptors and water peaks are found all over the place. And here we are taking a look at three of them right now. So it's not something I want to focus on because we're not looking at the water. But I do need you to be aware that water peaks are there and everywhere and they sometimes can get in the way and they do need to be sometimes filtered out. But that's not the biggest peak. The biggest peak clearly is the 10,476 peaks. So let's take a look at that peak and see what the deal is. And here we have an ammonia infrared spectrum. So I'm interested right now. What do we have here? I have three major regions of absorption in the infrared region for ammonia. The first one off to the left is not that big as a nice sharp peak, though, somewhere around, you know, 3,300, 3,400. And then you've got a much bigger area right here, right around 1600, where there's a lot more absorption, especially the side peaks. But the thing that really dominates the graph is the one off to the right. One off to the right contains two major peaks, really a doublet peak. And those two major peaks, the doublet peak, also have additional absorption peaks off to the side. So there's a considerable amount of action going on in this particular region. So because I've got a double peak right now, it's not really quite clear exactly. You know, do I want to look at one of them? Do I want to look at both right now? Let's just look at the middle. So we've got two major peaks right next to one another is this peak or this region that I want to focus on. And the midpoint of that region is right around, give or take, about 10,471 nanometers. So there is a connection now that I have between ammonia and the major peak that the soybean aphid is keying in on right now. Just to mention it real quick, there, the other peak right here, the medium peak over here to the left, which is about 1600, is coming in at just over 6100. And that almost coincides with the 6096 peak here. So I've got a potential two peaks that are focusing on ammonia right now. Two major peaks focusing on ammonia. One of them definitely looks like it's focusing on ammonia. The other one seems to be a little bit off. I'm going to bring up that peak again a little bit later. And so we have some preliminary evidence right now that it is ammonia that they're keying in on. Well, what about the soybean plant? We can take a look at the plant SAP data. We have a massive amount of data just in the soybeans. We've got 741 that have been handed over me to me to analyze. And I've taken a look at the minerals, elements, or various properties of the soybean plants according to the plant SAP data, and almost all of them are within expected values. So Molybdenum boron, zinc, manganese, iron, silica, phosphorus, chloride, magnesium, calcium, potassium, as well as electrical conductivity and the ph are all within what we call is expected values. Might be a little high, might be a little low, but it's within that ideal range. So we're not. Nothing is really jumping out, at least from this group right now. If we take a look at the mineral element properties of ones that do deviate from the expected values, we can see that aluminum is coming in at a 361% over what you would expect. Cobalt 175% over what you'd expect. Copper is 77. It's got 77% of what you would expect, meaning it's deficient. So it's actually a negative value. And that's why I have it in red in parentheses. So the copper is deficient. Sulfur is 119% of what you would expect. The total nitrogen is 115%. So that's also high. We discussed that briefly. We've got some extra sodium going on in there, probably from the high salt fertilizers or the high salt pesticides. The sodium levels, not surprising, are usually high. We've got 207%. And the total sugars, as I also discussed with you before, are also deficient. They're about 45% of what you would expect in the, in the soybean plant. But what about ammonia? Ammonia is coming in at 2,356% over what we would expect to find. This is nowhere near anything else that I put up there. It's blowing aluminum away and that was probably impressing some of you before, but the amount of ammonium in the soybean plant is ridiculously high. So we now have even more evidence to show that it is indeed the ammonium, the ammonium ions that the, the aphid is keying in on. And just for those of you who like numbers, the ideal range for ammonium should be between 10 to 30 parts per million. Our actual values are coming in at 471.1, with our N of 741 well above the levels. And remember, this is the actual and the average value. I've got plenty of values over 2000 parts per million among the soybeans. So it does get higher. This is just the average of 471. As a matter of fact, not a single one of the soybean plants of the 741, not a single one was below 30 parts per million. So not a single one reached the ideal range, which is very Unusual, everything was above 30 and the average was 471. So this is potentially dangerous if you can get up to 2,000 parts per million and beyond. Nevin and Lovat in 1987 demonstrated that toxicity can occur. And so now you've got a toxic situation in the soybean plant, which means it's unhealthy, it's having difficulty regulating that and the plant is in trouble, which helps to explain the lowbrix readings as well as the low sugar that is going on there. So when you do have an ammonium situation, the plant can step in and do its best in order to control the situation. Oftentimes with an ammonium high levels of ammonium, you will. Many of the plants will produce amine salts. They will convert the ammonia into an amine salt in order to prevent the toxicity, which will revolt if that much ammonium is present in more of a free form. And these amine salts correspond to the 3557 and the 3325 peak. So we do now have evidence not only for ammonia, but we also have evidence that the plant possibly could be compensating for this by producing some amine salts in order to help keep the control down so that it continues to grow. And obviously the situation is getting more interesting. Interesting. What is going on? Let's take a look at the plant SAP data. Again, if we take a look at the plant SAP data I've mentioned, you know, some of these are within normal parameters, within the desired range, within the ideal range, but they're not really. So if we take a look at boron, zinc, manganese, iron, silica, molybdenum, they are within the desired range. Every single one of them is within the desired range, but every single one of them is on the low end of the range, not quite deficient, just on the low end of the range. And so those six, because they're low, means the plant is also suffering. It is weakened and therefore weakened plant is not going to be able to do what it's supposed to do, which is photosynthesis. That's the goal of every plant. So we've got. I wouldn't call them deficiencies, though, but we've got problems because we certainly don't have an excess. And it would be nice if we had a little bit more boron and a little bit more zinc, for example, in our plant. An exception down here, as you can see, is copper. Copper didn't make it. It is truly deficient. It didn't reach the minimum of 1.16. I certainly would have liked 1.43. I would have liked 2 parts per million would have been fine. I'd been happy with that. That would have been plenty of copper to keep the plant going. But it's not. It's at 1.00 for the mean. And so we've got a situation right now. We've got low levels, some of these. And if you take a look at zinc and iron, for example, and manganese, they often exist in a plus two form. Copper is often found in a plus two form. These are divalent cations. And for those of you who probably know where I'm going with this, if soybeans are 92 to 94% GMO, that means they're being sprayed by glyphosate. And glyphosate removes divalent cations and it holds on to them and it chelates them. So shortages of zinc and manganese and iron and copper are not uncommon. When there is a massive amount of glyphosate, which is being sprayed because glyphosate is fantastic, nothing chelates like glyphosate. It is much stronger than many of the other pesticides. Almost all the pesticides are chelating to a greater or lesser degree, but glyphosate is the best. And so now we've got some shortages right now. And this does seem to be affecting the plant. Well, how is it affecting the plant? If I give you just a generalized overview of the nitrogen cycle in plants, it begins with elemental nitrogen, the nitrogen which is found in the atmosphere and that is converted by, in the soybean plant, it's going to be converted by rhizobia in the nitrogen nodules into ammonia. And then the ammonia will be converted into nitrites and the nitrites will be converted into nitrates. Once we have the nitrates, which are often the form that fertilizers are placed into because we've skipped several steps, the nitrates can then be turned into amino acids and the amino acids then in turn form the actual proteins, the complete proteins which we're looking that are indicative of a healthy plant. So in order to get from one step to the other, you're often going to need some of these, these cofactors, these minerals that we just discussed. So cobalt, you can't go from elemental nitrogen to ammonia without cobalt. Cobalt is required of rhizobia and it's also required of the two other major types of nitrogen fixing bacteria. So the ones that could be found in the soil, the free living ones, as well as the endophytes that are not part of the nitrogen nodules. They're all using cobalt. So you need cobalt in order to make ammonia. Otherwise you're going to have deficiencies, and we've been able to show that. But that's a story for a different. A different time. Now, to get from ammonia to the nitrites, you're going to need copper and you're going to need iron. I just mentioned that iron was at very low levels, but not quite deficient. And I just mentioned that copper is actually at deficient levels. So if you don't have enough copper and iron, and we don't in the soybean plant, then you're going to have some difficulty converting the ammonia over to the nitrites. Therefore, it's really not surprising that we have an ammonia sink. If the ammonia is being produced by the rhizobia. We do have enough cobalt. An ammonia sink could develop if it is not able to be quickly converted into the nitrites, which then are converted into the nitrates, which are more stable. And so we're going to have a plug, so to speak. And this plug could cause an ammonia to build up to possibly 471 parts per million, because that is what we have observed. This is a possible scenario and a possible problem that we have with the soybean plants, as well as the soybean aphid, just taking advantage of it. Manganese. Nothing is chelated more by glyphosate than manganese. Manganese gets first dibs. It will go after manganese before it goes, even after copper or iron. So manganese. It's good to take a look at the manganese levels and you kind of like to see what's going on. And because I had just mentioned that we've got ammonium problems in the plant, I've got a graph here, taking a look at the high. The low to the high levels of ammonium in a plant and looking to see what happens with the manganese. And we can see that there's a relationship there. As the ammonium levels increase to dangerous levels, we're now hitting 2,000 parts per million or higher. You can see that the manganese levels are low, too low. They're below the acceptable range that we should find in a soybean plant, which is between, you know, roughly about 7 to 13 parts per million. But not only do we have deficient amounts here, but take a look even at the first figure, when the ammonium levels are below 100, which doesn't sound that bad. We still don't have excess in manganese. We've got a manganese problem. It would be nice to have manganese levels above the acceptable range to start, because then as the plant starts to use them, there is a possibility that they could get used. And sometimes chelation occurs. I get that. But we're not even starting with an excess. We're starting with something which is a little high in the acceptable range and then quickly falls off as ammonium levels increase. This is more of an indication that we're dealing with a problem. The plant is suffering. The ammonium is a problem. It's an inverse relationship here. As ammonium increases, manganese is decreasing. And so this is something that, you know, many of the AEA consultants need to be aware of. All right, let's switch gears a little bit. Talk a little bit about sulfur. Sulfur. So I've got a number of proteins here, proteins that I've analyzed over the past six years. And I've got the sensory neural membrane proteins 2B, which I talked about in the last presentation. Olfactory receptor 56A, Bombyx mori. I got a pheromone binding protein A, Papilia japonica, which is the Japanese beetle. I've got the gustatory receptor 2 of Aedes aegypti. I've got an ionotropic receptor, one of the India meal moth, Palodea interpunctella. So there's obviously a lot here. These are all proteins. And every single one of these letters is an amino acid. So some of these proteins are huge. The ionotropic receptors often boast 900amino acids. These are big, big proteins. The amino acid itself is not a small molecule. It's composed of many atoms already. But there is something which kind of connects them all, and that is they all begin with methionine. Methionine initiates virtually all of the proteins on planet Earth. It is only one of two amino acids, and there are 20amino acids, sometimes 21 to 22, depending on how you want to count them, that have a sulfur atom. Methionine is one of them, and methionine begins all of them. So I think you can see here that if every protein is beginning with methionine, you need to have enough sulfur, sulfur, otherwise proteins will not form correctly, and they will not. And you will then have fragments of proteins rather than the real proteins. So you need to make sure we have enough sulfur. Now, fortunately, we do have enough sulfur, because we had mentioned that before. We said that the sulfur is slightly in, in excess. So that's a good sign. But it goes beyond just methionine. It also goes to cysteine. Cysteine is the other amino acid that contains the sulfur atom. And the cysteines are important too, because of the cysteine bridges, these proteins. You can see I've got a representative protein off to the left and it looks incredibly convoluted and complex. That's because it is convoluted and complex. And all of this twisting and something going on, the alpha sheets, the beta sheets, the twisting and the turning, all based upon electrostatic interactions, et cetera, et cetera, is based upon, in part, how the amino acids are arranged and then they actually form bonds in order to solidify this complex shape. And so it will fold back upon itself and then rebound to itself. These are called cysteine bridges. So here, off to the right, I've got a demonstration of amino acids all in a row. And the cysteine bridges are being connected to one another through these sulfur bridges. This, these cysteine bridges help form a complete protein and allow it to form in exactly the way it is supposed to be formed. And so that's what you're looking at right there. So cysteine is absolutely relevant to a complete protein. Methionine is absolutely irrelevant to a complete protein. So we need sulfur. And if you're going to be completing a lot of proteins, and the aphids are making a lot of proteins because they're producing young at a very rapid rate. They're the only insects, the only animals on planet Earth that are born pregnant. So they can really produce young very, very quickly. And they are going to need sulfur. So the ideal range for sulfur and the plant SAP Data is between 151 and 199 parts per million in soybeans. And not surprisingly, we do have an excess. We have an excess. So the soybean aphid is going to be looking for an excess of sulfur. If it doesn't have that, it's not going to be able to produce the proteins in the way that it should and it will suffer and it will not be able to produce young. So we do have an excess of sulfur in there. It's not a huge excess though, but it's definitely an excess and that's what the aphid is going to be looking for. So what's the deal with sulfur? Well, sulfur has a very well known peak. The most common peak is at 2550 wave numbers, which corresponds to about 3920 on this. And if we take a Look at the PA FID right now, the Pahid does have a 3900 peak. It's a little off because it should be around 3920. So this one's at 3965. It's suggestive of the fact that the pahid may be able to key in on, on sulfur and therefore the sulfur compounds that are out there and so should be able to possibly taste it. However, if we go to the soybean aphid, it's not the there. The 3900 peak really doesn't exist. You can see that's a little small one right there, but it's not very big as it was in the. In the pahid. And even though the pahid might have been a little bit off, it just doesn't exist at all. And so this would seem to suggest that the soybean aphid cannot detect sulfur and that maybe the pahid can. But for those of you who are involved in spectroscopy, you know that there are more than one peaks in order to play with. So I want to focus your attention on 7000, 408. The reason why I want to focus on this is it's an interesting peak because there's nothing before it and there's nothing after. It kind of sticks out. So other peaks often have, you know, peaks close by. This one does not. So the 7408 peak is sticking out, and there's really nothing on either side of it going from practically 6,000 to 9,000. So. So what's the deal with the 7,408 peak? What does it correspond to, if anything? Well, it corresponds to four sulfur compounds. It corresponds to sulfonates, sulfonamide, sulfonic acid, and sulfones. So I put that star there to show that there actually is a possible ability to detect or taste these four sulfur compounds. There are two down here that it doesn't correspond to as well, the sulfates and the sulfonyl chlorides, where the peak is a little bit off 7,000 to 7,200, which is a little bit off of the 7,400. And so I would simply declare those as being negative. They wouldn't be able to detect those. So clearly there is the possibility that sulfur could be detected by the soybean aphid by a back door rather than that common 2550 wave number peak of 3920 that I discussed. But the sulfate issue is interesting too, because the sulfate also has several peaks. I just talking about one peak Right now. But the sulfates are the usual sulfur compounds that are found in moving around insects and plants and that type of stuff. And so if you take a look at the other sulfate compounds, we do run across two more. The 9,480 and the 11,650 do correspond to sulfate compounds, according to Cabassi et al. In 1978. And so we've got the possibility right now with the 7408. We've also now got the possibility of the 9480 peak contributing, and we've now got a third possibility, the 11,650 peak, also contributing to sulfur detection. So we've got three possible peaks. I wouldn't call them smoking guns right now, but it is interesting that they are there and that there is this correspondence because the soybean aphid does seem to be possibly working through a backdoor in order to detect sulfur compounds which are important for its life. So let's take a look at these peaks again. On the pahid, I had already mentioned that there was the 3965 peak and that maybe the pahid does taste sulfur. But if the assumption that the 9,480 and 11,671 peaks are associated with some type of sulfur peak, specifically a sulfate, you can see that the 9480 peak is actually two and a half times higher than it is in the soybean aphid. The 11,670 peak is also two and a half times higher than it is in the soybean aphid. Of note, you can see that the ammonia peak has dropped considerably. It's now halfway, I guess you could say in between the 9,480, but they live in 671. But it may not be detecting ammonia as well as the soybean aphid, though, but it looks like it can detect it. And now it looks like we possibly have an elevated response to sulfur. If you take a look at the plants that the pahid attacks, peas, lentils, and the others that they attack, do they have high levels of sulfur in them? Not only do they have high levels of sulfur in them, but they also have high levels of sulfur sometime in the reproductive parts of these plants as well, which are sometimes gone after by the pahids. So this is suggestive information right now, but it is possible that the pahids that we're able to zero in on possible sulfur receptors, you can see it has a decrease in the 7407 right now. But these two have gone up. And this is sometimes how it works with insects. There are back doors in order to smell things, and sometimes peaks can take the form of deciphering, sorry, not just one odorant, but even two odorants. Alrighty. So along those lines, if we take a look at the IR spectra proteins, and I don't expect any of you to do this, they are incredibly complex. So proteins have a highly complex IR spectra. And just look at them. I mean, look at how convoluted and twisted they are and the massive number of atoms that they have. So weighing it all in 2005 will, you know, talk about how complex these things are and how it's difficult to see almost anything in them. There are some indicative peaks, though. And it even gets to be even more complicated because it's 1999 paper showing that complex proteins can even adjust the already existing absorption frequencies to a higher frequency. So that just makes me throw up my hands and discuss thinking, wow, this is way too complicated. I can't really, really deal with this right now. And this is, this is a complete protein. A complete protein is a complex protein. But what is an incomplete protein? Well, an incomplete protein has less amino acids, a lot less amino acids. So I've got an amino acid 1 and amino acid 2, just two imaginary hypothetical amino acids. And you bring them and you form a peptide bond between them. And that's how amino acids come together in order to form these complex monstrosities that you see over to the left. Well, the peptide bond is indicative of this, of putting proteins together. This peptide bond is difficult to see within the complex spectra that we have over here. But the peptide bond is relatively easy to see if you're dealing with a dipeptide which has only two amino acids, a tripeptide which has three amino acids, and therefore two peptide bonds, as well as even a pentapeptide, which has five amino acids and therefore four peptide bonds. And so to see the peptide bond is going to be a little bit easier when you're dealing with broken proteins. And so what is the major frequency for the peptide bond which you're not going to be able to see in a complex, but you can see in the simple one? Well, that comes in at 6,098, 6,098 nanometers. And that just coincides quite nicely with the 6,096 protein that we have. So even though a single peak, which is very high in the soybean aphid, could be detecting ammonia, as I suggested earlier on, it's very close to the 6100. It could also be detecting the peptide bond. The peptide bonds are indicative of broken proteins. I had mentioned in some of my previous talks that insects like broken proteins, they cannot digest and they cannot handle complete proteins. Now we have some preliminary evidence to show that a broken protein via the peptide bond, which is going to be much more visible and discernible if they're broken rather than being in a complete protein, is almost exactly what you'd find 6,098 versus 6,096. And so there's now some evidence right now that the soybean aphid can detect a peptide bond which for our purposes certainly as an AEA consultant is suggestive of the fact that they are now detecting broken proteins in a plant. And this also helps to explain why the soybean aphid is going after low brix plants. So and so let me just do the calcium real quick. Calcium, the normal range plant SAP data 1600 to 3300. In the young leaves it's at 1300 which deficient with an N of 456. In the old leaves it's not deficient but it's not that high. It's a 2295. Certainly like to have something at 3000 or even beyond that would be nice. And that's an N of 353. Calcium is an aphids enemy. Calcium has the ability to plug up the mouth parts of an aphid. There has come some complex biochemistry going on that the aphid is able to overcome. And one of that is to make sure that it sucks from a low calcium leaf. Aphids for the most part go after the young leaves, the flush which is at the top. As we can see in soybean the young leaves have far less calcium 1300 compared to 2200 or even 2300 if we round it. And so there's a lot less calcium. And this is part of the reason why the aphids are going after the young leaves. They will move around and check out different leaves as the.
More from John

Episode 186: The Power of Precision Management and Multi-Species Covers with Mike Thompson



Podcast Extra: John Kempf on Soil Biophysics, Plant Immunity & Foliars on the Permaculture...