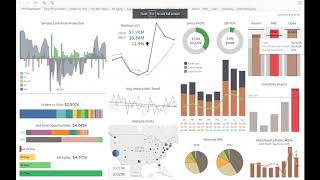
Recording of a DataSelf AI power-user training (session 1) introducing reports and dashboards basics. The instructor (using DataSelf version 10.3, web UI) demonstrates logging in, setting a landing page, and previews a CFO dashboard built from ~11 data sources to illustrate interactive reporting possibilities and motivate learners.
Chapters
Thank you for joining our Data Self power user training. This is session number one where we're going to cover reports and dashboards 101. This is our agenda and the goal again is to cover the very basic functionality in order to build new reports and dashboards from scratch. I'm going to be using the version 10.3. However most of the techniques I'm going to be covering here also work across a wide range of versions all the way back to 9.3 and several others. I'm going to be using the web user interface as for power users. However, about the same ways I'm going to be doing here can also be done using the desktop client. This training is actually designed mostly to give you the fundamental techniques regardless if you use the desktop client or the web power user client user interface. What I'm going to start is actually showing you a little bit about logging to the server and give you a glimpse into the possibilities of what we want you to do and as you learn and you become really self sufficient in building these reports and dashboards. So let me show you the possibilities before I go into the actual techniques. I'm going to go to my local data self analytics server. In your case, you should know what the URL to your own data self analytics server should be. So go to that URL, put on a web browser and enter your user credentials. In most cases is your Windows authentication user you know is a username and password that you use to log into your Windows machine. Most of the time the times that's the same thing. So enter username and password, click sign in. In my case here, one thing that I have done and a lot of the users do is they pick a landing page that when you log into the system it will go straight into it. So pick any landing page and then you go to your name here, click the arrow pointing down and say make this my start page. From that point on, every time you open it you'll start with this landing page and anytime you can change to something that is more important to open anytime. So be sure to use this feature. It's very important and very popular. Now in my example here I want to give you a little glimpse of the possibilities and let me put this CFO dashboard in full screen mode. This dashboard is actually from one of our clients where the CFO built from scratch this dashboard about six months after they started working with Data Self. So it's not something you're going to be able to do right after today's session. No. But in the course of the next weeks and months. If you invest your own time in learning, you know, these navigation techniques and additional materials available, you should be able to do it yourself. You should be able to build things, things like this. This dashboard is something the CFO opens every day. You know, opens the dashboard and pops up. He has here on the top left, a cash flow projection. He's combining receivables with payables, payroll amount of money today. So he has all the current money inbound, outbound money. In putting all of these numbers together, he gets what the project projection, cash flow for the next 60 days. Very simple, very, very informative dashboard. This whole dashboard has many different sections. It brings data from about 11 different data sources. There is AP, AR, GL, inventory, revenue, sales, Google Analytics data. It's a lot of things brought together and it's a very interactive dashboard. Let's say if you come to this inventory assets red being something bad, and he clicks on it, it goes to a different tab of this whole section showing this case, more specific information, all very interactive. So he pretty much built this by himself. Again, he said it took about 16 hours of his time to start from scratch, thinking, putting together, experimenting, making, cleaning, and eventually coming up with this. So yes, it took some hours, but he decided to do himself because he said he had the vision of coming up with this and if he would have to tell someone else to build a dashboard for him would take so much longer. And he was excited and he's very happy now that he has all of these things done for, for him. So anyhow, this is just to give a glimpse of possibilities and I want to inspire you that in a few weeks or months, you also be able to build something as informative, as clean and as kind of sophisticated as this dashboard. So let's move on to the next part of the training.