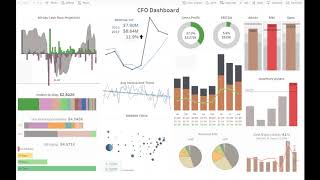
A DataSelf power-user training session (presented by Johnny Giorardi) introducing "Reports and Dashboards 101" for web and mobile users. The session covers basic authoring techniques for creating reports and dashboards (demonstrated in DataSelf/Tableau v10.3) and shows an advanced, multi-source CFO dashboard as an example of what's achievable with practice. Materials (recording, PowerPoint, workbook) will be shared for hands-on follow-up.
Chapters
Good morning everyone. Thanks for joining us. This is Johnny Giorardi with dataself. We'll talk today about data self power user training covering primarily what we call Reports and Dashboards 101. So the idea here is, let me switch the page is to show how power users, power users in this case are users that have access to the web user interface, web and mobile user interface in how you can actually create new reports from scratch and dashboards and learning the very basic techniques to do that, to build for yourself as well as to share with other people. This is the agenda. We will be covering many different pieces of the puzzle. Again, the most fundamental techniques. I'll be using the latest version, which is version 10.3. However, most of the features I'll be showing in the techniques apply to way back 9.3 and newer and sometimes even older. Later we will be sharing this training on a web recording. I'll also be sharing the workbook that I'm going to be using in this training. So if you want to practice later on using the video, you can, you have the video, you have this PowerPoint as well as the workbook to practice exactly the way that I'm doing things here. And by the way, a lot of the techniques I'm going to be covering here are also applicable for users who have the desktop. With desktop you can do even more things, sometimes simpler, but the basic techniques between the power user interface in the desktop user interface or very, very similar and tableau is slowly but surely pushing a lot of these authoring features into the web. So eventually I believe they will discontinue the desktop. So that's the long term goals. Now before I start, I just want to show a glimpse of the possibilities. I'm going to show you a dashboard that actually was created by one of our clients. The CFO of one of our clients actually built this dashboard from scratch just to show the interactivity that is available once you learn these techniques, just very quickly. It's a CFO dashboard. However, it brings data from more than 10 different data sources. In this example, there is AR data, AP payroll cash on hand, projections, open sales orders, CRM information, your aging revenues, Google Analytics financial numbers inventory on hand. There's a lot here. The cfo, when he built this dashboard from scratch, it was after six months having data self and doing a lot of things with data self. So it takes a while to build the techniques, to learn to do something like this. But it's not a lot with the basics you can actually create many of these components. I usually tell people, today I'm going to get you crawling. Eventually we want you to get walking, running, and flying. I would say the CFO was probably between the walking slash running, you know, expertise when he built this dashboard from scratch. In very interactive. You know, you can come here. Let's say I click on this bar, it drills down into a different tab of the whole section, giving a different perspective. And as you put the mouse over things, it's all interactive. It's less enticing and whatnot. So just very quickly, this is a glimpse of where we want to, to go and being able to do these things all by yourself.