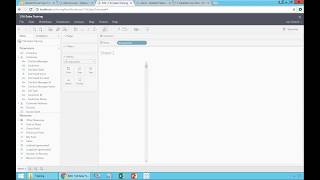
Learn how to use Tableau's Data tab to build reports by dragging Dimensions and Measures into your view. The demo shows how to inspect field definitions, explore unknown data by dragging fields to reveal values like Customer ID and Customer Name, and navigate between views. Contact your data administrator if you need fields added to the data source.
Chapters
Now if you are not familiar with this, so the first thing that you have to really understand, and this is the foundation of the whole slice and dice in creating reports from scratch, is having an understanding of this data tab here. It's called the data source. Right now I'm connected to this data source. You could have several in your system. In this case we only have one. But in this case what we see is dimensions and measures associated to this data source. The dimensions are entities that you want to slice and dice your data by. You know, I'm looking at sales, so could be customers, addresses, dates, products, salespeople, you name it. And the measures are typically the numbers that you want to aggregate. You know, the sales, the cost of sales, the quantities, the ratios and whatnot. Now in the out of the box solution we have typically in certain pieces of this data structure we put pop up windows to help you understand what this information is about. So if I put the mouse over percentage gross profit, it shows this little pop up where it is a formula that divides gross profit by sales. So sometimes it's helpful if you put the mouse over something to see there's an explanation or of what that particular data element is. If you do have the desktop user interface, you can actually edit these pop ups and even create new ones to help users more easily. And let's say being self sufficient at looking at things and understanding what these fields are about. Now sometimes you look at a certain entity here and you actually don't know. Even reading the details you still don't know exactly what that means. So let me just show an example here. Suppose I come to this list and I expand the customer list and I look at these names and let's say suppose, oh look at this, I have customer, customer ID and customer name. Why do I have three? What are the difference between them? A good recommendation is experiment. You might figure it out. Let's say if I take customer ID and I just drag and drop into my rows. I'm just dragging, dropping into my rows. I see here a bunch of codes. Of course if I work for this company, hopefully I'll be able to see. Wow, yeah, this is the actual customer id. Okay, that was pretty straightforward. Customer ID and I see this. Now suppose you want to see another field or you want to go back to the prior step. How can you go back to the prior step? Well, there's this back and forth buttons that work just like on a web browser. You can go back and forward as many steps as possible. So be sure that when you do something and you don't know or you want to go back, be sure to use the back and forward buttons. What is customer name? Drag and drop and we see customer name. Very obvious. Let me click back. What is customer Drag and drop and then if I know this business I could tell well customer is the one that combines together the ID and the name. Sometimes I remember the id, sometimes I remember the name. Sometimes this field is more helpful to I did more quickly find exactly a customer that I'm looking for. So by dragging and dropping quite often is very helpful to just, you know, figure out what piece of information you're looking out of this list here. The other important thing for you to know is suppose you go to a list, I don't know products and you want to find a field that you have in your, let's say ERP system or CRM system and you don't find here. Well if that's the case, usually you have to talk with your data self admin people, maybe with my team or with your reseller. And pretty much every time that you need something new listed on these data sources, it's just a matter of adding that information into the data self data warehouse and plug into this connector. It's a one time setup. You can add 1, 10, 50, whatever the number of additional fields. It's a one time setup. Once they are added you will be able to do slice and dice the data as we'll see throughout this training. All right, so let me just drag some, let me drag division here. Suppose I did a lot of drag and dropping and I'm putting, I don't know, company and just, you know, exploring things all over here. And suppose that you know, at one point you say okay, I got it now I need to start from scratch and I need to clean, I need to clear this whole sheet. Do I have to click, you know, back, back, back as many times as I click? Of course not. You have this button here with a little X. You click on it and you say clear sheet and you got a clean sheet to start from scratch. So this is a little overview of the data connector.