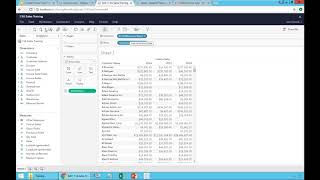
Build a sales report by dragging Customer Name to rows, Sales to values, and Invoice Date to columns. The date hierarchy lets you drill from year down to day with a plus button, and you can customize the drill path.
Chapters
So now let's go for the very first technique of actually creating our first query in the first query is going to show simply sales by customer by year. So I simply want to see a list of customers. I want to see sales throughout my whole history by year. As a guideline to build your reports and dashboards is pretty much you think about your question and you take each piece of it and you drag and drop it into the report into columns and rows. That's pretty much what you need to do is drag and drop in the kind of order that you're thinking your question. So let's say I want to see customer information. So I go to customer here. I'm going to take customer name and I'm going to put in my rows. So drag into my rows. There it is. I have a list of all my customers, just customer names and I want to see sales. Well, sales is part of my measures. The way that you drag and drop different of these data structures into the report might have different effect on how the report will look. So if you just throw somewhere, sometimes nothing happens. Let me see if I throw it here. Actually worked when I drag and drop the sales. Let me go back here to show when I drag and drop the sales into this ABC boxes. As you can tell, there's a square around this ABC box. If I drag and drop, I get the sales and actually this is the whole sales all company history by customer. Alternatively, I'm going to go back and take sales again and drag into my text box here. I'll have the same result. So if I drag and drop into that ABC area here or the text area here, I get to the same report. So right now a very simple report showing sales by customer in the whole company history. But I want to see by year. Well, by year I have to find invoice date. Invoice date is right here. And then I can drag and drop, let's say in my columns first, right there I get by customer, I have sales by year. Very straightforward, very simple. What if I drag and drop my. Let me go back here. So remove the invoice date and I'm going to drag and drop into my rows. What happens if I do that? Just like you expect on the rows you have customer, anyvoice date and sales. But no, I want to put in my columns. It looks better. So I'm going to drag and drop here into my columns. There it is. I have by customer, by invoice date. Very easy, very just point and click, drag and drop. Now I can explore and start to make variations pretty much every time that you see these spills in this right side of the whole query. If you see a plus signal it means you can expand or drill down into the next level of this data point. So in the year level if I click this the plus signal what happens is it drills into the next level which is quarter. So right now I'm seeing sales by year by quarter. If I expand quarter I go into the month level and if I click expand again I go to the day level. I could go to hours if I go all the way down to hours. Or we can build these buckets to drill down in any direction. We can even train you at some point in how you can build your own drill down capabilities coming from one point of the data to any other point in any combination of parameters. This is configurable. I'm just showing that that is possible and it's built in into the framework.