Learn how to save and publish Tableau reports to share with others, rename and duplicate worksheets to track your work, and apply basic filters like date ranges by dragging and dropping them onto your visualization.
Chapters
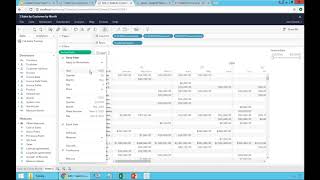
Okay, so suppose this report, you know, right now I have sales by customer by month. Suppose there's a report, you just want to save it and make it available to anyone else that is part of your of your user group. What you do is you come to file, click Save as I'm going to call one sales by customer by month. And then here you save in a given project, you can select different projects. For now, I'm going to save into my default and I'm going to click show sheets as tabs. For now, I'm going to leave this click and I'll explain later what this is about. And I click Save. And that's it. I just saved my first query. Now if I go back to the Tableau framework and I go to my projects and I go to the default project where I saved, I just saved and I do a sort by name. I right here see a query that I just saved. Everyone who have access to this particular project now would have access to the new report. So they would just click on the new report. They see all the worksheets that so far I only have one inside of this workbook. And by the way, I didn't rename it, so it's still called Sheet one. So I'm going to click Sheet one and there it is. I see the same report as I saved in my editing mode. That's it. Your first report published. Anyone that has access to your framework now has a new report. Now let's go further and for now I'm going to actually double click on the sheet name to rename it Sales by customer by month. So now the sheet will have a good name, a more descriptive name, and by default it will have the name here as the title of this sheet. Now, typically when you are building reports and dashboards, it's a journey, it's a process, and quite often you don't know exactly how it's going to look at the end and you have to experiment. And usually it's a good technique to leave a trail of what you have done. So if you want to go back to one of those points or be inspired by something you did in the past, you have this kind of trail of steps that you're going through. So right now, what I'm going to do to do this kind of trail of my discovery process, I'm going to go to the sheet name, I'm going to click on it, sorry, right click on it and I'm going to choose duplicate. When I duplicate, actually I get a new sheet with exactly the same content as the first one. So the first one is kept. It's one of the steps. And now I start to kind of mess around or experiment with my sheet number two. So now in this segment here for sheet number two, what we're going to do is filtering. Filtering is one of the most important features when you're building reports and dashboards. And understanding the basics is critical in understanding the possibilities is critical. So let's take a look at the basics of filtering. One of the most important filtering that people do is based on dates. So overall, what you do if you want to filter a query by date is you use drag and drop and you select different options. In my example, right now I have all years from 2016 to 2018 and my current year is 2017. But anyhow, I want to filter this report by year. So I'm going to take invoice date, I'm going to drag and drop into my filters shelf. When I drag and drop, it will show on the right this default approach of filtering, which is pretty much the whole range of dates available in your database. Quite often this format is not very useful, so you have different possibilities. You come to the invoice date in the filter shelf, you click this arrow pointing down and then you select a different time bucket to filter this report by. So in this case I'm going to choose year. And what happens is right now that filter changed into a list of years and you can say I only want to see 2017, so I'm going to uncheck 2016 and 18 and right now I only have 2017 information. That's it, just filter by a particular year. What if you want to further drill, you know, filter this by month or by quarter. Well, you can take invoice date and drag and drop again into the filter shelf. What's going to do is again select the same default approach. Now you go back to the pill here, click the arrow pointing down and say I want to see month and now I see the list of months and suppose I only want to see, I don't know, two months and that's it. So by using this drag and drop and selecting different the buckets here, you'll be able to build this stacked filters to narrow down your perspective into exactly the segments that you want. And by the way, in this particular example, suppose you don't need to see quarter, you just want to see year and months. You can take the quarter pill and just drag it out anywhere that you see the little red X on the pill. As you move around means you're removing out of the query and it's gone for good. So no longer in the query. So right now I don't have the quarter. Again with the quarter. And when I remove the quarter, the quarter pill is gone and is no longer here. All right, so let me put here sales by customer. I'm going to say this year, just for. I'm going to say in 2017, and I could say February and March, because this will be like a specific report showing those things. So very simple way of filtering that way.