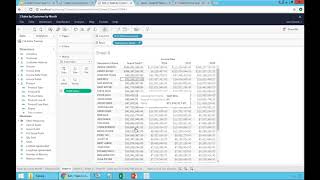
This is a short training transcript (DataSelf / Tableau) demonstrating how to sort tables in Tableau. The speaker shows simple one-click ascending/descending sorting via header icons, then demonstrates a multi-column case where clicking sorts by the grand total rather than individual columns. The clip explains the three-state toggle for column sorting (ascending → none → descending) and warns to be careful with totals and subtotals because they can change what is actually being sorted. The speaker uses examples involving salespeople, customers, invoice date, and a year (2017) comparison to show when top customers/rep rankings can change year-over-year.
Chapters
All right, let me duplicate this one to talk about sorting. I want to sort things now, and for simplicity, I'm going to remove the totals and I'm going to make this simple by removing also some of these extra things. And finally, I just want to see a list of salespeople. And I want to sort this. I want to show my top salespeople at the top of this list. How do I sort? Easy. We have those two icons. I'm going to sort descending what I just did. I put my top salespeople at the top and bottom. At the bottom. If I click ascending, I reverse the order. So sorting can be as simple as just using these icons. But more often than not, it's not that simple. So let's see an example here. I'm going to add my invoice date. Now I have three columns, and I'm going to sort in a descending order. Let me just click in descending order. So now I'm sorting in a descending order. But what exactly am I doing here? If I look, I'm actually not. None of these columns are actually sorting in descending order. It's a little. Okay, a mess. What did I do? Well, let me show what you did. I'm going to put the total for my rows. So this is the grand total for the rows. And what I did is I sorted this report by the grand total on a descending order. So I didn't sort by any of the columns. I just sorted in a descending order for the total. And until I put this grand total, I didn't understand what was going on. So be careful. When you do totals and subtotals and you have several columns of rows, sometimes you're not getting exactly what you expect. So pay attention. But what if I want to see. I want to sort this report by one of the columns. Let's say I want to see my top customers or top reps. In this case, in 2017, I come 2017, I put my. And I have this icon for sorting. Cool. I click Now I sort. This report is showing Ascend in 2017. I click it again. No more sort. I click it again. Now it's descending order in 2017. So once you have three status of the sorting. If you click once ascending, click again. No order. Click again. Is descending any of the columns. You can do that. So you select one of the columns and you do the sorting. This particular perspective is useful because you're looking at last year, how you're doing and how well you're doing this year. As you can tell, my top customer last year is not doing so well this year that could be a problem. So sorting things like this can be very insightful. All right, that's sorts. Let's rename this sorts of.