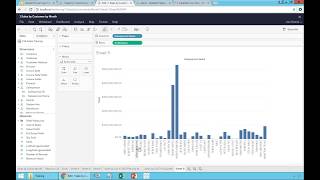
Learn to build basic charts in Tableau by dragging Salesperson and Sales fields into Rows and Columns, then switching between bar, treemap, and pie charts using the Show Me panel. Sort descending to surface your top performers.
Chapters
Let's go to charts, People who love charts. Let's start taking care of you now. So I'm going to build initially a very simple chart. I want to see sales by salesperson on a chart. So what I'm going to do is take salesperson drag to my rows and I want to see charts as part of my columns. I'm sorry, I want to see sales as part of my columns. When I take sales drag and drop into my columns, and voila, I have in my rows my salespeople. And on a kind of column approach, I have the sales. What if I actually. Now let me delete this sheet and do the opposite. I want to see my salespeople in my columns and my sales in my rows. So I have my sales people in my columns and the sales is shown on a road approach. That's another way to do it. Or I can also do the following. I can do sales. Sorry, I can do salesperson, my rows. I can put the sales as a number. So right now I'm seeing sales just using numbers. And I click the show me button and I start to explore these options. They are highlighted. Whatever is not highlighted, you cannot visualize in that particular format. But if I want to see as a bar, so tableau will automatically convert that into a bar. Maybe I want to see as this tree view. So right now treemap, what it does is the size of the box is proportional to the sales as well as the color of the box. What if I want to see as a pie chart? So just pick and choose, and you may be able to see different representations and see if any of them would be insightful for what you're trying to come up with. I'm going to go back to the bar, which is one of the most popular data visualization techniques. And I actually want to sort this in descending order. How do I do that? I just click descending order here. And now I have my top and the top and I have my report. So building charts can be that simple. So let me put here rep, sales.