3 Analytics for Sales: Demo for Sales Manager - DataSelf / Tableau
DataSelf shows sales managers how to build interactive dashboards that pull CRM, ERP, and marketing data together. Run weekly reviews, spot account problems like year-over-year declines and open orders, and coach reps with real data instead of waiting for reports.
Chapters
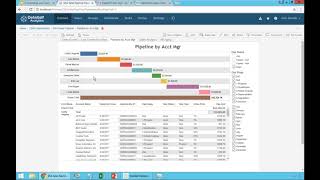
Now I want to show some examples of sales manager dashboard. So I'm not talking about the salespeople but the people who manage salespeople. And the examples I'm going to be showing here is actually some examples that some of our clients. Actually the example I'm going to be showing is for one of our clients that went through or constantly going through a process to analyze how they can make the management of their salespeople more efficient. How can sales managers understand what's going on and influence the salespeople to be more targeted, to be more efficient and to close my smart sales. So now I'm going to just switch to data self analytics. This could be done in any tool, could be Excel, could be, you know, other BI solutions. I'm showing data self analytics because it's actually what we usually provide it to our clients anyhow. So this company, when they started investing analytics, they want to have their sales managers and salespeople a lot more aligned with what was going on. Trying to find trends among different salespeople and different clients that would be the good trends or the bad trends to help the whole sales team to learn from those successes and mistakes to be better next time. So they started as a journey, as I mentioned, you know, when you start, if you're not on top of your things, you don't know exactly where you're going. But it's an exciting process, you know, as you learn things and you help your sales team be more educated, you can improve a lot your efficiency. So this is a dashboard that a sales manager pretty much every week on Mondays he will look, you know, we pretty much have the salespeople and then bars for each one of them telling how much the opportunities they have in the CRM system here we see the whole opportunities and then he can filter these opportunities by if it's open and closed, what is the stage of the opportunity, what months expected to close if and at the bottom he has the actual opportunities in the CRM system. So it's a kind of a vanilla obvious pipeline dashboard that usually you find in CRM systems that provide this kind of perspective. But the reason why they decided to use dataself to replace their CRM and ERP reporting was because they said, Johnny, we really need to be flexible analyzing our trends, being able to change things and experiment and what we've been trying to do for the past year and a half before data self was working with it and some report writing that they have in pretty much every interaction that they want to change how things would look in the dashboard, how they would bring data together. It would take usually days, days or weeks for it to come back with the final modification. The way that the salespeople was working in something they would like to do, like in three months, usually would take six months to one year to get it done because just the whole reporting and analytics was just too cumbersome. They have to submit a request, wait for it to get it done. So say no, we need to become independent. We need to start slicing and dicing our data, putting these dashboards together, experimenting, discussing with salespeople. We need to get it out of this equation. Support us, yes, but let us be independent. Anyhow, when they started this process, they had pretty much the same kind of dashboard that they had in the CRM system. So like I said, kind of vanilla. But the cool thing is what I'm going to show you is the end result of about four months of interacting with the framework and customizing it. I'm going to show an example. So let's say the account manager would be talking with ad, which is one of the salespeople. So start the meeting. He clicks on add and then right now he only sees ad opportunities. Right now I'm just looking at opening. I could discuss what he won, what he lost. You know, would be a very interactive discussion. Anyhow, he has control of filtering of the different options. However, once they go into, okay, now what opportunities on the pipeline? How can I help you? What's going on with this client? Is it good? Is it bad? Then they realize there's several kind of, kind of questions or discussions that would be involved in salespeople that they should have in their fingertips to quickly go through those trends that are critical for the discussion. For instance, so talking with Ed and hey, Ed, how about, you know, this client here is a big opportunity. Is it still early in the process, what's going on with this client? What else we have with them? Right? So before the sale, they have to go and jump into different reports and go to the ERP system to look at what invoices they sold. Are there any sales order? Is the client with pending receivables? You know, usually a relationship with a client has so many different pieces connected with your business. And sometimes some of those connections are critical for you to do better when you're dealing with a new opportunity. So what this organization did is they build this dashboard and when you click on this person, this particular client, now we have these four different drill down or drill through options. They can go click ar, aging and See if this client is current, if something delays, you know, because sometimes that's something important for their business. They can just email the prospect, you know, email right there, send an email to ask something so they don't have to go to the email, find the address of the person. And so quick and easy. They use marketing automation tools that bring information from website visits, what page they visit, how many social media interactions. So they could go to the marketing automation tool specifically to see what this client is doing their website. And they also created this dashboard that shows information from their ERP system. I'm going to click right now, so I'm going to go into sales analysis for this particular customer. So right now, just by clicking on this second option, they go to a different, in this case is a different part of the dashboard that shows year over year sales for that particular customer by brand and by product. So in this current month they see last year and this year side by side, by brand and by product. And if the sales is going down, it shows as this orange color. If it's going up, it's showing as blue. So the idea for this business is because they have seasonal business. And this report, by the way, is month to date. So let's say if we have 15 days, if you want June 15, we're comparing how much they bought last year through June through the 15th compared to this year. So it's a true side by side comparison. And if you have decline, that can be a problem. So the idea here is, for instance, they look at this like in this case, of course, I pick a situation that could be a problem. We're seeing many declines with items. The total for the month, it is a decline versus last year for this brand. And is this a trend? Is this a problem? Is this just, you know, a hiccup? Well, let's see, let's check what happened last month. So in this case, this is something that they do. They can select different months and sure enough, overall, the business last month also declined. Well, that's two red flags. Some items are declining and last month comparing to the same month last year, it also declined. Well, maybe you need to dig further to see what's going on. Call the client to see if there's competitors, if they're not happy. But making this kind of, you know, flow that you don't have to go to different reports, to different systems call it to be right there on the spot is very informative. They have also at the bottom here another section that shows open orders. You know what, this client already has in the pipeline or actually in actual orders that are supposed to ship this month, next month, in the future. So the point is the idea of this interaction as make the meeting between the sales manager and the salesperson face something that people can focus on the business issues and not jumping through loops and hoops in Excel sheets and complications. Oh, let me see. I don't have this information. Let's talk again next week. No, you need to fine tune your process. You need to learn your process and fine tune in a way that you can give these people tools that they can focus on the job and move forward and not being scrambling with the reporting analytics tools. And overall, I have some other reports here in dashboards that are also being used by this organization. I thought this one was an interesting perspective. This one shows by salespeople, these are how many weeks since the last contact with a particular lead or client. And then the color of each of these cells relates to how much an opportunity is into that particular bucket. So let's say if I click on this one for Dan, there's 12 opportunities that are here at the bottom with a total of $3 million. And then, hey, Dan, you know why you're not calling again these people? You know, you should call these people every week. You shouldn't wait for a full week to call these important leads. You know, salespeople are super busy usually, and sometimes they can lose track of what's important or sometimes they actually they're just handling the account because that's their job. But let's say a particular client might have some other issues with the business that the sales manager knows that the account, the salespeople doesn't. And then having this kind of dashboards will help them have again a more educated, a more targeted conversation among the opportunities to be more efficient when they tackle sales opportunities with clients. And again, all of these things are interactive. You click, you can drill down, you can go to the reports. The last one, which is also pretty popular, is having sales funnels that you can also filter by different ways, interactive that you can click, you can email, you can go to other dashboards. All very interactive and all very targeted specifically for procedures that will help the sales team be more efficient. Alrighty, let's move forward. I'm going to make a second quick poll, so let me just launch it. So just clicking. What are your main reporting challenges? And be sure to check all the options and click the submit button. Don't forget to click the submit button. Ten more seconds. Five more seconds. All right, thank you very much. Just sharing quickly. So did code to use is the top one and data consolidation the second one. Thank you very much. Let's.










