3 Analytics for Services: Service KPIs - DataSelf / Tableau
A speaker walks through how to improve service KPIs by analyzing people, processes, and technology through time, segments, and outliers. An HVAC company added preventive maintenance in slow months to cut peak-season demand and boost revenue. Another firm matched technicians to jobs using a matrix and raised first-time-fix rates.
Chapters
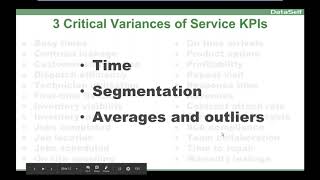
Now this page is pretty busy. I'm not going to go through this page. But These are popular KPIs, KPIs used for service organizations. You know, key performance indicators. You know, once you got the PowerPoint, you should take a look at this and see if you are missing some of them. These are the most popular ones. Now what's interesting is that quite often when people look at these metrics or when they're monitoring these metrics, they monitor the metric per se. Let's say busy times, okay? What hours of the day is busy, what days of the week are busy. So you're just looking at the metric per se. What is interesting, actually, that we've been learning with our clients and also reading around, actually there are three critical components of pretty much every single of those main KPIs that people use. There are three critical components that affect those KPIs. One is people. I mean, this is a service organization. So usually everything you do has people involved. The second is processes. Are your processes being efficient to deliver whatever service that you're, you're addressing. And finally, do you have the right technology to help these people get the job done? So if you take every single of those KPIs, usually you can find different components where each one of these three components can affect dramatically the outcome of the KPI. And we'll talk a little bit more about that in a few minutes. But it's very important to keep that in mind. It's pretty much about people processing technology. Now even when you look in these three components, usually you also have to see these three critical variances over how these three critical variances are affecting those KPIs. Time is a big one. Is it changing over time? Should you be looking on an hourly basis? Should be looking on a daily basis? Monthly basis? Weekly basis? On a seasonal basis. Many organizations that when we start engaging with them, they have a very narrow perspective at looking at how times affects their KPIs. And usually once they start embracing analytics and they start to look very easily for the same KPIs in different times. You know, times of the day, of the week, of the month, of the quarter of the year, the season, they start to see trends that repeat themselves over and over. By seeing that, you can much more effectively predict your demand of labor, of parts, of processes, and much more quickly address those needs. Segmentation is also a big thing. Segmentation is about looking at your KPIs from different angles. Maybe by different region or maybe by different kind of equipment that you service. There's so many different ways that you can slice and dice these KPIs. And if, if you do it properly with the right tool, quite often you can find some segmentation that influence significantly the efficiency of your services. Again, sometimes different regions, they will have very different KPIs. Because let's say if you are in the air conditioning business and if you are servicing, let's say Canada in the winter versus Florida winter, it's very different. And sometimes those things might be obvious, but until you look at the details, you can find some factors that dramatically can change the outcome of the service overall. The other thing is usually when we start engaging with companies, they're always looking at averages of the KPIs, which is very common. But also as you start to put outliers, and again, looking from a time perspective, segmentation standpoint, sometimes the outliers are very insightful because they can show you the very efficient or very inefficient things that are going on. And by learning those, sometimes you can see what's going on and fix the problems or learn from those very efficient cases and try to train the rest of your organization to take advantage of something that someone learned because they did something slightly different than everyone else. So looking averages in outliers is also very critical when you're looking at this whole KPIs. Now let's see some, just talk some examples out of those several KPIs of how those components affect busy times. I'm going to talk about an example of a client that at the beginning they were servicing actually air conditioning and heaters. And overall they have a fairly stable number of staff of service technicians throughout the year. But then in the summer they usually would have to hire several additional people because summertime the demand for services was much higher and they just couldn't take care of it. So usually have a hard time leading to summer and hiring people to help taking care of the higher demand. And at the beginning, when they start with the analytics that was just trying to cope with that kind of high demand, they were pretty much following already the AC manufacturers, preventive maintenance procedures. So everything was pretty much doing as they were supposed to. But then with analytics they started to look at much more closely, looking at the past of their services, segmenting different parts of the country, how things were working, and make a long story short, they started to find out that in their client base there were certain parts of the country where they started to do maintenance, additional maintenance, preventive maintenance in certain components. In the experiment in different ways in different regions that were supposed to be similar. And eventually they realized that they started to do more maintenance in the. In the low season of certain pieces that usually don't need much preventive maintenance. And actually by doing that, they were able to reduce the demand of services in the high season and make a long story short. So they did this research, they added some additional sensors in their equipment to try to pinpoint which of these machines would require this additional maintenance in the low season. So their overall cost actually grew with these additional processes. However, because of that, they actually lowered the demand in the high season in the summer. And even though the overall cost of this whole operation in a yearly basis was not much better than before, but the client satisfaction went up significantly because now their clients have less issues throughout the summertime. And because of that they started to get more business because of the customer satisfaction. So it was an interesting case where initially the busy times was just like everyone else doing just busy time analysis. But by experimenting in different regions and understanding better the little details of the whole operation, eventually they increase customer satisfaction, they increase revenues in the cap cost at low. So it's interesting again that the people, technology and processes in looking different segmentation over time and outliers can help you really affect the performance of a single KPI. Such a busy times. Another example from another organization is the first time fix rate. So usually you're trying to have a very high first time fix rate. And commonly at the beginning when people start addressing this metric, one of the very first things that people try to do is try to find when you get a call from a client, a new call is try to find in the vicinities which of the technicians are available that have the parts and have the skills to do the job. That's, that's pretty common, you know, have the parts and have the skills based on what the dispatcher picked up during the call. Well, some of our, one of our clients that went through this process and you know, they were trying to, I mean, they went to this process and look in the same available and parts and whatnot. And they had a large number of technicians in the field and they were usually using training and trying to do better with the parts to increase first time fix rate. But still at one point they start to just look at segmentation of their technicians, segmentation of the product they were servicing. And eventually they actually came up with a matrix of people and equipment, service and also type of jobs that came up with a matrix of that information that actually they were able to See that in a way, a chunk of their technicians, they would be efficient regardless of the products, regardless of the problems, they would do the job fairly well. But a subset of the technicians, they were actually much more efficient with certain products in certain type of services, and others would be in other segments. Sometimes some people were more efficient with more complex problems, some other people with simple problems. By making this matrix, they came up with a new framework where when a dispatcher would allocate a person for a job, they would try to find the best fit of what is the best person to take care of this job. Sometimes this person is not necessarily close as someone else, but this person would be so much more efficient to do the job that is worth waiting a little bit more to get this person for that job. So by being able to break down the problem, much more detail to assess how the segmentation of the data can affect the performance of the service can dramatically improve KPIs. In this case, such as the first time fixed rate, if we have the time. I could go over a lot of these different metrics to give you different scenarios where using analytics to slice and dice and break down these KPIs in little details has helped organizations make their services so much more efficient. So it's amazing how putting smart people to look at the data in detail is amazing how much more effective you can make your service organization.










